Leading IT Transformation – Workshop 21 (Fine-Tuning Kanban)

The Appleton Greene Corporate Training Program (CTP) for Leading IT Transformation is provided by Ms. Drabenstadt MBA BBA Certified Learning Provider (CLP). Program Specifications: Monthly cost USD$2,500.00; Monthly Workshops 6 hours; Monthly Support 4 hours; Program Duration 24 months; Program orders subject to ongoing availability.
If you would like to view the Client Information Hub (CIH) for this program, please Click Here
Learning Provider Profile

Ms. Drabenstadt is a Certified Learning Provider (CLP) at Appleton Greene and she has experience in Information Technology, Information Governance, Compliance and Audit. She has achieved an MBA, and BBA. She has industry experience within the following sectors: Technology; Insurance and Financial Services. She has had commercial experience within the following countries: United States of America, Canada, Australia, India, Trinidad, and Jamaica. Her program will initially be available in the following cities: Madison WI; Minneapolis MN; Chicago IL; Atlanta GA and Denver CO. Her personal achievements include: Developed Trusted IT-Business Relationship; Delivered Increased Business Value/Time; Decreased IT Costs; Re-tooled IT Staff; Increased IT Employee Morale. Her service skills incorporate: IT transformation leadership; process improvement; change management; program management and information governance.
MOST Analysis
Mission Statement
The implementation of Kanban can be made more fruitful by fine-tuning the process and adding ways to monitor and measure the success of the method. The implementation of Kanban principles may seem easy but in practice, there may be many challenges that an organization faces. The Kanban method not only affects the program it is being applied but changes the way the entire organization works. Workflows from one desk to the next only when there is capacity. Products will be procured only when there is a need. These practices, though highly beneficial to the organization overall, may be hard to adopt for all employees. So training and knowledge sharing are important to ensure that all employees are able to recognize the real benefits of using the Kanban system. Once the system is rolling, it is also important to measure its progress and its impact. For this, certain metrics have to be chosen which can reflect how Kanban has improved the process. These metrics could be time-based, productivity-based, and so on. For example, the lead time and cycle time shows the average speed of a team on a task during a given time period. Improvements in the lead time and cycle time are indicative of improvements in the process. Another metric commonly used is Throughput, which gives the number of tasks finished with a given time period. Improvements in Throughput also indicate improvements in workflow. These and other metrics can help to continuously monitor the implementation of Kanban and measure its success.
Objectives
01. Never Pass Defective Products: departmental SWOT analysis; strategy research & development. Time Allocated: 1 Month
02. Take Only What’s Needed: departmental SWOT analysis; strategy research & development. Time Allocated: 1 Month
03. Produce the Exact Quantity Required: departmental SWOT analysis; strategy research & development. Time Allocated: 1 Month
04. Level the Production: departmental SWOT analysis; strategy research & development. Time Allocated: 1 Month
05. Process Optimization – Lead & Cycle Time: departmental SWOT analysis; strategy research & development. Time Allocated: 1 Month
06. Process Optimization – Throughput: departmental SWOT analysis; strategy research & development. Time Allocated: 1 Month
07. Kanban Metrics Charts: departmental SWOT analysis; strategy research & development. 1 Month
Strategies
01. Never Pass Defective Products: Each individual department head to undertake departmental SWOT analysis; strategy research & development.
02. Take Only What’s Needed: Each individual department head to undertake departmental SWOT analysis; strategy research & development.
03. Produce the Exact Quantity Required: Each individual department head to undertake departmental SWOT analysis; strategy research & development.
04. Level the Production: Each individual department head to undertake departmental SWOT analysis; strategy research & development.
05. Process Optimization – Lead & Cycle Time: Each individual department head to undertake departmental SWOT analysis; strategy research & development.
06. Process Optimization – Throughput: Each individual department head to undertake departmental SWOT analysis; strategy research & development.
07. Kanban Metrics Charts: Each individual department head to undertake departmental SWOT analysis; strategy research & development.
Tasks
01. Create a task on your calendar, to be completed within the next month, to analyze Never Pass Defective Products.
02. Create a task on your calendar, to be completed within the next month, to analyze Take Only What’s Needed.
03. Create a task on your calendar, to be completed within the next month, to analyze Produce the Exact Quantity Required.
04. Create a task on your calendar, to be completed within the next month, to analyze Level the Production.
05. Create a task on your calendar, to be completed within the next month, to analyze Process Optimization – Lead & Cycle Time.
06. Create a task on your calendar, to be completed within the next month, to analyze Process Optimization – Throughput.
07. Create a task on your calendar, to be completed within the next month, to analyze Kanban Metrics Charts.
Introduction
An overview of the history of the Kanban software development methodology and the significance of the fine-tuning stage
Let’s look at the following exurb. It is from David J. Anderson’s blog post titled “A History of Kanban for Creative Knowledge Work.”
October 2004
Dragos Dumitriu seeks assistance from David J. Anderson, manager of Microsoft’s XIT sustaining engineering. Dragos’ team has a pull mechanism that David designed and helped introduce. Dragos then persuaded his four product managers and his four superiors to support the concept.
The system was implemented by Microsoft Product Studio without the use of a physical board, and the engineering team was located in Hyderabad, India.
The method used operated under the assumption that the test was the bottleneck and was modeled after the Theory of Constraints Drum-Buffer-Rope.
2005
Donald Reinersten followed David to his house in Seattle after seeing him present his flow and FDD material in the winter of 2005 at a conference in Chicago. On the Microsoft campus, David was visited by Donald, who persuaded him to explore Kanban methods.
David makes the choice to go back and redo the XIT implementation as a Kanban system. He finds that not much would alter; possibly the WIP limitations would vary significantly.
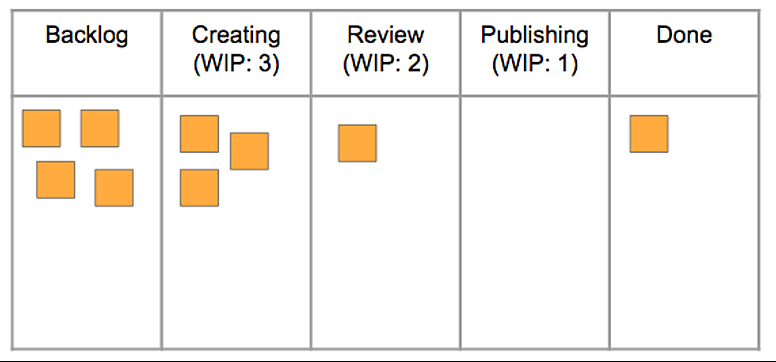
David starts referring to the XIT implementation as a virtual Kanban system and presents it the next year in Chicago since he finds Kanban systems easier to describe to others.
The XIT sustaining engineering research was presented at TOCICO in Barcelona in October 2005, and Microsoft later released it as a white paper.
2006
In the winter of 2006, David gives a presentation at the same Chicago conference where Donald had followed him home the year before on the finished XIT narrative as a virtual kanban system implementation.
It is the first time that Kanban systems applied to knowledge work have been shown in public. Only Dragos and David were previously involved.
The Microsoft IT solution was read and used by certain people in the summer of 2006. Notably, Eric Landes from Robert Bosch copied it almost verbatim for use by a team responsible for maintaining an intranet website.
David moves jobs in September of 2006 to work for Corbis as Senior Director of Software Engineering.
He acknowledges that the software maintenance procedure is seriously flawed and collaborates with Rick Garber, the team’s boss, to create a Kanban system.
It was intended to take the place of the current project-centric strategy for small application changes.
Drew McLean, VP of Corbis, recommends the expedite capability—which brought the first alternative class of service to a Kanban system for knowledge work—when engaging with stakeholders.
In November 2006, Diana Kolomiyets, the project manager, and Darren Davis, the development manager for maintenance, took charge of the Kanban implementation.
Diana oversees replenishment meetings every week, plans and coordinates releases every two weeks, while Darren is in charge of standup meetings.
Corbis conducts an operations evaluation of its IT in December 2006. Darren Davis explains the evaluation’s findings after implementing the first Kanban system.
2007
In January 2007, Darren Davis made the claim that the seeming high level of variation inflow was caused by the stasis of improvements following a number of successful releases from the maintenance process. Nobody is sure of what to do next.
He proposes using a card wall that has been set up on a whiteboard across the hall from his cubicle to visualize the procedure. One of his team members came up with this concept. A sign is placed on the wall.

Winter of 2007: Additional improvements are being made to the wall, and space has been set aside for internal needs. For green tickets, there is a WIP limit of two.
David observed a pattern of urgent work with predetermined deadlines. As a type of service, he advises providing a “fixed date” notion.
At the end of this season, what is now known as the Kanban technique emerges, with its six practices and hazards displayed and addressed via capacity allocation and classes of service.
At Corbis, Corey Ladas is employed as a process coach for Kanban after leaving Microsoft.
The new CEO of Corbis inquires in April 2007 as to why the new maintenance procedure isn’t being applied to all aspects of IT if it is performing so effectively. David adopts the idea and introduces Kanban to the entire project portfolio.
Under Corey’s direction, the digital asset management (DAM) project implemented Scrum and Kanban. This two-tiered Kanban board with swim lanes is the first of its kind.
Dan is hired as the development manager for the ERP project in May of 2007. Dan has never used Kanban, yet he and Corey created the project’s methodology.
They transfer the DAM project staff to the ERP project while carrying the two-tiered, swim lane Kanban board with them.
Rick Garber and David attend Donald’s Lean New Product Development conference in Chicago in June 2007. Only 55 people were present in the crowd.
It is the first time the now-famous Kanban approach has been shown, and it includes features like operations review, lead time histogram metrics, classes of service, and metrics for those variables.
David delivers the same speech from June at the conference inside a conference at the Agile Conference in Washington, D.C., in August 2007.
The following day, Karl Scotland, Joe Arnold, and Aaron Sanders, representatives from Yahoo!, are present and speak with David.
They express their admiration for David’s evolutionary approach to change and alternate strategy for achieving agility through the use of virtual Kanban systems.
They clarify that they have attempted to introduce Scrum at Yahoo! but have encountered significant opposition. With the organizations who are opposing, they want to attempt Kanban.
They created a Yahoo! discussion forum where they could share their stories. At Yahoo!, the kanbandev group was created today and is still in use.
2008
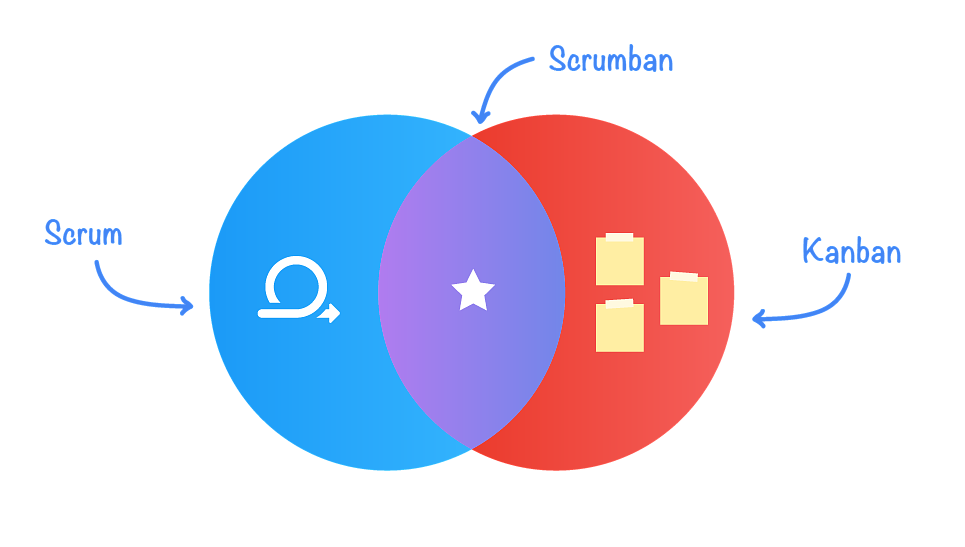
At the Agile 2008 conference in August of 2008, Corey Ladas offers more thorough implementation examples. The presentation’s second half focuses on applying Kanban in Scrum-based teams and projects. It serves as the basis for what would be referred to as scrumban.
2009
Published in January 2009, Corey Ladas’ book Scrumban describes how to use Kanban to advance Scrum.
The inaugural Lean Kanban conference, an initiative put up by the kanbandev group at Yahoo!, takes place in Miami in May of 2009.
Jim Benson and David had a meeting to discuss the conference in Miami.
They talk about how using Kanban for personal purposes differs from using it for business workflows (currently referred to as the Service Delivery Kanban).
Everywhere, even the Modus Cooperandi office, there had been a case of personal usage emerging.
Jim Benson releases Personal Kanban in July 2009 as a collection of 12 blog postings.
Jim Benson introduces personalkanban.com in October 2009.
2010
It has been published, Kanban- Successful Evolutionary Change for your Technology Business.
It has evolved into the greatest and most comprehensive guide for putting Kanban systems into practice in companies that employ creative and knowledge workers. Well over 40,000 copies have been sold.

Kanban at Spotify
This is likely one of the earliest and most well-known instances of how Kanban Fine-tuning functions in IT, excluding the Microsoft scenario that was previously stated. Scalability was the biggest issue, according to Mattias Jansson, an operations engineer at Spotify. He was implying that the operations staff was unable to develop along with the demands of the business.
They made the decision to use Kanban as their workflow management solution as a result. The group decided to start out easy. The graphic below shows how easily they set up a Kanban IT operations board:
• 3 columns (to do, doing and done);
• 3 horizontal lanes. Two for the main types of service: standard type and intangible stories and an expedite swimlane;
• They set a low WIP limit on the To-Do stage to ensure that the internal, intangible tasks are actually done;
• They also set a WIP limit on the Doing column equal to the number of ops team members minus one.
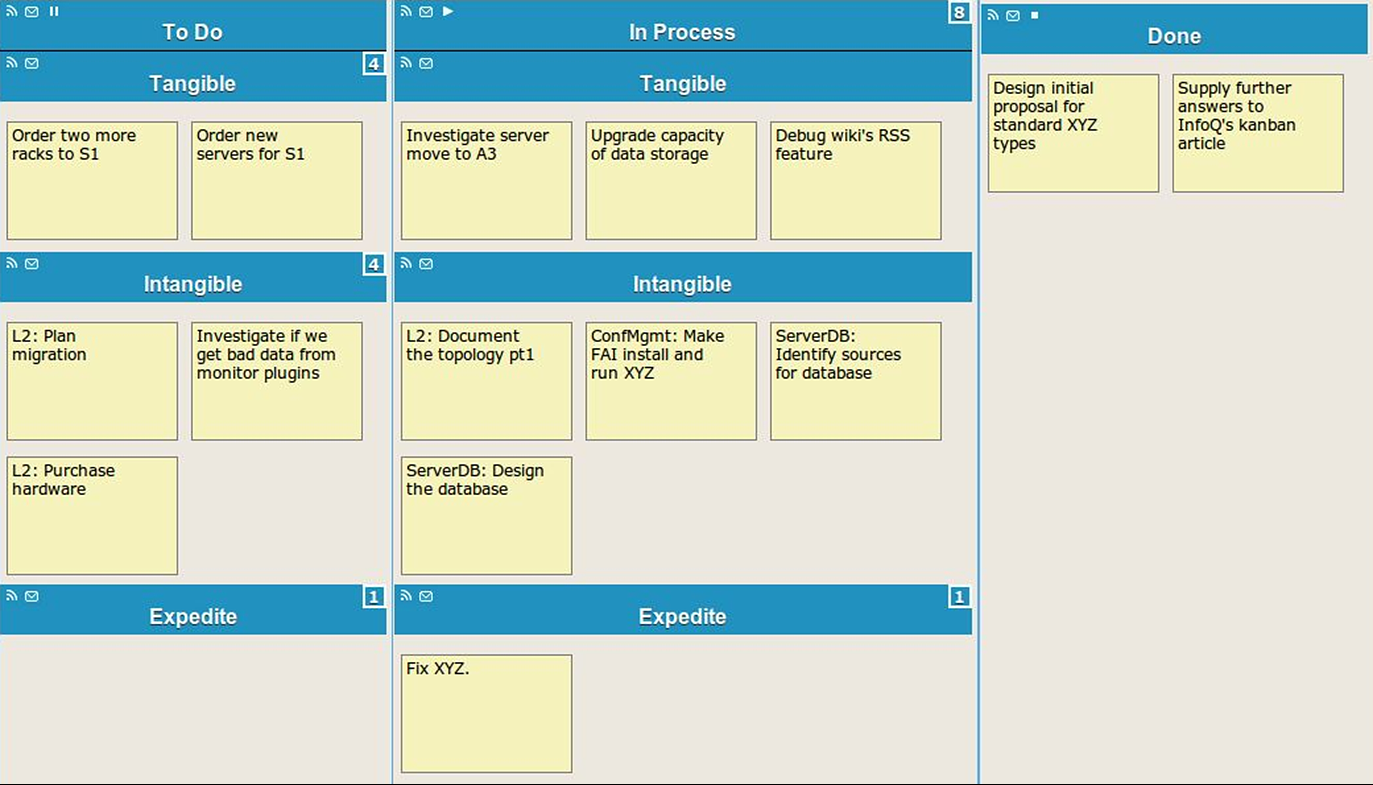
Image credit: infoq.com/articles/kanban-operations-spotify
After all, it appeared that Kanban helped the Spotify Ops team become more efficient. As Mattias said in an interview “We’ve noticed that our lead times are shorter, we get more internal tasks done, and the departments we interface with are happier.”

Fine-Tuning Kanban
To make sure your Kanban process is effective for your team, it’s crucial to fine-tune its effectiveness. You may evaluate the effectiveness of the Kanban system using various key measures. Understanding where there are bottlenecks and how to avoid them in the future depends on keeping track of these metrics, especially for your Kanban retrospective sessions. These metrics range from burndown charts to cumulative flow charts.
Kanban Metrics: What to Measure and Why
In this workshop, we’ll go through the precise Kanban metrics & analytics you should be utilizing to keep an eye on your team’s productivity, the effectiveness of your processes, and delivery times, as well as the warning signs of danger to look out for. In the prior workshop, we only touched on these metrics and analytics in passing. Today, however, we will go into further detail and present concrete examples to deepen our explanations.
Good and Bad Metrics: What Does It Mean?
You should be able to distinguish between excellent and bad metrics in order to avoid being duped by the latter. Metrics are excellent if they contribute to system improvement, to put it simply. They are bad if they reward or penalize specific people.
Metrics are Good if they:
• Are actionable and improve the decision-making process
• Lead to better results
• Portray the state of reality
• Improve behavior
Bad metrics:
• Are focused on the past
• Often lead to bad results
• Are used as targets
The expression “what gets measured gets managed” may be familiar to you. The Kanban Method’s fundamental component for tracking projects and gradually improving process efficiency is tracking progress and measuring performance.
Let’s take a quick look at the key Kanban metrics and how to use them to increase productivity.
Cycle Times
Cycle time, a crucial Kanban indicator, counts the number of steps a task takes to complete. In contrast to lead time, cycle time is only measured from the moment your team begins working on the task.
The metric that accurately gauges how long it takes your team to complete a task is called cycle time. Low cycle times demonstrate effective teamwork, while large cycle times point to a process bottleneck. Reducing cycle times also reduces lead times, which increases customer satisfaction.
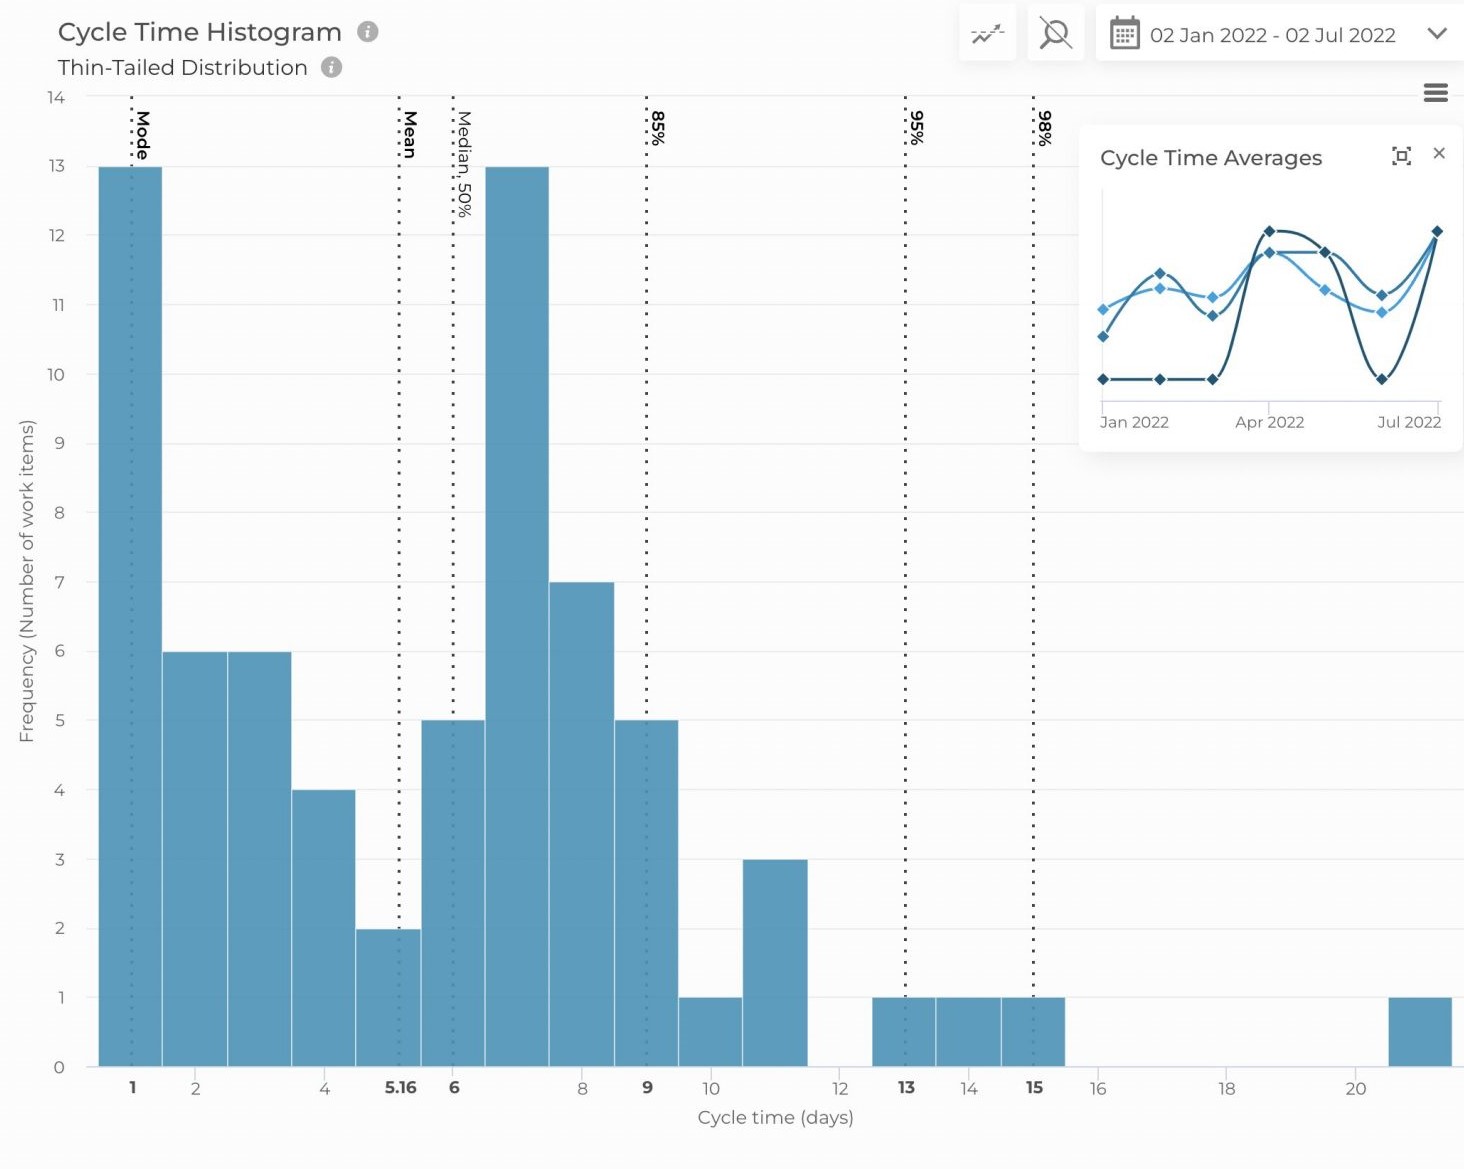
Source: Getnave.com
A cycle time histogram can be used to chart your cycle times over time and to forecast when your work will be delivered in the future. The percentile lines in the figure above show that once your team begins working on a task, there is a 50% probability that it will be finished in fewer than 6 days and a 95% chance that it will be finished in less than 13 days.
Throughput
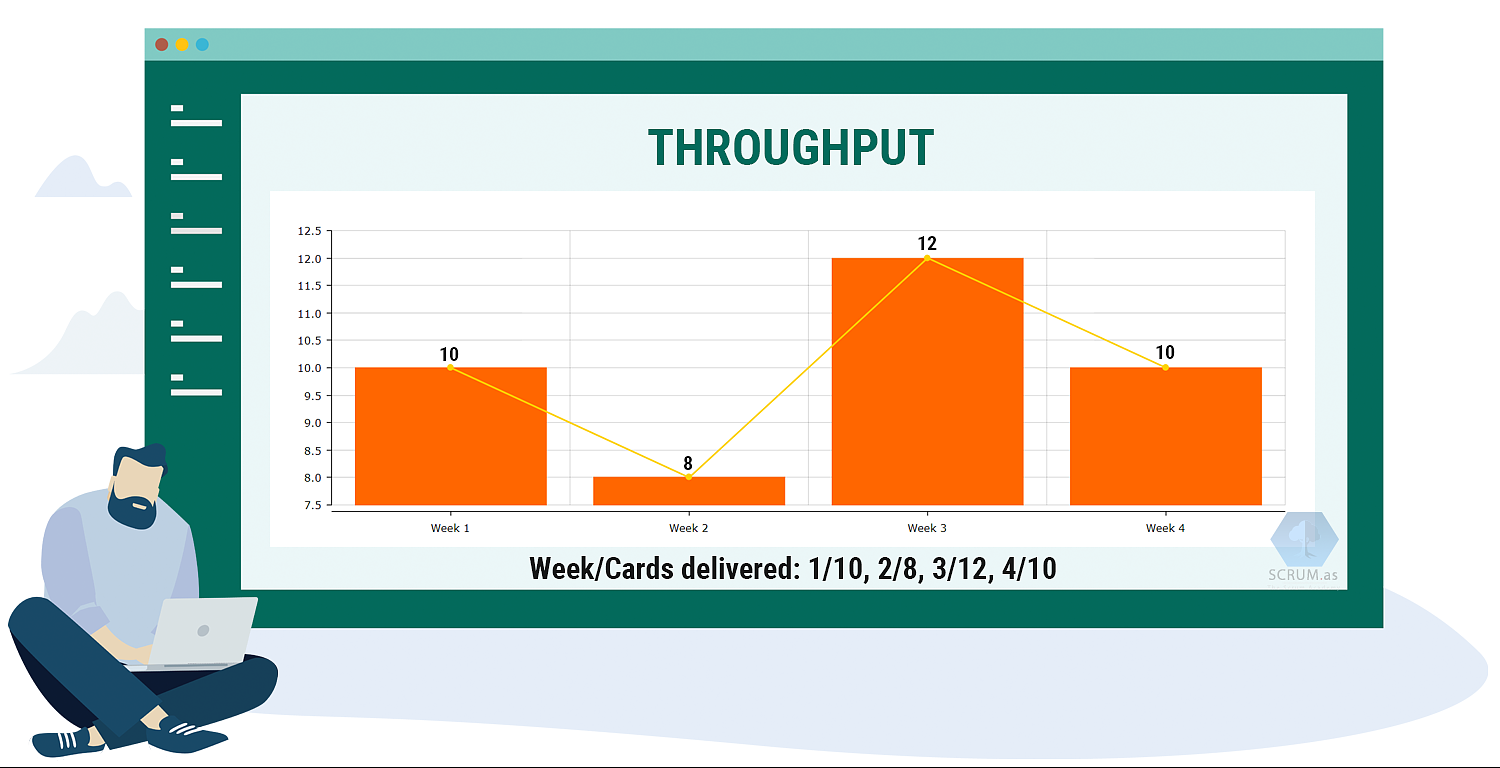
The throughput statistic in Kanban indicates the entire quantity of work delivered in a given amount of time, whereas cycle time monitors how long it takes a single job to complete the process. Nothing that is still in process is counted while measuring throughput; only completed work items are counted.
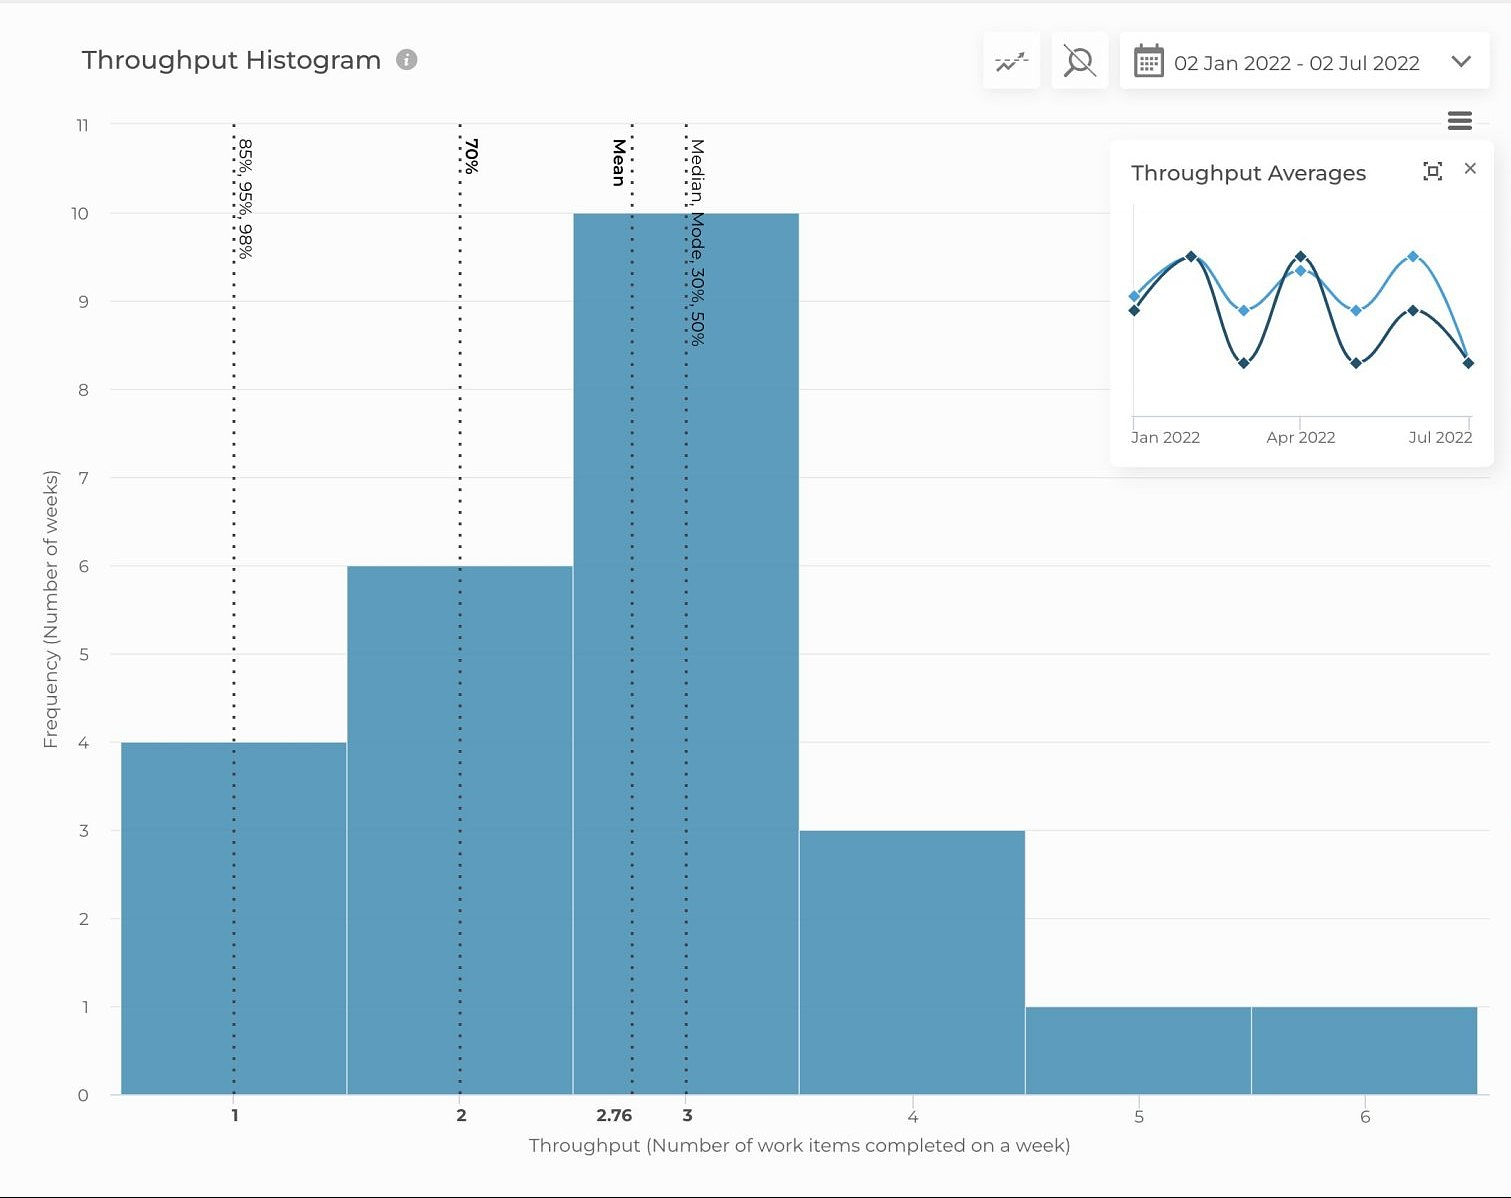
Throughput is an important Kanban metric since it can be used to gauge your ability to produce results. Consider a Kanban team with an average throughput of 5 tasks per week during the previous 5 weeks: 3, 7, 4, 5, and 6. We can estimate that this team can do 5 tasks per week on average without knowing anything about the tasks themselves.
The throughput histogram is used to measure throughput, which is used to track your team’s performance over time. This charts the frequency with which your team reaches a particular throughput over time. According to the graph below, this team has produced 3 items on average every week over the previous 6 months.
Source: Getnave.com
You can observe changes in your team’s performance firsthand by monitoring your throughput over time. A falling throughput suggests that something is negatively hurting your team’s capacity to produce and requires further attention. Ideally, throughput should remain the same or rise.
Work In Progress
Limiting Work In Progress (WIP), as was addressed in the prior workshop, is a crucial aspect of the Kanban Method for increasing team productivity. Consider this: Do you complete work more quickly when you divide your attention between several projects or when you concentrate on only one?
The ideal WIP limit for your team will vary depending on a number of variables, including the size of your team. However, a good starting point is to put the limit at around the same number as your team size so that everyone can concentrate on one work at a time.
Team Performance
Cycle times (how quickly work is completed) and throughput (how much work is delivered) are the two Kanban indicators that best reflect the performance of your team. To make sure you are giving your customers results, keep an eye on these metrics!
Little’s Law relates cycle time, throughput, and work in progress (WIP). Any system that satisfies the requirements of Little’s Law can use this formula.
Cycle Time = WIP/Throughput
The link between the three fundamental flow indicators is demonstrated by Little’s Law, which states that altering one will have an impact on the other two. For instance, WIP must reduce for a reduction in cycle time.
High throughput and quick cycle times are indicators of a successful team, but consistency should also be observed. You can examine the average value of your Kanban metrics as well as how this data is spread over time via the cycle time and throughput histograms. Your future forecasts are inherently more accurate when your values are distributed over a smaller range.
Cumulative Flow Diagram
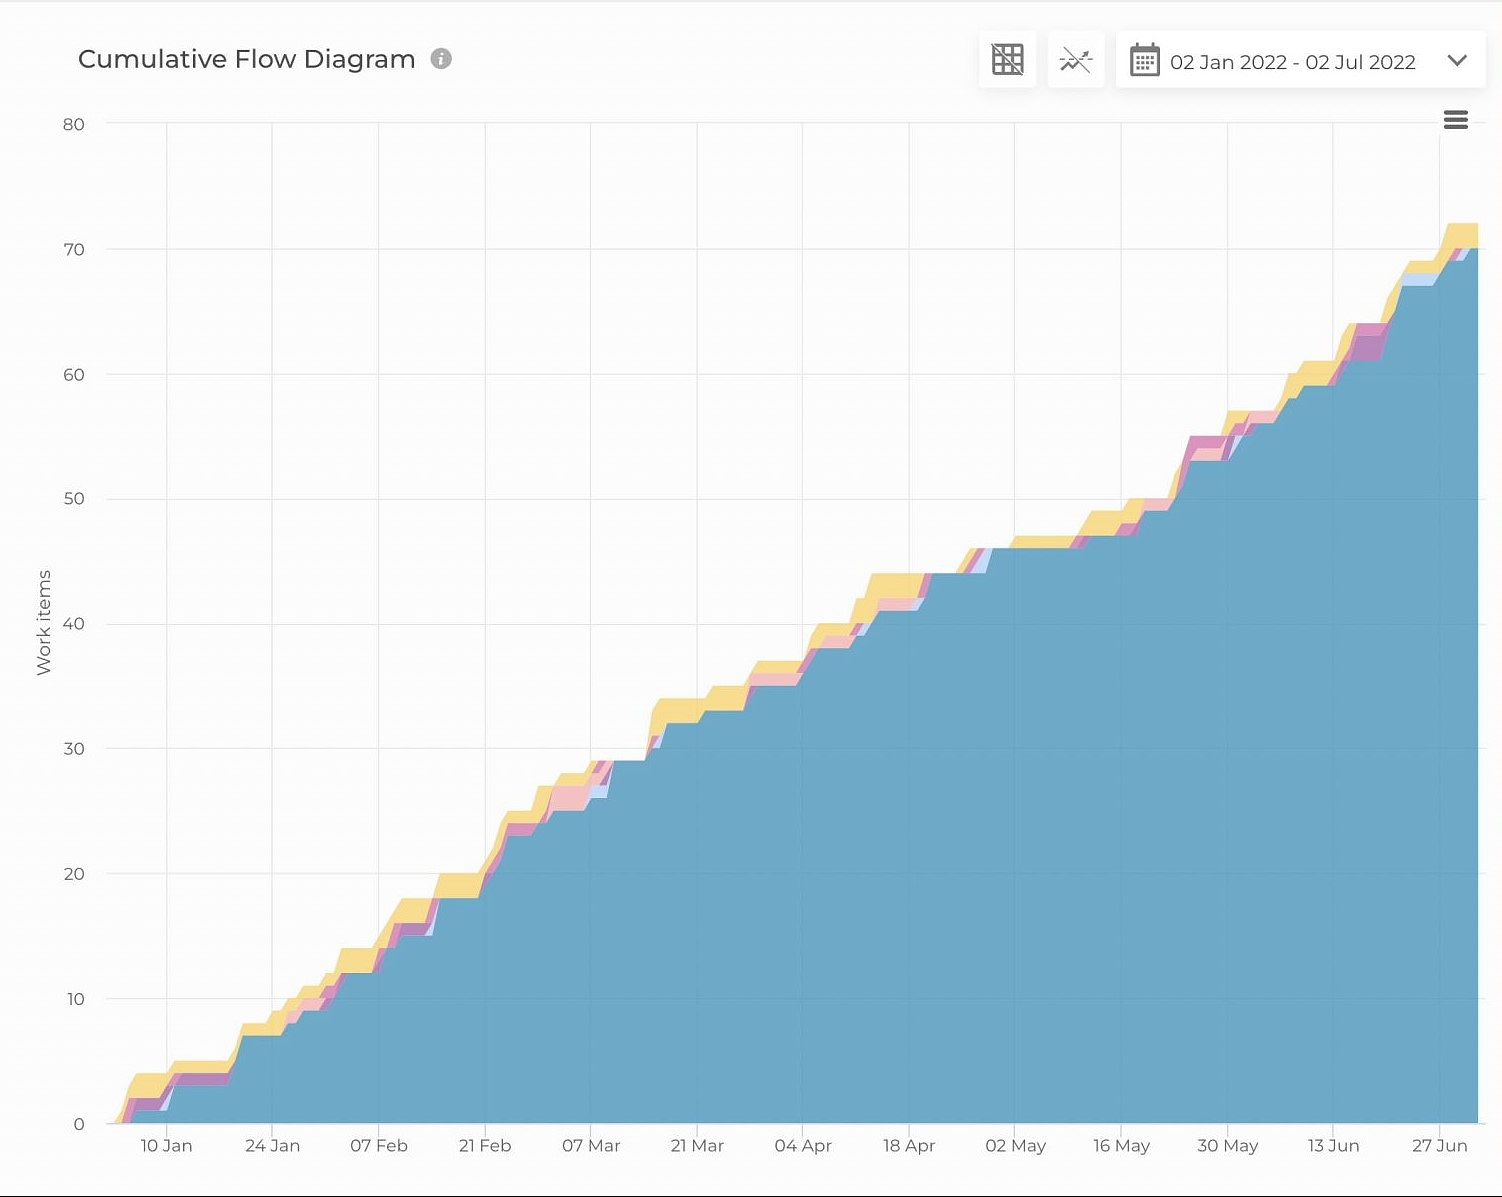
The Kanban Method focuses mostly on gradual evolutionary advancements. When used over prolonged periods of time, it is most effective. Cycle time and throughput tracking have already been covered, but the cumulative flow diagram is the true star for looking at process efficiency over a longer period of time.
Source: Getnave.com
The distribution of jobs throughout each process state is depicted in the cumulative flow diagram as they build up over time. The number of tasks present in each process state at any given time is indicated by the color of the corresponding band. Although it is possible to determine the approximate average cycle time directly from the diagram, the main advantage of the CFD is how quickly you can obtain a visual evaluation of the stability of your process.
The way the gradients of the bands alter over time can be used to quickly identify changes in your team’s performance. Your team is producing work more quickly if the gradient for the “Done” band increases. Contrarily, a steep rise in the gradient of the “In Progress” band denotes the onset of a bottleneck.
Bottlenecks
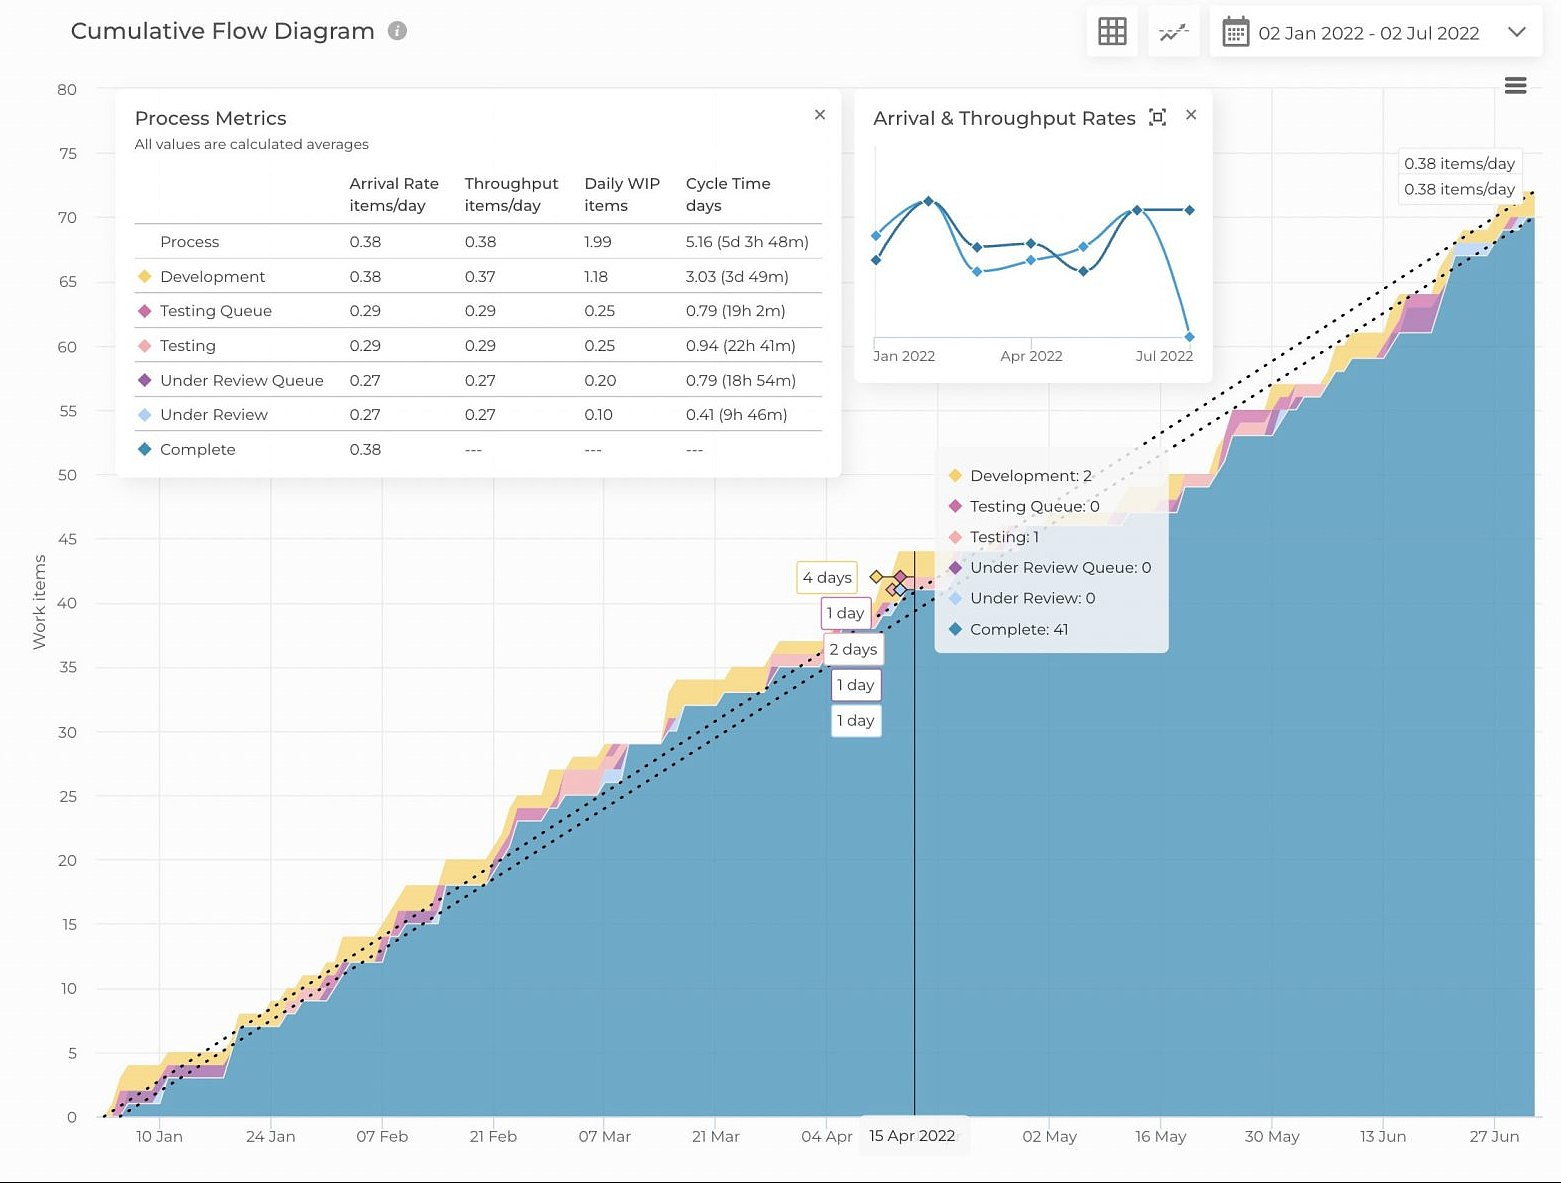
The bottleneck, or growing amount of work that is not being finished, is the strongest warning sign that your performance is about to suffer. The bottleneck indicates that your team lacks the resources necessary to complete the workload given to them in a timely manner.
You may identify bottlenecks as they develop using Kanban measurements. Symptoms to look out for include lengthening cycle times, declining throughput, and a rapid increase in gradient in your cumulative flow diagram.
Source: Getnave.com
When you start to notice bottleneck symptoms, it’s important to look closely at the possible causes. Is there an external demand that could be keeping things from moving forward? Has your work-in-progress cap climbed without your knowledge? If your team’s roles have changed, should duties be distributed differently? You should be able to remove bottlenecks before they become an issue by acting swiftly.

The Little-Known Facts about Little’s Law: How to Fast Track Your Way to More Predictable Delivery Systems
Stable delivery methods can help to attain long-term predictability. The phenomenon is eventually defined by Little’s Law. Let’s examine some little-known facts about the law to highlight the real benefits it offers to our business procedures.
What is the Little’s Law Equation?
Imagine that you manage a stylish and hip taco truck. Your organic, grass-fed shitake mushroom and carne asada burritos are well-known. Customers adore you because your freshly prepared tortilla chips paired with zesty salsa verde are the flavor of the season.
Let’s say that every hour, 20 individuals visit your taco truck. They stay for a half-hour, eating and conversing with one another. How many clients would be waiting outside your food truck at any one time?
Little’s Law states the following:

Based on that formula we can calculate that the average number of customers you handle at once is L = 20 * 0.5 = 10 customers.
So why does it matter?
The Purpose of the Law in Project Management
Let’s look at how business leaders use Little’s Law in the real world to make their workflows more predictable.
You can determine the capacity of your systems using Little’s Law. In order to achieve this, the formula can be written somewhat differently:
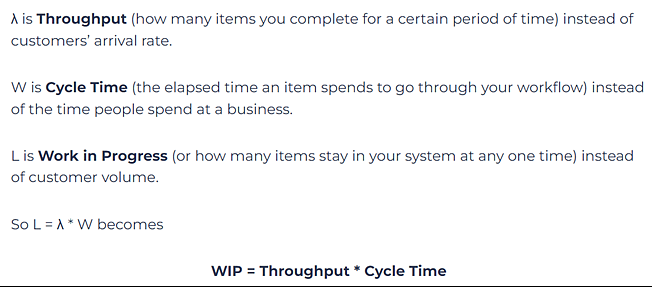
You must keep in mind the following three crucial points regarding Little’s Law:
• Little’s Law is an unreliable approach to making delivery commitments
• Little’s Law is an equation of averages
• Little’s Law is about examining what has happened in the past
Let’s look into all three in more detail.
Little’s Law Is an Unreliable Approach to Making Delivery Commitments
Most people would argue that the true value of Little’s Law lies in being able to make predictions in the future. So the question is, does the law serve this purpose?
Let’s look into the following example. Let’s say you have an average WIP of 6 items and an average throughput of 2 items per day. This configuration gives your team an average cycle time of 3 days.

What happens if we raise our WIP? The fact is, you cannot say that if you increase the average WIP to 12 tasks and keep the average cycle time constant of 3 days, then your average throughput will increase to 4 tasks/day.
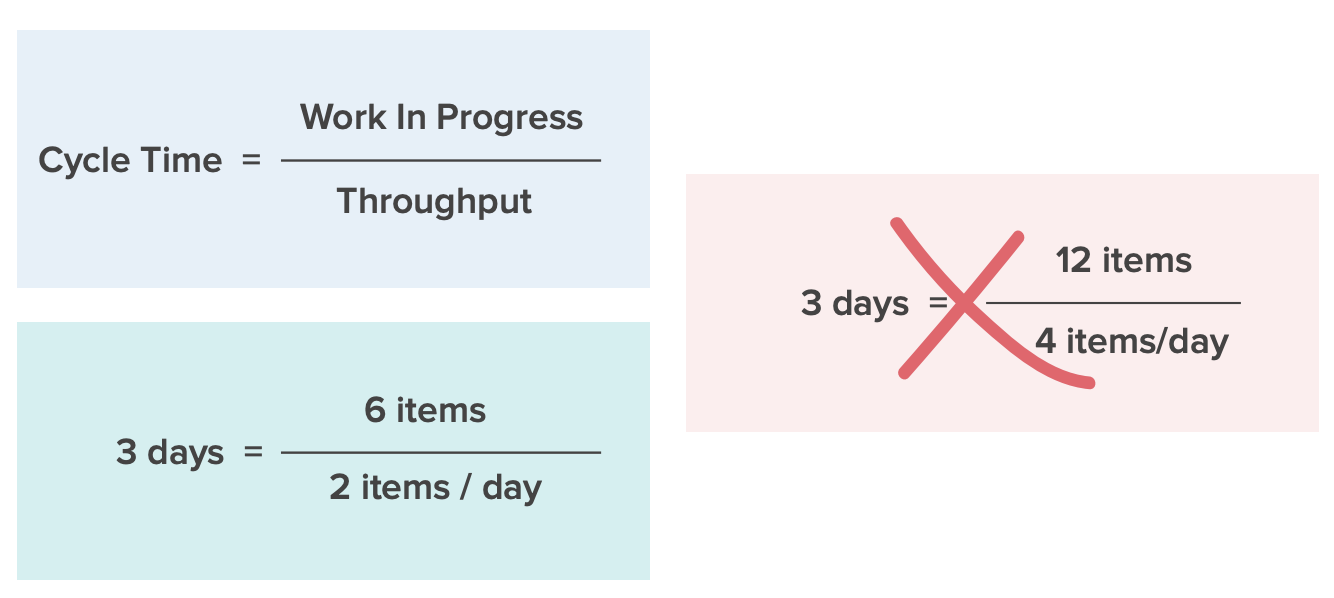
That forecast will not be made using Little’s Law. The only thing Little’s Law will tell you is that an increase in average WIP will cause an alteration to either (or both) of the two important measures, average cycle time and average throughput.
All of the underlying assumptions for the Little’s Law equation must be true for the time period under study. I’ll talk more about that shortly.
Little’s Law Is an Equation of Averages
In addition, Little’s Law is a relationship of averages since each element in the relationship is an average. An average will be produced by this calculation. Therefore, using this method we are unable to make any probabilistic predictions.
It’s dangerous to rely predictions on averages. Average-based forecasts would only make sense if you were familiar with the nature of the data’s underlying distribution. If you don’t, there’s no way to know if your chances of success are exactly 50%, significantly more than 50%, or significantly less than 50%.
Would you agree to a delivery date with a 20% likelihood of fulfillment? We categorically advise against doing this.
The Law Is All about Examining What Has Happened in the Past
Little’s Law is about examining the predictability of your system in the past. It was created primarily to assess the robustness of a delivery workflow using data that had already been acquired.
The average throughput rate and average arrival rate will be about equal in a stable system. This indicates that tasks enter the process at the same rate at which they exit it. Furthermore, the Little’s Law equation used to analyze your historical performance data will be quite accurate if you are in charge of your management procedures and you are upholding a predictable workflow.
Check your process measurements against Little’s Law to see if the equation fails. You can examine your work by process states using Little’s Law. The same idea applies in this case. Your system is more stable the more exact the equation. Furthermore, predictable systems are stable systems.
The Little-Known Fact about Little’s Law Everyone Should Be Aware Of
The equation itself is actually not that significant. Little’s Law’s true worth comes from its capacity to deepen our comprehension of the relationships among the three fundamental flow measurements.
The most typical trend is a steady rise in WIP. According to Little’s Law, as your WIP increases, so do your cycle times. In a world where Cycle Time is always increasing, how could you be predictable? You really can’t.
Each and every one of you should be aware of a little-known fact concerning Little’s Law. It almost doesn’t matter if you can use the Little’s Law equation or not. The underlying presumptions of the law are what give it its power. It offers guidance on how to adopt a set of process policies to promote uniformity and increase workflow predictability.
Executive Summary
Chapter 1: Never Pass Defective Products
Products and services that fall short of the criteria and degree of quality required should not be passed by upstream procedures. Products having flaws ought to be taken off the production line and handled elsewhere. This prevents waste, reduces consumer complaints, and assures that only high-quality products are delivered to your customers.
Policies aid in ensuring that the required standard of quality is upheld at all times. In the case of manufacturing tangible items, this is quite simple. The same is true for knowledge work, though.
Applications, for instance, go through extensive quality assurance testing before being deployed in software development. Functional, regression, integration, performance, and stress testing are just a few examples of testing types. The only time they can put features and improvements on the market is if the team decides that they all need to pass these levels of testing.

Making a product as high-quality as feasible is always a company’s goal while producing or developing a good or service. High-quality goods increase consumer happiness, which improves reviews and reputation and may increase future sales. Nevertheless, whether you are producing chairs, medical equipment, bicycles, or everything in between, there is always a potential that your product will be flawed.
But how can you handle these faulty goods in the best way while minimizing the harm they cause to your company? Here are a few pointers for coping with damaged products for businesses.
Never Intentionally Ship a Defective Product
Make sure you never knowingly ship a defective product as your initial step. Giving customers a product that you know isn’t right is failing them severely, even if your shipment date is drawing near. If enough people purchase things with a flaw, it could affect both people and your reputation.
Additionally, you can be subject to legal action if the flawed goods causes harm to someone as a result of their use. Claiming ignorance could be challenging, especially if numerous other people also receive bad merchandise.
Suits frequently have a strict responsibility or negligence defense. This implies that in order to perhaps succeed in a case, a person will not need to demonstrate carelessness on your part. That’s because it’s your duty to make sure everything you sell is secure for the purpose for which it was designed. So it is never a good idea to ship something out with a problem, no matter how minor or unimportant the issue may be.
Complete Thorough Inspections and Testing
Preventing the occurrence of defective products in the first place is one of the greatest strategies to handle them. For all of your products, this is accomplished by establishing stringent testing and inspection procedures. Testing is crucial since it can make sure your product is secure, legal, trustworthy, long-lasting, and prepared for sale. Products should go through several tests and inspections during the manufacturing process, as well as once more before they are shipped.
Before assembly starts, it’s crucial to inspect any outsourced or raw materials that will go into your product. This will assist in finding any problems before they are manufactured, which will ultimately save time and money. Given that mistakes are unavoidable, additional testing must be done more frequently in order to improve results and stop the distribution of faulty goods.
Get Ahead of the Issue
Even while businesses frequently try their best to provide high-quality goods, occasionally there are flaws that go undiscovered. If that occurs, it’s critical to act swiftly to head off the issue. Once the flaw has been found, you might need to get in touch with your consumers or issue a public notification. Accept returns without posing any inquiries. Try to be as sympathetic as you can, and avoid becoming defensive or rejecting the issue.
It can have serious repercussions for your business, including negative publicity and internet discussion, if you don’t accept returns or if you try to cover up any wrongdoing. If at all possible, avoid receiving negative feedback as it can have a significant negative impact on a company’s reputation. The overall impact of the occurrence will be less negative the better you address a fault and set things right. In conclusion, it might be challenging for firms to deal with a damaged product. By lowering the likelihood that a flaw will make it onto one of your finished products, the knowledge in this course manual will assist in keeping your clients secure and upholding your solid reputation.

Chapter 2: Take Only What’s Needed
Only pulling what is required is essential for a successful Kanban implementation. By doing this, overproduction is avoided, expenses are reduced, and operations are better suited to meet market demands.
It is relatively simple to implement this rule as one of the six Kanban rules for manufacturing processes. We might think of this in terms of knowledge work as merely focusing on client requests or orders as necessary. This entails adhering to the order of importance in your backlog.
Lean believes it is wasteful to have a backlog of ideas in order. How can that be a waste? Well, it takes time to continually strive to prioritize and polish an unending supply of ideas. What if they are never put into practice? Time squandered is the obvious solution.
However, you still need a mechanism to record your ideas, including customer feedback, when working on a project, product, or service. Otherwise, you run the risk of gathering significant amounts of disarray and misinterpretation of the true needs of the customer. That most certainly wouldn’t keep you on the proper track to agility for very long.
Therefore, use the Kanban backlog to gather and organize your ideas in order to reduce confusion. It enables you to continuously give value to customers and lessen the uncertainty of the work process.
What Is the Purpose of the Kanban Backlog?
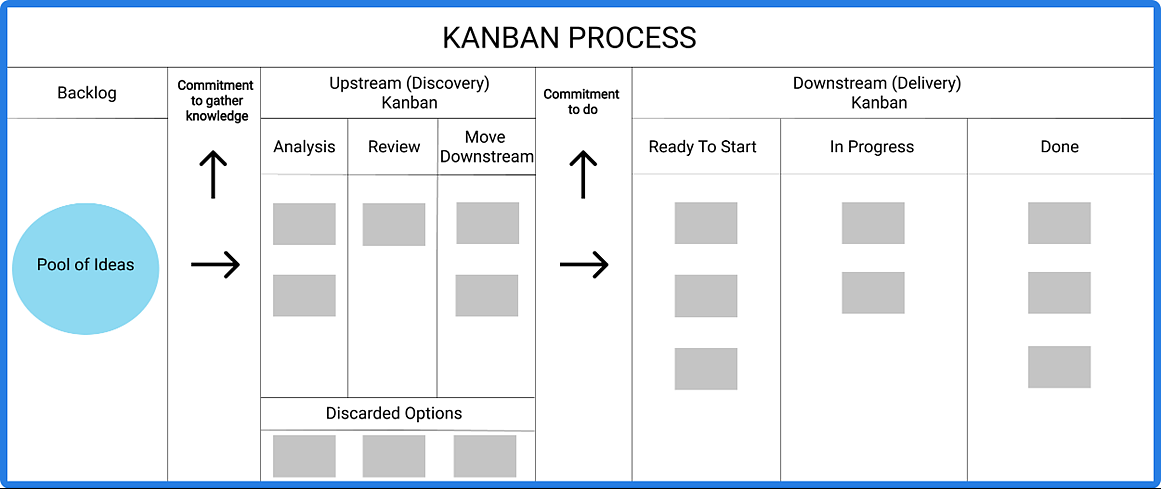
A project or product backlog is a visual depiction of the things you might or might not deliver, according to definition. The backlog “lives” on the leftmost area of a Kanban board, before the “To Do” stage (column).
When you move work from the Backlog to the “To Do” column, it means that you have all the necessary information and are certain you can complete it effectively (while ensuring good quality). Once the item enters the “In progress” stage, you are then committed to finishing it by the specified SLA (Service Level Agreement).
Having said that, it is important to note that the Kanban backlog serves more than just as a list of ideas and client feedback. Your goal should be to gradually make ideas more doable so that you may ultimately make them a reality.
Backlog Prioritization
Everything in the backlog needs to be preserved in a meaningful order, and this should be done with the least amount of work necessary. To do this, several priority levels might be established.
You can make a different graphic board to act as your backlog in the event that you need to assemble a sizable collection of ideas. Because there won’t be any work flow there, this won’t be a Kanban board. Simply use it as a tool to prioritize and better illustrate your rough ideas and client input.
Once your board is set up, you can divide it into columns to symbolize the various types of work and swimlanes to indicate the various levels of priority. Examples are High, Medium, and Low. The goods that are more in demand, demand more work, and provide more value to clients should be placed higher in the list of ideas.

Chapter 3: Produce the Exact Quantity Required
The third of the six Kanban rules complements the second. Taking only what you need would result in only producing the precise amount of goods needed. What are you going to do with the extra inventory if you overproduce? You’re stockpiling more expenses. These include the opportunity costs incurred from the materials and funds used to construct the product, as well as storage and shipping expenses. Additionally, there is a chance that the item will degrade or become outdated.
How does this relate to the process of knowledge? In this regard, adopting a Minimum Viable Product (MVP) approach is beneficial. You don’t need to include a print capability if a customer only wants the ability to download reports from your app, for instance. Keep your attention on the bare minimums. As the market requires or as your product strategy dictates, you can add to the product.
Minimum Viable Product (MVP)
A notion from the lean startup methodology known as a minimum viable product (MVP) emphasizes the importance of learning in the creation of new products. An MVP, according to Eric Ries, is the iteration of a new product that enables a team to get the most verified data about customers with the least amount of work. Whether your customers will actually buy your product is how you may validate your learning.
A fundamental tenet of the MVP concept is that you create a real product—which could be as simple as a landing page or a service that appears to be automated but is actually entirely manual—that you can offer to customers and watch how they actually use it. Asking individuals what they would do is significantly less reliable than observing what they really do in relation to a product.
Expected Benefits
An MVP’s main advantage is that it allows you to gauge customer interest in your product before it has been fully developed. You will spend less time and money developing a product that won’t sell if you can determine sooner whether consumers will find it appealing.
Common Pitfalls
Teams use the phrase MVP but don’t always understand what it means or is supposed to mean. This ignorance frequently takes the form of thinking that an MVP is the bare minimum of functionality they can provide, without the additional criterion of being sufficient to comprehend the product’s commercial viability.
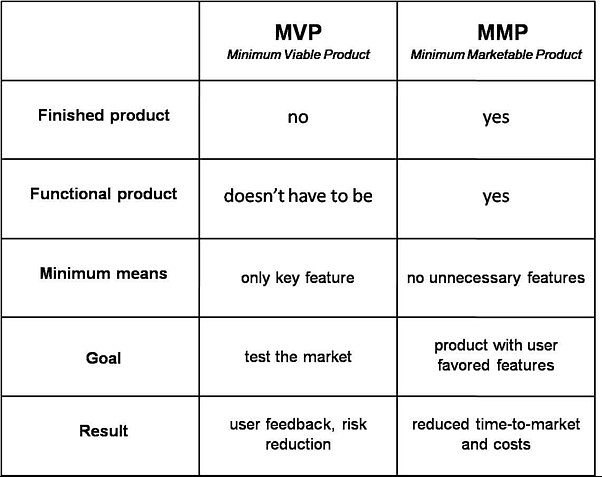
A Minimum Marketable Feature (MMF) or Minimum Marketable Product (MMP), which has a focus on income, may be mistaken with an MVP, which has a focus on learning. Unless the team gets overly focused on delivering something without taking into account whether it is the appropriate something that satisfies the customer’s needs, there is not much harm in this.
Teams place more emphasis on the MVP’s minimum requirements than its viable components. The quality of the product that was given was insufficient to determine whether buyers would actually use it.
Teams deliver what they view as an MVP, but after that, regardless of the criticism they hear, they stop making adjustments to that product.
Potential Costs
When an MVP is used properly, a team may drastically alter the product they give to their clients or even discard it altogether in response to the feedback they get. In order to avoid developing a product that no one will buy, the MVP’s minimum element pushes teams to work as little as possible to get relevant feedback (Eric Ries refers to this as validated learning).
Origins
2009: Eric Ries’ description of MVP in his book The Lean Startup helped the idea become more well-known.
Signs of Use
The MVP serves as the cornerstone of a team’s experimental approach. They postulate that the product the team is working on fills a need that their clients may have. In order to determine whether the clients would actually utilize the product to meet their demands, the team then offers something to those customers. The team decides whether to continue, change, or stop working on the product in light of the knowledge obtained from this trial.

Chapter 4: Level the Production
Even if everything was equal, nothing would be. Unexpected catastrophes, intrinsic faults, and a high propensity for incorrect estimation exist. Should we give up and let your company continue to lose money as a result of these factors? No! You will be reading this course handbook on leveling production as a result.
What is Production Leveling?
Production smoothing, also known as production leveling, is the process by which businesses meet consumer needs while minimizing production wastes, such as capital expenses, labor costs, and lead times for manufacturing.
The term “production leveling” is derived from the Japanese word “Heijunka” which means “leveling” and refers to a waste-reduction approach.

The goal of the process is to create goods at a constant rate so that additional processing is done at a consistent and predictable rate in an effort to meet high demand. In order to reduce production fluctuations, experts agree that this method is best applied in the final production line.
Approaches to Production Leveling
Volume Leveling
Assume you are a mobile phone manufacturer and you are given the task of delivering 500 units of your phone to a certain client each week, 200 units on Monday, 100 units on Tuesday, 50 units on Wednesday, 100 units on Thursday, and 50 units on Friday.
All you have to do is stock 100 items close to delivery every Monday in accordance with the demand leveling principle. There is always a supply of 100 pieces ready on Monday mornings as a result. The manufacturing crew then continues to consistently create 100 pieces of the items each day for the rest of the week. This lowers the cost of capital as well as other production procedures.
Product Leveling
Assuming you are manufacturing various electronics devices, managing this may seem like an impossible chore. However, this difficulty can be overcome by shortening the intervals between equipment takeovers and providing for buffering. This helps you level the lead time and stock accumulation while also lowering expenditures.
The Heijunka Box
The secret to slashing lead times in organizations is heijunka. Manufacturing companies can better satisfy customer demand when this is done correctly and items are delivered in a timely manner. It includes taking a buffer inventory as soon as it is due, working slowly and consistently, and observing takt time.

Chapter 5: Process Optimization – Lead & Cycle Time
The phrase “lead time” is taken from the Toyota Production System, which defines it as the period of time between a customer placing an order and delivering the ordered product.
In the context of software, lead time can be more broadly defined as the amount of time between the identification of a demand and its fulfillment. Determining a more precise measurement relies on the context being studied. For example, when concentrating on the software development process, the “lead time” elapsed between the creation of a user narrative and that story being used “in production,” that is, by actual users under typical circumstances, is important to consider.
Teams using the kanban method prefer this metric to the more well-known velocity. Improvement projects strive to decrease lead time rather than boost velocity.
Also Known As:
Some writers distinguish between “cycle time” and “lead time.” The time between making a request and having it fulfilled is measured from the “user’s point of view” in the first case, and the time between starting work on a user story and making the feature available for delivery is measured from the “developer’s point of view” in the second.
Given the wide variety of software endeavors, these criteria are currently in flux and may differ dramatically from one software development team to another. The best course of action is probably to carefully select one measurement method and make sure that everyone, at the very least within a specific team, is aware of how and why it is being utilized.
In the field of Kanban, the words lead time and cycle time are frequently employed and serve as crucial strategic KPIs for project management. However, project managers frequently struggle to distinguish between them and their significance. When this course manual is complete, you will:
• distinguish the metrics easily and use them properly;
• learn why the difference between lead time and cycle time matters;
• understand how to measure both metrics.
Defining Cycle Time and Lead Time
In the Lean methodology, cycle time and lead time are two crucial measures. You can have a better understanding of how work moves over time by measuring a process’ cycle and lead times. The study can show where process issues are and how to fix them to ensure that goods and services are delivered to customers on time.
What Is Lead Time?
Lead Time Definition:
The lead time is the period of time between the request for a new work item and its completion.
When a team member commits to a new work request (the request has left the backlog and is at a commitment stage in the process), it is advised to measure lead time in Kanban.
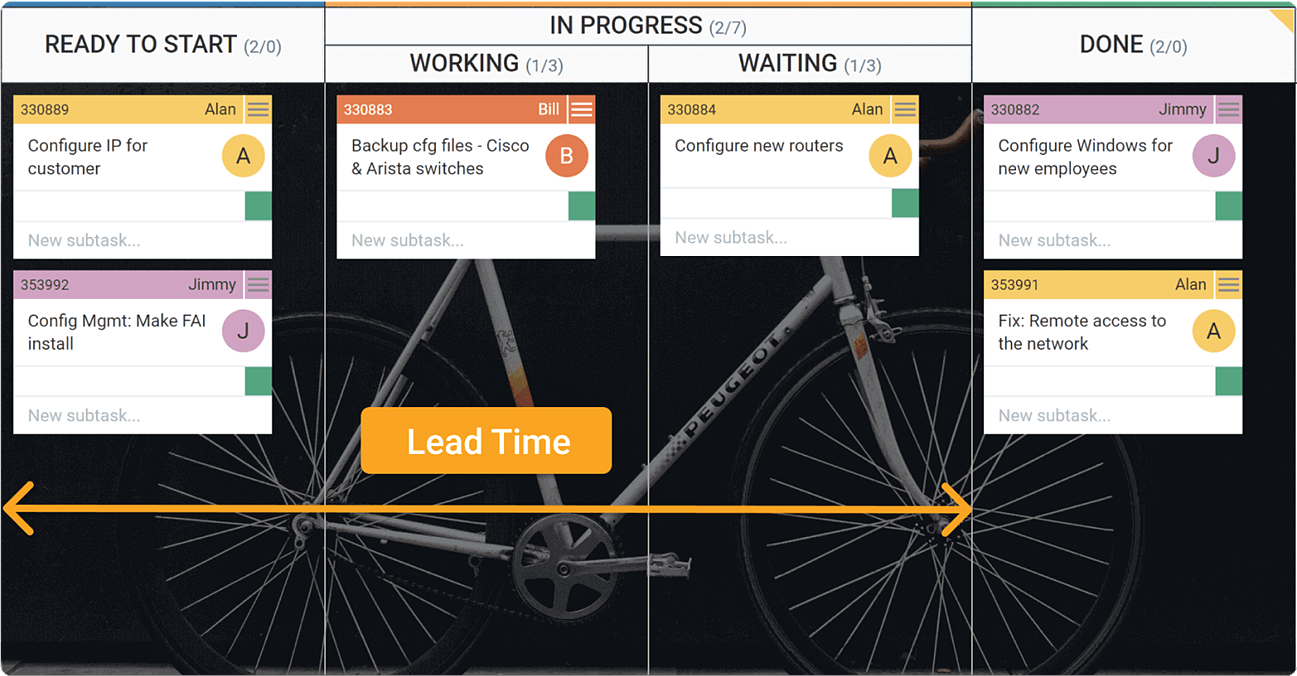
In a Kanban system, the average lead time will be considerably more precisely calculated in this way. Otherwise, you risk having hundreds of new work items sit in a waiting queue for months before anyone has the time to begin them. Lead times will consequently rise sharply.
What Is Cycle Time?
Cycle Time Definition:
Cycle Time is the amount of time a team/ person spends actually working on a work item up until it is ready for delivery.
Lead time measures the entire process since the arrival of new demand, whereas cycle time examines those portions of the process where teams are actively adding value to the task at hand. To put it another way, on a Kanban board, the work item normally flips to “in progress” whenever the cycle time meter starts to gather data.
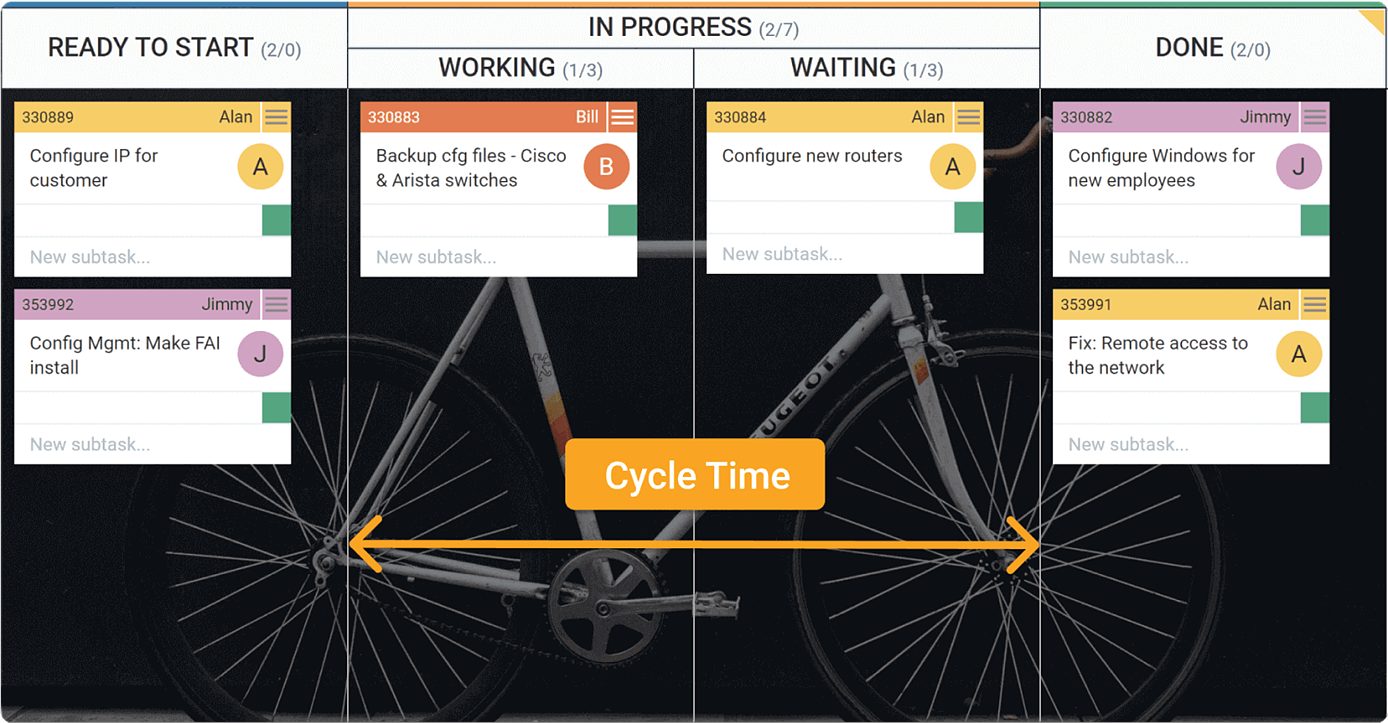
You must monitor your total WIP if you want to maintain a constant cycle time. Professor John Little, an Institute Professor at MIT, came to the conclusion that the cycle time of the system increases with the amount of work that is in progress.
The equation became famous as Little’s law, and the cycle time formula looks like this:
Cycle Time = Work in Progress / Throughput*
*In the formula above, throughput is the total number of work items that pass through the process over a certain period of time. Work in progress (WIP), on the other hand, looks at how much active work lives in the system on average.

Chapter 6: Process Optimization – Throughput
What Is Throughput?
The quantity of a product or service that a company can create and deliver to a customer within a predetermined time frame is known as throughput in the business world. The phrase is frequently used in reference to a business’s production rate or the rate at which something is processed.
Because high throughput typically suggests that a company can provide a good or service more effectively than its rivals, businesses with high throughput levels can steal market share from their lower throughput peers.
Understanding Throughput
In business management, the concept of throughput, commonly referred to as flow rate, is included in the theory of limitations. This idea is based on the axiom that any link in a chain can only be as strong as its weakest counterpart. The aim of business managers is to increase throughput for the product’s end users while minimizing the impact of the weakest connections on a company’s success. A corporation can achieve revenue maximization after throughput is maximized by eliminating inefficiencies, allowing inputs and outputs to flow in the most appropriate way.
Throughput and a company’s production capacity are closely tied, and management might make various assumptions about capacity. Management is employing theoretical capacity when it expects that production will run continuously and without any breaks, yet this level of capacity is not achievable. Because equipment needs to be maintained and repaired, as well as because workers require time off, no industrial process can ever operate at maximum output. Using practical capacity, which takes into account machine repairs, wait times, and holidays, is more realistic for enterprises.
Factors Affecting Throughput
The efficiency with which a business handles its supply chain, which is the relationship it has with its suppliers, also affects how much business it can process. Throughput is negatively impacted when materials are not accessible as a manufacturing input, regardless of the cause.
Two items may frequently begin production using the same technique, in which case the shared expenses are divided among the two products. However, the goods are created utilizing different procedures until production reaches the split-off point. It is more challenging to maintain a high throughput in this circumstance.
Benefits of Knowing Throughput Time
The term “throughput time” describes the overall amount of time needed to complete a specific process from beginning to end. For instance, a manufacturer can determine how long it takes to make a product, from the time the customer places the initial order to the time the product is manufactured and sold.
The following elements make up throughput time in further detail:
• Processing time is how long all of the steps of producing a good or service take
• Inspection time involves running quality control and monitoring finished goods
• Move time includes how long it takes to transport, ship, and deliver items across the logistics chain
• Queue time, or wait time, is computed as all idle time in between these other components.
You may calculate the overall throughput time by adding these. Company managers can address bottlenecks, slowdowns, and backlogs to increase productivity if they can spot these areas. Faster throughput times boost profitability and return on investment (ROI).

Chapter 7: Kanban Metrics Charts
Cumulative flow diagrams allow you to quickly view the full of your workflow and are helpful tools for diagnosing issues with your processes, as we explored in the previous course handbook. You may decrease your average cycle time, control your WIP limitations, and boost team throughput by using a cumulative flow diagram.
What does a cumulative flow diagram show?
In the Kanban methodology, Kanban boards are used to separate a project’s workflow into three columns: tasks that are “To Do,” “Work in Progress,” and “Done.” Every activity that has passed through your process is gathered in cumulative flow diagrams to show three crucial metrics:
• Cycle time: This is the total time it takes your team to complete each task from the beginning to the end. One of the benefits of CFDs is that you can see where you can optimize your workflow to reduce cycle times.
• Work in progress: This is the number of tasks your team is actively handling at a certain time. Cumulative flow diagrams will visualize inefficiencies in your project timeline when your team has too much or too little work in progress at any given point.
• Throughput: This is the number of tasks your team can complete over a given period. As this is the ultimate measure of your team’s productivity, cumulative flow diagrams should show where you can align your efforts and resources so that throughput increases over time.
Burndown Chart
Agile burndown charts keep track of the amount of work still to be done on a sprint or project and the amount of time the team will need to do it. Agile project managers, product managers, and other team leads frequently utilize them to maintain deadlines, spot problems as they arise, and make strategic plans for each sprint or project.
Burndown charts can be divided into two categories: sprint burndowns, which measure work for a particular sprint, and product burndowns, which track work for an entire product project.
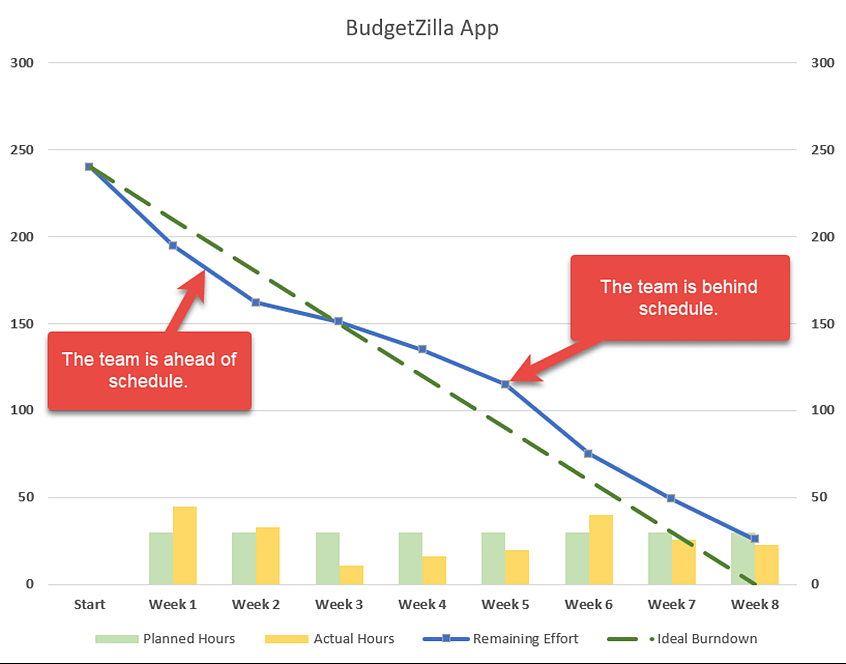
The amount of work that needs to be done is represented by the y-axis (vertical) in both forms of burndown charts, while the time permitted is shown on the x-axis. Your beginning point is in the top left corner, and the finished product is at the bottom right.
The ideal work remaining is typically shown as a straight line from beginning to end (essentially, what will happen if you work on the project steadily from beginning to end without delays or speed-ups). The real work is represented by a second line, which is generally always less linear due to activities that go surprisingly quickly or slowly, interruptions, and innovations.
These lines will be used by your project manager to compare expectations to reality and make adjustments as necessary for this sprint, the whole project, and subsequent projects. It is always preferable to compare and contrast your project end point with an actual work remaining line on a burndown chart.
Burndown vs. Burnup: What’s the Difference?
In contrast to a burndown chart, which shows how much work is still left on each project, a burnup chart shows how much work has already been completed on a project or toward a goal.
Although they often serve different purposes, both can be effective ways to visualize progress. Project managers can spot estimating problems early and determine how much work and effort is still needed by using burndown charts. Burnup charts encourage teams by displaying advancement toward a target.
In other words, burnup informs the squad that they are only a short distance from the goal. Project managers can use burndown to determine whether they have accurately timed the team’s arrival at the finish line and mapped the terrain.
Depending on the data you decide to include, you can utilize both charts in comparable ways. Ultimately, teams can opt to work with either or both charts, depending on their preferences, even if it may be the standard to utilize burndown for strategic planning and burnup for team motivation.
Flow Efficiency
Flow Efficiency in Kanban enables you to calculate the actual time you have spent on a task. Therefore, the efficiency is determined by comparing the actual work time to the overall wait time. Higher the flow efficiency %, the better and more fluid the process is able to transform an idea or request into a usable feature.
With the exception of Wait Time and Blocked Time, you can use Flow Efficiency Analytics to examine the actual production time for cards.
As an illustration, you could compare the percentage of time spent on cards that are normally in the In-Progress column type to the overall time spent on the board by such cards.
To calculate the total flow efficiency for the chosen time period, the chart will automatically collect data from each card that moved across your Kanban board during that time.
The flow efficiency (%) of your process determines how quickly tasks move through it. Teams can assess their improvement efforts by monitoring flow efficiency over time.
The flow efficiency chart illustrates the ratio of time spent working actively vs time spent waiting on work items.
The value stream is intended to be reflected on kanban boards. Value streams map both the queues between activities and the activities themselves.
How do we know if a work item is waiting? There are columns on the Kanban board, which were marked as “queue” ones, during the Board customization. When cards are waiting in these columns, they generate non-value-added time.
Some examples of “Queue” Kanban columns may be:
• Waiting for Approval – This type of Kanban queue column is appropriate for tasks that require approval to be processed (e.g. payments, promotional sales, etc.)
• Waiting for Review – This Kanban queue is a relevant stage of the workflow where work items wait to be evaluated. It is like a filter before tasks receive feedback and move forward to the completion stage or go back for improvements. It plays a crucial role in product/service’s quality (e.g. product development, content writing, design, etc.)
• Waiting for External Activity – This kind of Kanban column is applicable for tasks waiting for third-party actions in order to be completed. It happens often when a team communicates with other units outside of the company. (e.g. partnerships, affiliate programs, etc.)
Curriculum
Leading IT Transformation – Workshop 21 – Fine-Tuning Kanban
- Never Pass Defective Products
- Take Only What’s Needed
- Produce the Exact Quantity Required
- Level the Production
- Process Optimization – Lead & Cycle Time
- Process Optimization – Throughput
- Kanban Metrics Charts
Distance Learning
Introduction
Welcome to Appleton Greene and thank you for enrolling on the Leading IT Transformation corporate training program. You will be learning through our unique facilitation via distance-learning method, which will enable you to practically implement everything that you learn academically. The methods and materials used in your program have been designed and developed to ensure that you derive the maximum benefits and enjoyment possible. We hope that you find the program challenging and fun to do. However, if you have never been a distance-learner before, you may be experiencing some trepidation at the task before you. So we will get you started by giving you some basic information and guidance on how you can make the best use of the modules, how you should manage the materials and what you should be doing as you work through them. This guide is designed to point you in the right direction and help you to become an effective distance-learner. Take a few hours or so to study this guide and your guide to tutorial support for students, while making notes, before you start to study in earnest.
Study environment
You will need to locate a quiet and private place to study, preferably a room where you can easily be isolated from external disturbances or distractions. Make sure the room is well-lit and incorporates a relaxed, pleasant feel. If you can spoil yourself within your study environment, you will have much more of a chance to ensure that you are always in the right frame of mind when you do devote time to study. For example, a nice fire, the ability to play soft soothing background music, soft but effective lighting, perhaps a nice view if possible and a good size desk with a comfortable chair. Make sure that your family know when you are studying and understand your study rules. Your study environment is very important. The ideal situation, if at all possible, is to have a separate study, which can be devoted to you. If this is not possible then you will need to pay a lot more attention to developing and managing your study schedule, because it will affect other people as well as yourself. The better your study environment, the more productive you will be.
Study tools & rules
Try and make sure that your study tools are sufficient and in good working order. You will need to have access to a computer, scanner and printer, with access to the internet. You will need a very comfortable chair, which supports your lower back, and you will need a good filing system. It can be very frustrating if you are spending valuable study time trying to fix study tools that are unreliable, or unsuitable for the task. Make sure that your study tools are up to date. You will also need to consider some study rules. Some of these rules will apply to you and will be intended to help you to be more disciplined about when and how you study. This distance-learning guide will help you and after you have read it you can put some thought into what your study rules should be. You will also need to negotiate some study rules for your family, friends or anyone who lives with you. They too will need to be disciplined in order to ensure that they can support you while you study. It is important to ensure that your family and friends are an integral part of your study team. Having their support and encouragement can prove to be a crucial contribution to your successful completion of the program. Involve them in as much as you can.
Successful distance-learning
Distance-learners are freed from the necessity of attending regular classes or workshops, since they can study in their own way, at their own pace and for their own purposes. But unlike traditional internal training courses, it is the student’s responsibility, with a distance-learning program, to ensure that they manage their own study contribution. This requires strong self-discipline and self-motivation skills and there must be a clear will to succeed. Those students who are used to managing themselves, are good at managing others and who enjoy working in isolation, are more likely to be good distance-learners. It is also important to be aware of the main reasons why you are studying and of the main objectives that you are hoping to achieve as a result. You will need to remind yourself of these objectives at times when you need to motivate yourself. Never lose sight of your long-term goals and your short-term objectives. There is nobody available here to pamper you, or to look after you, or to spoon-feed you with information, so you will need to find ways to encourage and appreciate yourself while you are studying. Make sure that you chart your study progress, so that you can be sure of your achievements and re-evaluate your goals and objectives regularly.
Self-assessment
Appleton Greene training programs are in all cases post-graduate programs. Consequently, you should already have obtained a business-related degree and be an experienced learner. You should therefore already be aware of your study strengths and weaknesses. For example, which time of the day are you at your most productive? Are you a lark or an owl? What study methods do you respond to the most? Are you a consistent learner? How do you discipline yourself? How do you ensure that you enjoy yourself while studying? It is important to understand yourself as a learner and so some self-assessment early on will be necessary if you are to apply yourself correctly. Perform a SWOT analysis on yourself as a student. List your internal strengths and weaknesses as a student and your external opportunities and threats. This will help you later on when you are creating a study plan. You can then incorporate features within your study plan that can ensure that you are playing to your strengths, while compensating for your weaknesses. You can also ensure that you make the most of your opportunities, while avoiding the potential threats to your success.
Accepting responsibility as a student
Training programs invariably require a significant investment, both in terms of what they cost and in the time that you need to contribute to study and the responsibility for successful completion of training programs rests entirely with the student. This is never more apparent than when a student is learning via distance-learning. Accepting responsibility as a student is an important step towards ensuring that you can successfully complete your training program. It is easy to instantly blame other people or factors when things go wrong. But the fact of the matter is that if a failure is your failure, then you have the power to do something about it, it is entirely in your own hands. If it is always someone else’s failure, then you are powerless to do anything about it. All students study in entirely different ways, this is because we are all individuals and what is right for one student, is not necessarily right for another. In order to succeed, you will have to accept personal responsibility for finding a way to plan, implement and manage a personal study plan that works for you. If you do not succeed, you only have yourself to blame.
Planning
By far the most critical contribution to stress, is the feeling of not being in control. In the absence of planning we tend to be reactive and can stumble from pillar to post in the hope that things will turn out fine in the end. Invariably they don’t! In order to be in control, we need to have firm ideas about how and when we want to do things. We also need to consider as many possible eventualities as we can, so that we are prepared for them when they happen. Prescriptive Change, is far easier to manage and control, than Emergent Change. The same is true with distance-learning. It is much easier and much more enjoyable, if you feel that you are in control and that things are going to plan. Even when things do go wrong, you are prepared for them and can act accordingly without any unnecessary stress. It is important therefore that you do take time to plan your studies properly.
Management
Once you have developed a clear study plan, it is of equal importance to ensure that you manage the implementation of it. Most of us usually enjoy planning, but it is usually during implementation when things go wrong. Targets are not met and we do not understand why. Sometimes we do not even know if targets are being met. It is not enough for us to conclude that the study plan just failed. If it is failing, you will need to understand what you can do about it. Similarly if your study plan is succeeding, it is still important to understand why, so that you can improve upon your success. You therefore need to have guidelines for self-assessment so that you can be consistent with performance improvement throughout the program. If you manage things correctly, then your performance should constantly improve throughout the program.
Study objectives & tasks
The first place to start is developing your program objectives. These should feature your reasons for undertaking the training program in order of priority. Keep them succinct and to the point in order to avoid confusion. Do not just write the first things that come into your head because they are likely to be too similar to each other. Make a list of possible departmental headings, such as: Customer Service; E-business; Finance; Globalization; Human Resources; Technology; Legal; Management; Marketing and Production. Then brainstorm for ideas by listing as many things that you want to achieve under each heading and later re-arrange these things in order of priority. Finally, select the top item from each department heading and choose these as your program objectives. Try and restrict yourself to five because it will enable you to focus clearly. It is likely that the other things that you listed will be achieved if each of the top objectives are achieved. If this does not prove to be the case, then simply work through the process again.
Study forecast
As a guide, the Appleton Greene Leading IT Transformation corporate training program should take 12-18 months to complete, depending upon your availability and current commitments. The reason why there is such a variance in time estimates is because every student is an individual, with differing productivity levels and different commitments. These differentiations are then exaggerated by the fact that this is a distance-learning program, which incorporates the practical integration of academic theory as an as a part of the training program. Consequently all of the project studies are real, which means that important decisions and compromises need to be made. You will want to get things right and will need to be patient with your expectations in order to ensure that they are. We would always recommend that you are prudent with your own task and time forecasts, but you still need to develop them and have a clear indication of what are realistic expectations in your case. With reference to your time planning: consider the time that you can realistically dedicate towards study with the program every week; calculate how long it should take you to complete the program, using the guidelines featured here; then break the program down into logical modules and allocate a suitable proportion of time to each of them, these will be your milestones; you can create a time plan by using a spreadsheet on your computer, or a personal organizer such as MS Outlook, you could also use a financial forecasting software; break your time forecasts down into manageable chunks of time, the more specific you can be, the more productive and accurate your time management will be; finally, use formulas where possible to do your time calculations for you, because this will help later on when your forecasts need to change in line with actual performance. With reference to your task planning: refer to your list of tasks that need to be undertaken in order to achieve your program objectives; with reference to your time plan, calculate when each task should be implemented; remember that you are not estimating when your objectives will be achieved, but when you will need to focus upon implementing the corresponding tasks; you also need to ensure that each task is implemented in conjunction with the associated training modules which are relevant; then break each single task down into a list of specific to do’s, say approximately ten to do’s for each task and enter these into your study plan; once again you could use MS Outlook to incorporate both your time and task planning and this could constitute your study plan; you could also use a project management software like MS Project. You should now have a clear and realistic forecast detailing when you can expect to be able to do something about undertaking the tasks to achieve your program objectives.
Performance management
It is one thing to develop your study forecast, it is quite another to monitor your progress. Ultimately it is less important whether you achieve your original study forecast and more important that you update it so that it constantly remains realistic in line with your performance. As you begin to work through the program, you will begin to have more of an idea about your own personal performance and productivity levels as a distance-learner. Once you have completed your first study module, you should re-evaluate your study forecast for both time and tasks, so that they reflect your actual performance level achieved. In order to achieve this you must first time yourself while training by using an alarm clock. Set the alarm for hourly intervals and make a note of how far you have come within that time. You can then make a note of your actual performance on your study plan and then compare your performance against your forecast. Then consider the reasons that have contributed towards your performance level, whether they are positive or negative and make a considered adjustment to your future forecasts as a result. Given time, you should start achieving your forecasts regularly.
With reference to time management: time yourself while you are studying and make a note of the actual time taken in your study plan; consider your successes with time-efficiency and the reasons for the success in each case and take this into consideration when reviewing future time planning; consider your failures with time-efficiency and the reasons for the failures in each case and take this into consideration when reviewing future time planning; re-evaluate your study forecast in relation to time planning for the remainder of your training program to ensure that you continue to be realistic about your time expectations. You need to be consistent with your time management, otherwise you will never complete your studies. This will either be because you are not contributing enough time to your studies, or you will become less efficient with the time that you do allocate to your studies. Remember, if you are not in control of your studies, they can just become yet another cause of stress for you.
With reference to your task management: time yourself while you are studying and make a note of the actual tasks that you have undertaken in your study plan; consider your successes with task-efficiency and the reasons for the success in each case; take this into consideration when reviewing future task planning; consider your failures with task-efficiency and the reasons for the failures in each case and take this into consideration when reviewing future task planning; re-evaluate your study forecast in relation to task planning for the remainder of your training program to ensure that you continue to be realistic about your task expectations. You need to be consistent with your task management, otherwise you will never know whether you are achieving your program objectives or not.
Keeping in touch
You will have access to qualified and experienced professors and tutors who are responsible for providing tutorial support for your particular training program. So don’t be shy about letting them know how you are getting on. We keep electronic records of all tutorial support emails so that professors and tutors can review previous correspondence before considering an individual response. It also means that there is a record of all communications between you and your professors and tutors and this helps to avoid any unnecessary duplication, misunderstanding, or misinterpretation. If you have a problem relating to the program, share it with them via email. It is likely that they have come across the same problem before and are usually able to make helpful suggestions and steer you in the right direction. To learn more about when and how to use tutorial support, please refer to the Tutorial Support section of this student information guide. This will help you to ensure that you are making the most of tutorial support that is available to you and will ultimately contribute towards your success and enjoyment with your training program.
Work colleagues and family
You should certainly discuss your program study progress with your colleagues, friends and your family. Appleton Greene training programs are very practical. They require you to seek information from other people, to plan, develop and implement processes with other people and to achieve feedback from other people in relation to viability and productivity. You will therefore have plenty of opportunities to test your ideas and enlist the views of others. People tend to be sympathetic towards distance-learners, so don’t bottle it all up in yourself. Get out there and share it! It is also likely that your family and colleagues are going to benefit from your labors with the program, so they are likely to be much more interested in being involved than you might think. Be bold about delegating work to those who might benefit themselves. This is a great way to achieve understanding and commitment from people who you may later rely upon for process implementation. Share your experiences with your friends and family.
Making it relevant
The key to successful learning is to make it relevant to your own individual circumstances. At all times you should be trying to make bridges between the content of the program and your own situation. Whether you achieve this through quiet reflection or through interactive discussion with your colleagues, client partners or your family, remember that it is the most important and rewarding aspect of translating your studies into real self-improvement. You should be clear about how you want the program to benefit you. This involves setting clear study objectives in relation to the content of the course in terms of understanding, concepts, completing research or reviewing activities and relating the content of the modules to your own situation. Your objectives may understandably change as you work through the program, in which case you should enter the revised objectives on your study plan so that you have a permanent reminder of what you are trying to achieve, when and why.
Distance-learning check-list
Prepare your study environment, your study tools and rules.
Undertake detailed self-assessment in terms of your ability as a learner.
Create a format for your study plan.
Consider your study objectives and tasks.
Create a study forecast.
Assess your study performance.
Re-evaluate your study forecast.
Be consistent when managing your study plan.
Use your Appleton Greene Certified Learning Provider (CLP) for tutorial support.
Make sure you keep in touch with those around you.

Tutorial Support
Programs
Appleton Greene uses standard and bespoke corporate training programs as vessels to transfer business process improvement knowledge into the heart of our clients’ organizations. Each individual program focuses upon the implementation of a specific business process, which enables clients to easily quantify their return on investment. There are hundreds of established Appleton Greene corporate training products now available to clients within customer services, e-business, finance, globalization, human resources, information technology, legal, management, marketing and production. It does not matter whether a client’s employees are located within one office, or an unlimited number of international offices, we can still bring them together to learn and implement specific business processes collectively. Our approach to global localization enables us to provide clients with a truly international service with that all important personal touch. Appleton Greene corporate training programs can be provided virtually or locally and they are all unique in that they individually focus upon a specific business function. They are implemented over a sustainable period of time and professional support is consistently provided by qualified learning providers and specialist consultants.
Support available
You will have a designated Certified Learning Provider (CLP) and an Accredited Consultant and we encourage you to communicate with them as much as possible. In all cases tutorial support is provided online because we can then keep a record of all communications to ensure that tutorial support remains consistent. You would also be forwarding your work to the tutorial support unit for evaluation and assessment. You will receive individual feedback on all of the work that you undertake on a one-to-one basis, together with specific recommendations for anything that may need to be changed in order to achieve a pass with merit or a pass with distinction and you then have as many opportunities as you may need to re-submit project studies until they meet with the required standard. Consequently the only reason that you should really fail (CLP) is if you do not do the work. It makes no difference to us whether a student takes 12 months or 18 months to complete the program, what matters is that in all cases the same quality standard will have been achieved.
Support Process
Please forward all of your future emails to the designated (CLP) Tutorial Support Unit email address that has been provided and please do not duplicate or copy your emails to other AGC email accounts as this will just cause unnecessary administration. Please note that emails are always answered as quickly as possible but you will need to allow a period of up to 20 business days for responses to general tutorial support emails during busy periods, because emails are answered strictly within the order in which they are received. You will also need to allow a period of up to 30 business days for the evaluation and assessment of project studies. This does not include weekends or public holidays. Please therefore kindly allow for this within your time planning. All communications are managed online via email because it enables tutorial service support managers to review other communications which have been received before responding and it ensures that there is a copy of all communications retained on file for future reference. All communications will be stored within your personal (CLP) study file here at Appleton Greene throughout your designated study period. If you need any assistance or clarification at any time, please do not hesitate to contact us by forwarding an email and remember that we are here to help. If you have any questions, please list and number your questions succinctly and you can then be sure of receiving specific answers to each and every query.
Time Management
It takes approximately 1 Year to complete the Leading IT Transformation corporate training program, incorporating 12 x 6-hour monthly workshops. Each student will also need to contribute approximately 4 hours per week over 1 Year of their personal time. Students can study from home or work at their own pace and are responsible for managing their own study plan. There are no formal examinations and students are evaluated and assessed based upon their project study submissions, together with the quality of their internal analysis and supporting documents. They can contribute more time towards study when they have the time to do so and can contribute less time when they are busy. All students tend to be in full time employment while studying and the Leading IT Transformation program is purposely designed to accommodate this, so there is plenty of flexibility in terms of time management. It makes no difference to us at Appleton Greene, whether individuals take 12-18 months to complete this program. What matters is that in all cases the same standard of quality will have been achieved with the standard and bespoke programs that have been developed.
Distance Learning Guide
The distance learning guide should be your first port of call when starting your training program. It will help you when you are planning how and when to study, how to create the right environment and how to establish the right frame of mind. If you can lay the foundations properly during the planning stage, then it will contribute to your enjoyment and productivity while training later. The guide helps to change your lifestyle in order to accommodate time for study and to cultivate good study habits. It helps you to chart your progress so that you can measure your performance and achieve your goals. It explains the tools that you will need for study and how to make them work. It also explains how to translate academic theory into practical reality. Spend some time now working through your distance learning guide and make sure that you have firm foundations in place so that you can make the most of your distance learning program. There is no requirement for you to attend training workshops or classes at Appleton Greene offices. The entire program is undertaken online, program course manuals and project studies are administered via the Appleton Greene web site and via email, so you are able to study at your own pace and in the comfort of your own home or office as long as you have a computer and access to the internet.
How To Study
The how to study guide provides students with a clear understanding of the Appleton Greene facilitation via distance learning training methods and enables students to obtain a clear overview of the training program content. It enables students to understand the step-by-step training methods used by Appleton Greene and how course manuals are integrated with project studies. It explains the research and development that is required and the need to provide evidence and references to support your statements. It also enables students to understand precisely what will be required of them in order to achieve a pass with merit and a pass with distinction for individual project studies and provides useful guidance on how to be innovative and creative when developing your Unique Program Proposition (UPP).
Tutorial Support
Tutorial support for the Appleton Greene Leading IT Transformation corporate training program is provided online either through the Appleton Greene Client Support Portal (CSP), or via email. All tutorial support requests are facilitated by a designated Program Administration Manager (PAM). They are responsible for deciding which professor or tutor is the most appropriate option relating to the support required and then the tutorial support request is forwarded onto them. Once the professor or tutor has completed the tutorial support request and answered any questions that have been asked, this communication is then returned to the student via email by the designated Program Administration Manager (PAM). This enables all tutorial support, between students, professors and tutors, to be facilitated by the designated Program Administration Manager (PAM) efficiently and securely through the email account. You will therefore need to allow a period of up to 20 business days for responses to general support queries and up to 30 business days for the evaluation and assessment of project studies, because all tutorial support requests are answered strictly within the order in which they are received. This does not include weekends or public holidays. Consequently you need to put some thought into the management of your tutorial support procedure in order to ensure that your study plan is feasible and to obtain the maximum possible benefit from tutorial support during your period of study. Please retain copies of your tutorial support emails for future reference. Please ensure that ALL of your tutorial support emails are set out using the format as suggested within your guide to tutorial support. Your tutorial support emails need to be referenced clearly to the specific part of the course manual or project study which you are working on at any given time. You also need to list and number any questions that you would like to ask, up to a maximum of five questions within each tutorial support email. Remember the more specific you can be with your questions the more specific your answers will be too and this will help you to avoid any unnecessary misunderstanding, misinterpretation, or duplication. The guide to tutorial support is intended to help you to understand how and when to use support in order to ensure that you get the most out of your training program. Appleton Greene training programs are designed to enable you to do things for yourself. They provide you with a structure or a framework and we use tutorial support to facilitate students while they practically implement what they learn. In other words, we are enabling students to do things for themselves. The benefits of distance learning via facilitation are considerable and are much more sustainable in the long-term than traditional short-term knowledge sharing programs. Consequently you should learn how and when to use tutorial support so that you can maximize the benefits from your learning experience with Appleton Greene. This guide describes the purpose of each training function and how to use them and how to use tutorial support in relation to each aspect of the training program. It also provides useful tips and guidance with regard to best practice.
Tutorial Support Tips
Students are often unsure about how and when to use tutorial support with Appleton Greene. This Tip List will help you to understand more about how to achieve the most from using tutorial support. Refer to it regularly to ensure that you are continuing to use the service properly. Tutorial support is critical to the success of your training experience, but it is important to understand when and how to use it in order to maximize the benefit that you receive. It is no coincidence that those students who succeed are those that learn how to be positive, proactive and productive when using tutorial support.
Be positive and friendly with your tutorial support emails
Remember that if you forward an email to the tutorial support unit, you are dealing with real people. “Do unto others as you would expect others to do unto you”. If you are positive, complimentary and generally friendly in your emails, you will generate a similar response in return. This will be more enjoyable, productive and rewarding for you in the long-term.
Think about the impression that you want to create
Every time that you communicate, you create an impression, which can be either positive or negative, so put some thought into the impression that you want to create. Remember that copies of all tutorial support emails are stored electronically and tutors will always refer to prior correspondence before responding to any current emails. Over a period of time, a general opinion will be arrived at in relation to your character, attitude and ability. Try to manage your own frustrations, mood swings and temperament professionally, without involving the tutorial support team. Demonstrating frustration or a lack of patience is a weakness and will be interpreted as such. The good thing about communicating in writing, is that you will have the time to consider your content carefully, you can review it and proof-read it before sending your email to Appleton Greene and this should help you to communicate more professionally, consistently and to avoid any unnecessary knee-jerk reactions to individual situations as and when they may arise. Please also remember that the CLP Tutorial Support Unit will not just be responsible for evaluating and assessing the quality of your work, they will also be responsible for providing recommendations to other learning providers and to client contacts within the Appleton Greene global client network, so do be in control of your own emotions and try to create a good impression.
Remember that quality is preferred to quantity
Please remember that when you send an email to the tutorial support team, you are not using Twitter or Text Messaging. Try not to forward an email every time that you have a thought. This will not prove to be productive either for you or for the tutorial support team. Take time to prepare your communications properly, as if you were writing a professional letter to a business colleague and make a list of queries that you are likely to have and then incorporate them within one email, say once every month, so that the tutorial support team can understand more about context, application and your methodology for study. Get yourself into a consistent routine with your tutorial support requests and use the tutorial support template provided with ALL of your emails. The (CLP) Tutorial Support Unit will not spoon-feed you with information. They need to be able to evaluate and assess your tutorial support requests carefully and professionally.
Be specific about your questions in order to receive specific answers
Try not to write essays by thinking as you are writing tutorial support emails. The tutorial support unit can be unclear about what in fact you are asking, or what you are looking to achieve. Be specific about asking questions that you want answers to. Number your questions. You will then receive specific answers to each and every question. This is the main purpose of tutorial support via email.
Keep a record of your tutorial support emails
It is important that you keep a record of all tutorial support emails that are forwarded to you. You can then refer to them when necessary and it avoids any unnecessary duplication, misunderstanding, or misinterpretation.
Individual training workshops or telephone support
Please be advised that Appleton Greene does not provide separate or individual tutorial support meetings, workshops, or provide telephone support for individual students. Appleton Greene is an equal opportunities learning and service provider and we are therefore understandably bound to treat all students equally. We cannot therefore broker special financial or study arrangements with individual students regardless of the circumstances. All tutorial support is provided online and this enables Appleton Greene to keep a record of all communications between students, professors and tutors on file for future reference, in accordance with our quality management procedure and your terms and conditions of enrolment. All tutorial support is provided online via email because it enables us to have time to consider support content carefully, it ensures that you receive a considered and detailed response to your queries. You can number questions that you would like to ask, which relate to things that you do not understand or where clarification may be required. You can then be sure of receiving specific answers to each individual query. You will also then have a record of these communications and of all tutorial support, which has been provided to you. This makes tutorial support administration more productive by avoiding any unnecessary duplication, misunderstanding, or misinterpretation.
Tutorial Support Email Format
You should use this tutorial support format if you need to request clarification or assistance while studying with your training program. Please note that ALL of your tutorial support request emails should use the same format. You should therefore set up a standard email template, which you can then use as and when you need to. Emails that are forwarded to Appleton Greene, which do not use the following format, may be rejected and returned to you by the (CLP) Program Administration Manager. A detailed response will then be forwarded to you via email usually within 20 business days of receipt for general support queries and 30 business days for the evaluation and assessment of project studies. This does not include weekends or public holidays. Your tutorial support request, together with the corresponding TSU reply, will then be saved and stored within your electronic TSU file at Appleton Greene for future reference.
Subject line of your email
Please insert: Appleton Greene (CLP) Tutorial Support Request: (Your Full Name) (Date), within the subject line of your email.
Main body of your email
Please insert:
1. Appleton Greene Certified Learning Provider (CLP) Tutorial Support Request
2. Your Full Name
3. Date of TS request
4. Preferred email address
5. Backup email address
6. Course manual page name or number (reference)
7. Project study page name or number (reference)
Subject of enquiry
Please insert a maximum of 50 words (please be succinct)
Briefly outline the subject matter of your inquiry, or what your questions relate to.
Question 1
Maximum of 50 words (please be succinct)
Maximum of 50 words (please be succinct)
Question 3
Maximum of 50 words (please be succinct)
Question 4
Maximum of 50 words (please be succinct)
Question 5
Maximum of 50 words (please be succinct)
Please note that a maximum of 5 questions is permitted with each individual tutorial support request email.
Procedure
* List the questions that you want to ask first, then re-arrange them in order of priority. Make sure that you reference them, where necessary, to the course manuals or project studies.
* Make sure that you are specific about your questions and number them. Try to plan the content within your emails to make sure that it is relevant.
* Make sure that your tutorial support emails are set out correctly, using the Tutorial Support Email Format provided here.
* Save a copy of your email and incorporate the date sent after the subject title. Keep your tutorial support emails within the same file and in date order for easy reference.
* Allow up to 20 business days for a response to general tutorial support emails and up to 30 business days for the evaluation and assessment of project studies, because detailed individual responses will be made in all cases and tutorial support emails are answered strictly within the order in which they are received.
* Emails can and do get lost. So if you have not received a reply within the appropriate time, forward another copy or a reminder to the tutorial support unit to be sure that it has been received but do not forward reminders unless the appropriate time has elapsed.
* When you receive a reply, save it immediately featuring the date of receipt after the subject heading for easy reference. In most cases the tutorial support unit replies to your questions individually, so you will have a record of the questions that you asked as well as the answers offered. With project studies however, separate emails are usually forwarded by the tutorial support unit, so do keep a record of your own original emails as well.
* Remember to be positive and friendly in your emails. You are dealing with real people who will respond to the same things that you respond to.
* Try not to repeat questions that have already been asked in previous emails. If this happens the tutorial support unit will probably just refer you to the appropriate answers that have already been provided within previous emails.
* If you lose your tutorial support email records you can write to Appleton Greene to receive a copy of your tutorial support file, but a separate administration charge may be levied for this service.

How To Study
Your Certified Learning Provider (CLP) and Accredited Consultant can help you to plan a task list for getting started so that you can be clear about your direction and your priorities in relation to your training program. It is also a good way to introduce yourself to the tutorial support team.
Planning your study environment
Your study conditions are of great importance and will have a direct effect on how much you enjoy your training program. Consider how much space you will have, whether it is comfortable and private and whether you are likely to be disturbed. The study tools and facilities at your disposal are also important to the success of your distance-learning experience. Your tutorial support unit can help with useful tips and guidance, regardless of your starting position. It is important to get this right before you start working on your training program.
Planning your program objectives
It is important that you have a clear list of study objectives, in order of priority, before you start working on your training program. Your tutorial support unit can offer assistance here to ensure that your study objectives have been afforded due consideration and priority.
Planning how and when to study
Distance-learners are freed from the necessity of attending regular classes, since they can study in their own way, at their own pace and for their own purposes. This approach is designed to let you study efficiently away from the traditional classroom environment. It is important however, that you plan how and when to study, so that you are making the most of your natural attributes, strengths and opportunities. Your tutorial support unit can offer assistance and useful tips to ensure that you are playing to your strengths.
Planning your study tasks
You should have a clear understanding of the study tasks that you should be undertaking and the priority associated with each task. These tasks should also be integrated with your program objectives. The distance learning guide and the guide to tutorial support for students should help you here, but if you need any clarification or assistance, please contact your tutorial support unit.
Planning your time
You will need to allocate specific times during your calendar when you intend to study if you are to have a realistic chance of completing your program on time. You are responsible for planning and managing your own study time, so it is important that you are successful with this. Your tutorial support unit can help you with this if your time plan is not working.
Keeping in touch
Consistency is the key here. If you communicate too frequently in short bursts, or too infrequently with no pattern, then your management ability with your studies will be questioned, both by you and by your tutorial support unit. It is obvious when a student is in control and when one is not and this will depend how able you are at sticking with your study plan. Inconsistency invariably leads to in-completion.
Charting your progress
Your tutorial support team can help you to chart your own study progress. Refer to your distance learning guide for further details.
Making it work
To succeed, all that you will need to do is apply yourself to undertaking your training program and interpreting it correctly. Success or failure lies in your hands and your hands alone, so be sure that you have a strategy for making it work. Your Certified Learning Provider (CLP) and Accredited Consultant can guide you through the process of program planning, development and implementation.
Reading methods
Interpretation is often unique to the individual but it can be improved and even quantified by implementing consistent interpretation methods. Interpretation can be affected by outside interference such as family members, TV, or the Internet, or simply by other thoughts which are demanding priority in our minds. One thing that can improve our productivity is using recognized reading methods. This helps us to focus and to be more structured when reading information for reasons of importance, rather than relaxation.
Speed reading
When reading through course manuals for the first time, subconsciously set your reading speed to be just fast enough that you cannot dwell on individual words or tables. With practice, you should be able to read an A4 sheet of paper in one minute. You will not achieve much in the way of a detailed understanding, but your brain will retain a useful overview. This overview will be important later on and will enable you to keep individual issues in perspective with a more generic picture because speed reading appeals to the memory part of the brain. Do not worry about what you do or do not remember at this stage.
Content reading
Once you have speed read everything, you can then start work in earnest. You now need to read a particular section of your course manual thoroughly, by making detailed notes while you read. This process is called Content Reading and it will help to consolidate your understanding and interpretation of the information that has been provided.
Making structured notes on the course manuals
When you are content reading, you should be making detailed notes, which are both structured and informative. Make these notes in a MS Word document on your computer, because you can then amend and update these as and when you deem it to be necessary. List your notes under three headings: 1. Interpretation – 2. Questions – 3. Tasks. The purpose of the 1st section is to clarify your interpretation by writing it down. The purpose of the 2nd section is to list any questions that the issue raises for you. The purpose of the 3rd section is to list any tasks that you should undertake as a result. Anyone who has graduated with a business-related degree should already be familiar with this process.
Organizing structured notes separately
You should then transfer your notes to a separate study notebook, preferably one that enables easy referencing, such as a MS Word Document, a MS Excel Spreadsheet, a MS Access Database, or a personal organizer on your cell phone. Transferring your notes allows you to have the opportunity of cross-checking and verifying them, which assists considerably with understanding and interpretation. You will also find that the better you are at doing this, the more chance you will have of ensuring that you achieve your study objectives.
Question your understanding
Do challenge your understanding. Explain things to yourself in your own words by writing things down.
Clarifying your understanding
If you are at all unsure, forward an email to your tutorial support unit and they will help to clarify your understanding.
Question your interpretation
Do challenge your interpretation. Qualify your interpretation by writing it down.
Clarifying your interpretation
If you are at all unsure, forward an email to your tutorial support unit and they will help to clarify your interpretation.
Qualification Requirements
The student will need to successfully complete the project study and all of the exercises relating to the Leading IT Transformation corporate training program, achieving a pass with merit or distinction in each case, in order to qualify as an Accredited Leading IT Transformation Specialist (ALITTS). All monthly workshops need to be tried and tested within your company. These project studies can be completed in your own time and at your own pace and in the comfort of your own home or office. There are no formal examinations, assessment is based upon the successful completion of the project studies. They are called project studies because, unlike case studies, these projects are not theoretical, they incorporate real program processes that need to be properly researched and developed. The project studies assist us in measuring your understanding and interpretation of the training program and enable us to assess qualification merits. All of the project studies are based entirely upon the content within the training program and they enable you to integrate what you have learnt into your corporate training practice.
Leading IT Transformation – Grading Contribution
Project Study – Grading Contribution
Customer Service – 10%
E-business – 05%
Finance – 10%
Globalization – 10%
Human Resources – 10%
Information Technology – 10%
Legal – 05%
Management – 10%
Marketing – 10%
Production – 10%
Education – 05%
Logistics – 05%
TOTAL GRADING – 100%
Qualification grades
A mark of 90% = Pass with Distinction.
A mark of 75% = Pass with Merit.
A mark of less than 75% = Fail.
If you fail to achieve a mark of 75% with a project study, you will receive detailed feedback from the Certified Learning Provider (CLP) and/or Accredited Consultant, together with a list of tasks which you will need to complete, in order to ensure that your project study meets with the minimum quality standard that is required by Appleton Greene. You can then re-submit your project study for further evaluation and assessment. Indeed you can re-submit as many drafts of your project studies as you need to, until such a time as they eventually meet with the required standard by Appleton Greene, so you need not worry about this, it is all part of the learning process.
When marking project studies, Appleton Greene is looking for sufficient evidence of the following:
Pass with merit
A satisfactory level of program understanding
A satisfactory level of program interpretation
A satisfactory level of project study content presentation
A satisfactory level of Unique Program Proposition (UPP) quality
A satisfactory level of the practical integration of academic theory
Pass with distinction
An exceptional level of program understanding
An exceptional level of program interpretation
An exceptional level of project study content presentation
An exceptional level of Unique Program Proposition (UPP) quality
An exceptional level of the practical integration of academic theory
Preliminary Analysis
Online Article
“Improve your Work Process — What’s your Cycle Time?
By Ashley-Christian Hardy,
May 23, 2016,
Medium.com
Improve your work Process
What is your Cycle Time?
I have seen many different ways that people manage their work flow process.
By this I mean how you get something from idea to delivered in production, and the steps in between. How do you track these steps and how does everyone keep in line, but I think the most important question is how many steps are there?
There are two very extreme ends to this spectrum, teams that do the bare minimum (Kanban end of the spectrum), where they might have a ‘to do’, ‘in progress’ and ‘complete’ stages. The other end of the spectrum, the more waterfall or legacy approach is to have many little documented, process driven steps. With the later I find that these are usually enterprise companies that have scaled badly or have a lot of development teams they struggle to keep inline.
Let me start by defining two concepts in Kanban; lead time and cycle time.
Lead Time
This is the time it takes your feature to get into production from the initial idea being added to a backlog to being ready for deployment. Its important to note that when a user story or new development is ready to be deployed — the go ahead should always be a business decision.
The Lean & Kanban blog defines it as:
“Lead time clock starts when the request is made and ends at delivery. Cycle time clock starts when work begins on the request and ends when the item is ready for delivery. Cycle time is a more mechanical measure of process capability. Lead time is what the customer sees.”
I think this is a very important measure; think about it. If you are a Product Manager, Product Owner or some kind of stakeholder, when you make a request how long is it before you see it in production being used?
NOTE: The scale for new features and bugs is probably going to be different, depending on your process. A new feature may involve, design, UX, architecture meetings, prototyping; where as a bug is usually find the issue, solve the issue, so there is probably going to be a gap in lead time so I would keep these separate.
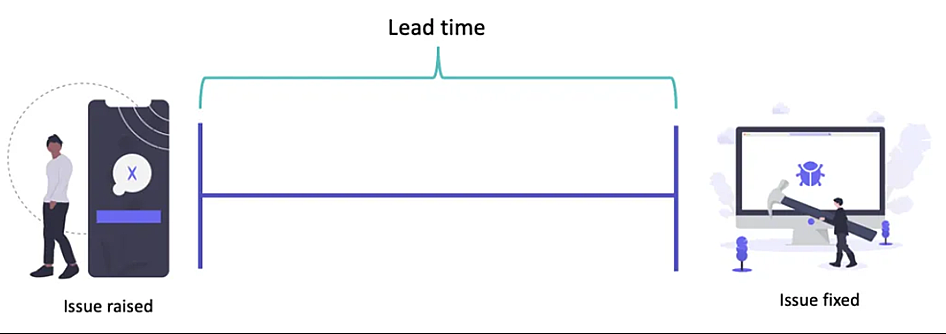
If you think of it in software development terms; and lets take a bug for example. When a bug is identified, you would probably create a bug item (in JIRA, TFS, Ralley or whatever tracking software you use) to be prioritised, if its a production issue its probably high or critical. The lead time will start when the bug is created (the request) and will end when the bug fix validated and ready to be deployed. Remember that the time should end when the bug is ready to be deployed, and not when it is actually deployed. The reason for this is that you will have delivered the fix or new feature, but as I mentioned the decision to deploy should be that of the business or the requester. There may be circumstances that mean that the fix should not go live at that time; for example if the fix is for an on-line sports betting company, its probably not the best idea to release during the World Cup final, or if the fix is for a trading platform, releasing the fix during trading hours may give someone an unfair advantage.
So this is the key; lead time is duration and not effort/capacity, and can actually be a good way to identify bottle necks or get the true efficiency of your team. You might only have to work 30 minutes to fix the bug, but you may have a lead time of 10 days due to all the other things that might happen along the way (internal communication, reporting, QA validation, merging, code review, automated testing, deployment process, sign off process….).
The lead time in organizations can often be referred to as your SLA (Service Level Agreement) or Resolution Time when dealing with issues. This ensures that your lead time is not indefinite and have to be resolved within a certain amount of time.
Cycle Time
If you are a development team manager, scrum master, IT project manager; then this figure might be more interesting to you. The cycle time for example; is the time from when you start working on the bug to when the bug fix ready to be deployed. Again this is based on time frame (and obviously cannot be shorter than the lead time).
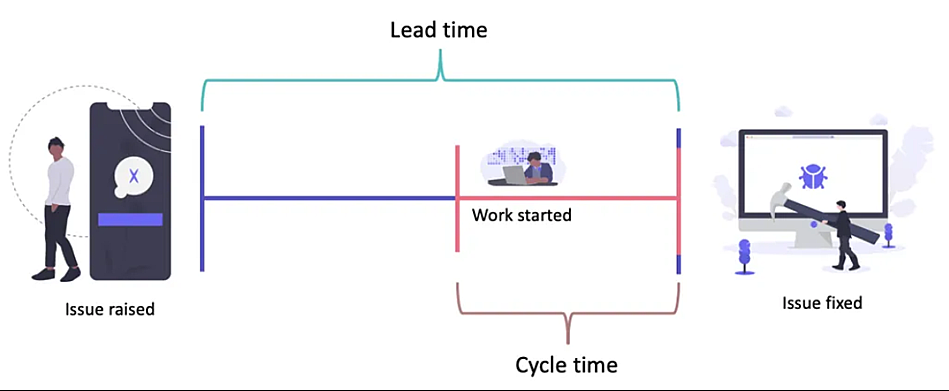
From a business point of view, the lead time is obviously the most important. How long does it take from when you have a great money making idea to when this idea actually starts making money. Its the Cycle Time a development team can use to improve their delivery, but often there maybe a time to wait before the issue actually hits the development team — so time here could also be reduced.
Process Steps
So as I was saying, how many steps does it take for you to get your features into production. For now I am just going to focus on the cycle time. The lead time is a whole other beast I will tackle in another post. It is important to mention though, any process improvement should happen end-to-end, fixing one small part of it might not have the desired effect you want.”
If you would like to continue reading this article, please visit: www.achardypm.medium.com

Online Article
“A case study: how Microsoft could not manage properly a team until they have adopted Kanban.
By Eugen Frunza,
Senior Consultant,
LinkedIn
David Anderson
David Anderson is one of the first coaches that have taught Kanban to IT professionals. He has implemented Agile methods at large companies such as Sprint, Motorola, and Microsoft.
David is the author of several books as:
• Kanban – Successful Evolutionary Change for your Technology Business,
• Lessons in Agile Management: On the Road to Kanban,
• Kanban Maturity Model and Fit for Purpose: How Modern Businesses Find, Satisfy, and Keep Customers.
His Kanban “Blue Book” is seen by the Kanban’s trainers as a “must-have” book for all professionals getting familiarized with the Kanban methodology.
The Microsoft XIT Sustaining Engineering Story
The story presented by David Anderson describes the situation of the XIT business unit team at Microsoft from 2003 – “a team that was known for having the worst customer satisfaction record across all of Microsoft’s IT organization.” This is as well the story of Dragos Dumitriu, a Romanian-immigrant P.M. that soon after joining Microsoft decided to take the challenge of leading the team.
Dragos and his team (“Sustaining Engineering” team) were responsible for the software maintenance for the XIT business unit. The team consists of 3 developers, 3 testers, and a local functional manager located in Hyderabad, India. A few years earlier, Microsoft had made a strategic decision to outsource its IT function to provide services that were not seen essential to their business.
The team has to perform the following work:
1. minor upgrades known as change requests.
2. defect fixes for about 80 IT applications used at Microsoft.
The work was coming from 4 different product managers at Microsoft that led other departments.
The team performance was very low: an average of five-month lead time existed on change requests and it was likely that for anyone item the lead time from commitment to delivery was between 6 weeks to greater than 1 year. This was the reason why the program manager position had been vacant for several months.
When each request for a change or defect fix arrived from a product manager, Dragos would send it to India for an estimate. The policy was that estimates had to be made and returned to the business owners within 48 hours. Once a month, Dragos would meet with the product managers, and they would reprioritize the backlog and create a project plan from the requests.
The service level agreement – to return the estimates within 48 hours- was viewed as having a higher priority than the planned work. In many instances, estimates were given to potential work that later on will be discarded.
Team performance in numbers
The requests for estimates ranged between 18 to 25 a month and each of them took the developers a whole day of work. The planned and committed work ranged between 9 to 13 items per month with an average implementation time of 5 days.
6 planned work items were delivered within a month.
The delivery capability was calculated to an average of 5.5 months at a growing rate of 0.5 months per month while the items delivered against committed dates was 0%.
While only 6 items were delivered each month and the committed backlog consists of at least 80 items, the entire backlog had to be reprioritized and re-planned each month with a single request being re-planned 4 to 5 times.
The department could not deliver and keep its promises and this was a major cause for customer dissatisfaction.
Implemented solution
Dragos proposed two management changes:
1. No estimates
2. Limit the work in progress and pull work from the input buffer as work was getting completed.
He chose to limit WIP (work in progress) in development to one request per developer and to use a similar rule for testers.
He inserted a small buffer between development and test in order to smooth the flow of work and set it arbitrarily to 5 (with the intention to adjust it later on in the process.)
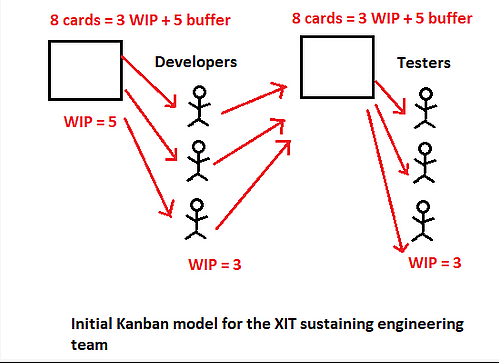
In exchange for accepting these changes to the process, Dragos has committed to delivering within a 25-day service level agreement.
On top of these changes, Dragos convinced the managers to use an average cost when calculating the ROI for each estimate, average cost calculated based on historical data.
Results
• The delivery rate of change requests increased by 230%.
• The lead times fell from an average of 5.5 months to a mere 12 days.
• On-time performance rose to 98%.
• Dragos was rewarded with the division’s process improvement award for the 2nd half of 2005.
Further improvements
Dragos flew to Hyderabad and spent 2 weeks observing the process. He suspected that the testers had a lot of capacity available for work. Based on his observation, he reduced the test team from 3 to 2 members and hired one more developer. The result was a linear increase in productivity from 45 to 56 requests completed.
During the fiscal year ending of 2005, the General Manager noticed the productivity improvement of the XIT sustaining engineering team and gave Dragos permission to hire more people.
Dragos hired one more developer and one more tester, to balance the work between the 2 departments.
A final note of the story
• The backlog was eliminated entirely on November 22, 2005.
• The lead time was reduced to an average of 14 days against an 11-day engineering time.
• The on-time performance on the 25-day delivery time target was 98 percent.
• The requests throughput increase more than three times, while lead times had dropped by more than 90 percent.”
If you would like to continue reading this article, please visit: www.linkedin.com

Online Article
“Kanban Metrics that Work
By Anna Majowska,
April 3, 2019,
Medium.com
Kanban, Scrum, Scrumban — however you’re managing your team’s workflow, you’re going to want to know how well the method works, or how far off the goal it still is. For that, you should be looking at the process metrics.
Some of the most common metrics measure: throughput — work completed over time, speed of response to a request, tasks started vs completed count and team satisfaction — both measuring process sustainability, or cycle time efficiency — working time alone in relation to waiting & working time.
The most accurate way to achieve a metric relevant to your process would be you designing it yourself, around the desired outcome. So you’d look at what kind of information tells you whether the process works or not, and then proceed to gather that data for future analysis.
For example, if to you, the measure of an efficient process is the ratio between number of tasks done in a week and their difficulty — you’re going to need data on number of tasks done each week, and of each their difficulty points — it’s as easy as that.
Imagine the potential such an approach has — but while you do, also keep in mind the amount of work running custom metrics on a regular basis will consume. Not a problem if your team includes someone, whose main job it will become. A bit of an issue though, if it’s just you and a few workers — in that case, developing own productivity metrics might be the last thing you’ll have time for.
For smaller teams like that, it may make a lot more sense to use auto-generated metrics, like the ones offered by Kanban Tool. It will run the following analytics for you, without any input needed –
• Lead & Cycle Time, showing the length of time that tasks took to get from point A to B,
• a Time Report, listing exact hours that items were being actively worked on and by whom,
• a Cumulative Flow chart, visualising done work, accumulated over time,
• and a Changelog — a searchable list of all changes made.
No matter what you do to learn about your process efficiency, there are a few things to keep in mind: don’t focus on just one, very specific metric, as that can lead to tunnel vision and misrepresent the overall process health. Also, don’t obsess about measuring the flow in general, the rule of thumb here could be: if you suspect something is going wrong, get measuring. If things seem to be OK, sticking to scheduled routine checks will be just enough to let you know of any flaws and improvement opportunities.”
If you would like to view the original article, please visit: www.a-majowska.medium.com
Course Manuals 1-7
How businesses can manage product defects
Being forced to pull one of their product lines from the market due to safety concerns or flaws is one of the largest hazards that a product-based corporation may experience.
Numerous products are governed by a variety of laws, which vary depending on the country or jurisdiction and the type of product. No legally questionable product should be expected to remain on the market if a material flaw is discovered because the laws are strictly enforced. The typical solution to this is a product recall.
For instance, it could be a car or electrical device with a safety flaw. Alternatively, food could be tainted, contain banned ingredients, or have been altered. Similar to how medicines and narcotics can be recalled due to users’ severe reactions, toys are taken off the market if there is a risk of choking or injury.
The risk of product defects to your business
Recalls always pose a serious threat to your brand. The same holds true for other supply chain companies. This is due to the fact that an incomplete or delayed recall means your dangerous items are still in use, someone could get hurt, and you could be held accountable. This could provide stories for the media, your rivals, and make your company the topic of unfavorable case studies for years to come.
Recalls of products by businesses are uncommon, thus mistakes might be made when they do. Recalls also cost money, stop production, use up resources, and take up management time. Additionally, they frequently call for specialized assistance and cautious messaging to maintain credibility and reputation.
Failure is not an option, though. You risk being penalized or having your trade license suspended if you make a recall error. You might also be the subject of an inquiry, expense, and media attention. Customers start using alternatives and your brand gets diluted.
Fortunately, there are steps you can take to make a product recall go as smoothly as possible—or, ideally, to avoid the need for one altogether.
Steps to minimize the impact of a product defect
Although it’s ideal to avoid having a product defect in the first place, the following actions could help you safeguard your company in the event that one does occur:
● Make a plan for product recalls.
● Recognize the rules and legislation that apply to your items and how defects are handled.
● Develop a quality management system that follows best practises, including establishing fault tolerances, identifying nonconformances, and taking corrective action.
● periodically check the quality control procedures of suppliers
● To establish standards for quality, establish a gold standard.
● Utilize a third party for routine inspections and acquire ISO 9001 accreditation.
● Establish a trustworthy system for tracking products and processes.
● Aim for smooth change management and systematic preventive maintenance.
● View customer complaints and return management as a whole.
● If a defect is found, clearly define the escalation criteria and procedures.
● Conduct recall drills and training for suppliers and workers.
● Keep track of all the electronic information needed to carry out a 100% recall.
Getting a product recall right
Time will be of the importance if a product needs to be recalled. Customers and end users are likely to view a quick, efficient recall favorably, reducing their risk as well as yours and preventing any ensuing reputational harm. Though they will always be unique to your company, the stages and activities you might want to include in your recall plan could include the following:
● Initial product defect discovery via customer complaints and/or Quality Control
● Determining the validity to determine whether the flaw is significant and the size and breadth of any prospective recall
● Rapid, high-certainty contact and briefing to senior management in order to escalate the issue
● Evaluation, root-cause analysis, and risk assessment for traceability
● Choosing whether to issue a recall, cancel a sale, or take no action and manage the situation
● Put a stop to production, quarantine impacted inventory, and cancel deliveries
● Stop all shipments and inform the supplier of the impacted batches and product numbers.
● Determine who is affected, let them know, and let them know how to return anything.
● According to the law and business standards, notify the appropriate authorities, regulators, and insurance.
You can ensure you minimize the risks and effects of a product recall on your organization by putting the proper plan in place.

The largest product recalls in history: the recall of the Samsung Galaxy Note 7
● 2016 Price: $5.3 billion
● High expectations were held by Samsung for the premium Samsung Galaxy Note 7 smartphone, however they were dashed.
The expensive device had to be discontinued and recalled by the biggest smartphone manufacturer in the world because some of them started catching fire. Within the first two months of its August 2016 launch, the U.S. Consumer Products Safety Commission received 96 reports of overheating batteries and fires. Some of the most expensive smartphones on the market, Samsung was compelled to recall 2.5 million of the units.
Samsung suffered a multi billion dollar loss as a result of the recall, but the well-diversified electronics giant was more than able to bounce back. The Samsung Galaxy Note 8 was revealed by the handset manufacturer the following year to rave reviews and successful sales.

The Impact of Poor Software Quality in Business
Your business could succeed or fail depending on the software you choose. When undergoing an IT transformation, software development should be in charge of all operations, so quality is something you should take very seriously.
The key to predictability (or avoiding rework), productivity, and favorable branding and customer interactions is good software. It goes without saying that being able to maximize your business’s software quality has a cascading effect that leads to a prosperous software industry in the end.
In contrast, poor software can lead to a company’s demise. The growth of a corporation is hampered by poor software development or design, which can include problems like slowness and crashes as well as functionality and improper application. Employee productivity is adversely affected, and the company’s reputation in the marketplace is tarnished.
It always pays to make improvements on your end, just like it does in any industry or endeavor. You should be able to understand why software quality is so important to your organization after viewing this infographic.

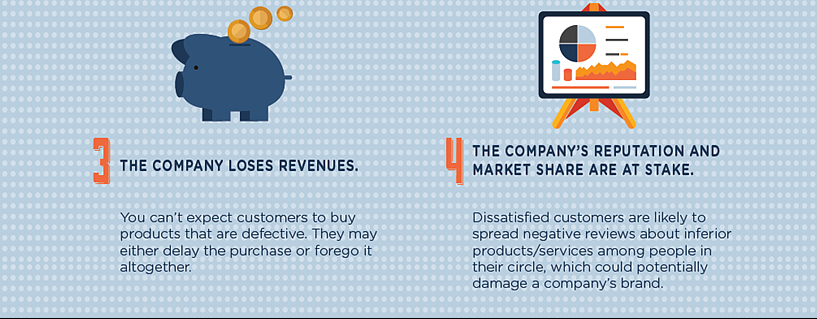
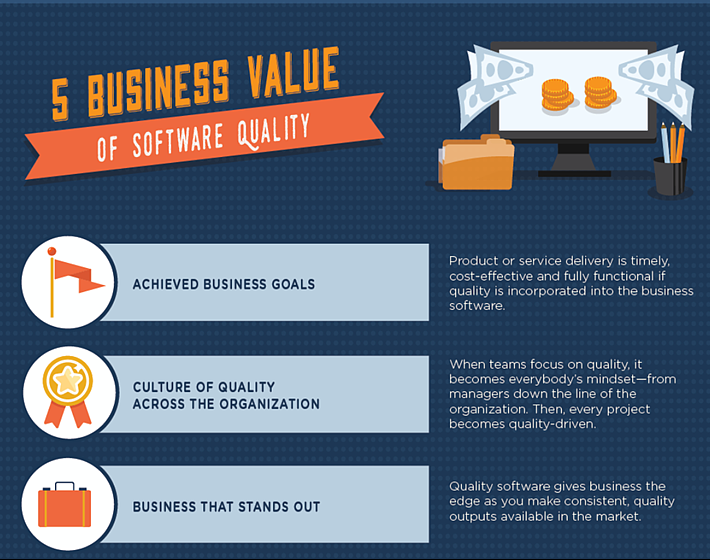
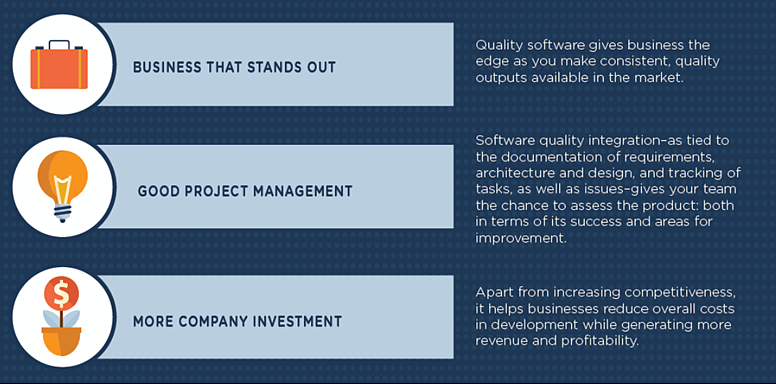
Source: www.apexgloballearning.com
Due to their excessive eagerness to deploy their products and start making money right away, many organizations have a tendency to sacrifice software quality. They occasionally fail to realize that the price of subpar software is higher than the price of quality.
Companies who invest in high-quality software stand to benefit financially and commercially, both for their individual products and the company as a whole.
The Risks of Releasing Software With Known Defects
You could think that a corporation could develop and distribute new software that would function flawlessly in the present world given the technologies and experience that software companies have at their disposal. However, this hardly ever happens. Software that is released with a bug later discovered in the system is one thing; knowing there is a bug but continuing with a live launch is quite another. But a lot of software companies are like this.
Consider Microsoft as an example. There are numerous rumors claiming that every piece of software produced by Microsoft comes with a list of known flaws. Microsoft could have postponed the product rollout, rectified the issues, and then made a workable version available to the general public. However, this would undoubtedly have required a lot of time, money, and would have angered many of their devoted customers. They take the chance that the product will fail before they can repair the issues and release an update by sending it out “as is” instead.
From a commercial standpoint, there are several reasonable explanations for why this occurs. Businesses must consistently meet deadlines in order to avoid offending both shareholders and customers. Businesses can only devote a certain amount of resources to each project, therefore going over budget is frequently less desirable than providing a flawed product. In these circumstances, having some software is preferable to having none at all. ‘Release now, fix later’ is a maxim that many people live by.
The risk is typically quite low for little bugs. Few, if any, end customers will be impacted by the problems, which may be resolved after production and released as updates. The problem is far more serious for larger flaws.
The business risks that are taken into account when deploying software have already been discussed, but now we’ll explain them in words that are as genuine as a movie from the 1970s is capable of being. The popular Jaws movie from 1975 has been selected. This may seem like an unusual pick, but the movie has numerous instances where well-known issues are disregarded to terrible results.
So let’s set the scene.
Jaws is centered on a little beach town whose primary source of revenue is summertime visitors. Because of this, the holiday season is crucial to the community’s well-being. If the town were a software firm, the mayor would serve as the project manager, the police department would serve as the technical staff, and the tourists would serve as the product’s paying clients. A software company needs to release high-quality software to generate revenue, just as the town needs to put on a good display during the summer months to draw tourists.
The summer holiday season is about to begin, and the town (or software company) is getting ready to launch it and welcome hundreds of tourists (the paying customers). All seems to be going according to plan until a deadly shark attack occurs not far from the town’s shores. The police are informed about this and advise the town mayor to close the beach until the shark (the flaw) has been fixed. Relating back, this would imply that a software issue was discovered that needed to be resolved prior to launch. The Project Manager (Mayor) has chosen to disregard this recommendation and downplay the significance of the flaw, nevertheless. This immediately jeopardizes the lives of every beachgoer in the movie.
So why did the Mayor decide to do this? It is consequently in the best interest of the town’s commerce to keep the beach open, allowing the tourists to spend their money, seemingly at any cost, as he says in the movie, “You yell “Shark,” we’ve got a panic on our hands.” In practice, this means having to decide between postponing a release, which could result in lost sales and reputation, and releasing the flawed system in the hopes that no one would notice until a repair can be done later.
You probably know the movie or at least have a good idea of what will happen next. More shark attacks occur as a result of the Mayor’s risky decision to keep the beach open, which also causes tourist panic. The beach is eventually closed to tourists after the mayor finally accedes to the police’s recommendation. Recalling one’s own defective software would undoubtedly result in costs and very bad publicity for the software company. Now that he is dealing with a problem that is widely known, the mayor employs a team to work on fixing it.
The key takeaway from this is that every software release has some level of risk. Small issues can frequently go unnoticed, but in most cases, if you have a significant issue and decide to launch anyway, the issue will be discovered and have negative effects. In the movie, a gamble taken for the sake of money and reputation resulted in the deaths of many individuals. These similar dangers are constantly taken in the actual world. Although it is hoped that these risks won’t lead to anything as serious as death, it is undoubtedly a concern for software companies. Is the danger justified?

Everything You Need to Know About Software Testing Methods
Programmers work tirelessly to fix every bug in software before it is released for general or commercial usage, and the product is not released until all parties are happy.
Even though their software has low-priority flaws, Silicon Valley software companies like Google and Facebook frequently release successful products to the market. Millions of devoted customers and investors are willing to put up with brief product bugs and software updates from these businesses.
The majority of software firms lack this luxury. Customers are understandably concerned if there are unresolved vulnerabilities since they want items to function as promised.
Why Are Testing Skills Necessary?
Customers aren’t hesitant to change software development companies if the end result smells of time and money spent because there are so many options available. Before distributing their goods to clients, software companies must put their items through extensive testing. The following insights are provided by these tests:
● They draw attention to variations between the initial idea and the finished product.
● They make sure the software operates as intended by the programmers.
● They evaluate qualities and attributes.
● They confirm that the finished product satisfies the client’s needs.
Testing adheres to a precise blueprint to reduce burden, save time and money, and give stakeholders the data they need to advance the product. The objective of maintaining an extensive quality assurance (QA) program is to facilitate a favorable end-user experience. Considering the stakes for developers, QA managers are among the highest paid professionals in the technology sector. Testing typically happens after these steps:
1. Conduct a requirement analysis in which managers present a strategy for implementing a suitable test strategy.
2. Start the tests, then examine the results.
3. Regression testing (a mechanism to verify that the program still functions after changes) should be performed on the software after any flaws have been fixed.
4. Make a test closure report outlining the steps used and the results.
Through organizations like BCS, The Chartered Institute for IT, ISTQB (International Software Testing Qualifications Board), and ASQ (American Society for Quality), people can earn certification as software testers.
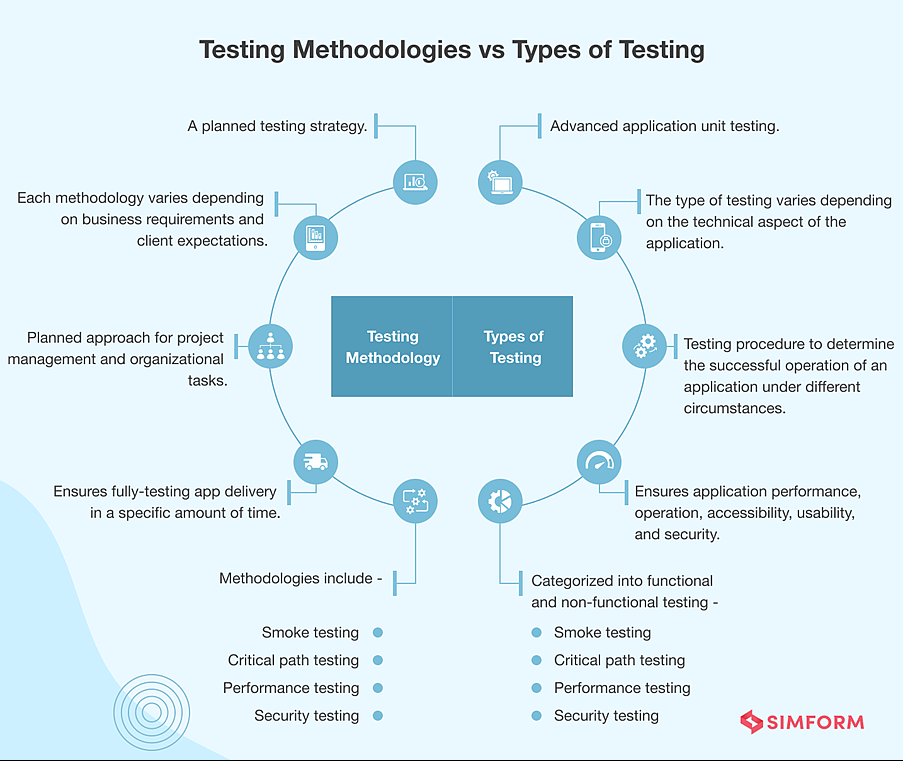
Software Testing Methods
Two important techniques for assessing the performance and behavior of a product are black and white box testing. Testing done in a black box, also known as functional testing or specification-based testing, is output-focused. The internal mechanisms are not of interest to testers. They merely verify that the software performs as intended. Testing at the user-interface level doesn’t require coding knowledge.
White box testing incorporates coding expertise into the test process. Testers delve deeply into the code to identify the root of a product’s problems. Because clients depend on them to make a product function, software developers will take care of this on their own. The terms “structure-based” and “glass box” are also used to describe white box testing.
Static testing doesn’t run the program; instead, it examines the source code and any supporting documentation. Static testing begins early in the verification process, before the product is even developed.
When the software is running, different inputs are used, and testers compare the results to the expected behavior. Graphical user interface testing assesses the layout, colors, text boxes, lists, buttons, and other interface elements. Because GUI testing takes a lot of time, third parties frequently handle it instead of developers.
Test Levels
In each stage of the software development lifecycle, various testing levels are used to spot overlaps and weak spots. Levels of the tests are:
● Unit test
● Integration testing
● System testing
● Acceptance testing
Developers evaluate the most fundamental portions of the code, including classes, interfaces, and functions and procedures, during unit testing. They are aware of how their code should behave and have the ability to modify it based on the results.
Another name for integration testing is “module” or “program” testing. While it contains a higher level of integration, it is comparable to unit testing. Software modules are examined for flaws in order to confirm their functionality. When the modules integrate, errors are found through integration testing. “Bottom-up,” “top-down,” and “functional incremental” are three different methodologies for integration tests.
System testing examines a project’s individual parts in various settings. One of the last tests in the process, system testing is included in the black box methodology. It will establish whether the system is ready to accommodate user and business requirements.
In general, there are two kinds of acceptability testing. At the developer’s location, the software is internally run in a mock or real environment during alpha testing. The program operates as though it were being used by actual end users. Any problems are noted by developers, who then start working to fix bugs and other issues.
Clients examine software via acceptance testing, which falls within the purview of black-box testing as well, to determine whether the developer properly constructed the program to meet their intended criteria.
Customers can test the product on their sites in actual usage during beta testing, often known as field testing. A set of end users may be given the chance to try out pre-release or beta versions of the program by clients. Real user feedback is sought during beta testing and provided to the developer.
Test Types
Software tests come in a variety of forms, each focusing on a particular goal. Installation testing is used by the configuration manager and test engineer to confirm that the program can be installed and run by the end user. It covers topics including administrative privileges, installation locations, and installation files.
Several coordinated strategies are used in developmental testing to find and stop errors. It incorporates metrics analysis, traceability, peer code reviews, and static code analysis. Risks are to be decreased, and money is to be saved.
Usability testing puts user experience in the spotlight. It gauges how user-friendly the GUI is. It evaluates the functions’ precision and effectiveness as well as the test participants’ emotional reactions.
A sanity check determines if additional testing of the software is worthwhile in terms of both time and money. Intense tests won’t follow if there are too many faults.
Sanity testing is carried out at the software release process, together with smoke testing to determine whether the program will function well enough to support testing.
Fundamental flaws that are severe enough to prevent release are discovered by smoke testing. It is referred to as a “build verification” test when developers test a fresh build. Regression testing detects unexpected behavior after system modifications. It draws attention to detrimental impacts on modules or components.
In destructive tests, testers enter anomalous entries to assess the software’s capacity to handle unforeseen input. This demonstrates to programmers how capable the program is at handling errors.
Recovery testing demonstrates how well the software can recover and go on working when hardware or other components fail.
Functions that are difficult to implement manually are performed by automation. Testing entails running tests using specialized software and providing data on actual vs. expected results.
Compatibility testing examines how the software behaves under diverse computing environments, which the software must operate in. For instance, programmers test the software using numerous web browsers and operating systems.
If tests aren’t thorough and cover every client concern, the project will quickly become a waste of resources.
Software performance under various situations is examined during performance testing. Information is gathered about responsiveness, stability, resource allocation, and speed. This method includes subtests like volume, capacity, and spike testing.
The software’s capacity to safeguard users’ security is evaluated through security testing. Examples of features that need to be evaluated include authentication, confidentiality, integrity, availability, and non-repudiation.
Usability testing is distinct from accessibility testing. This establishes the software’s level of usability for users of different skill levels.
The results of internalization and localization tests demonstrate how the program may be customized to meet linguistic and regional requirements. This entails text translation and the addition of components for certain places.
How to handle defects in Kanban
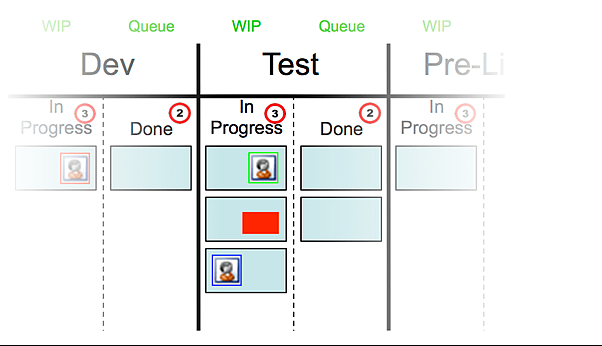
The Waterfall approach is:
1. Place a load of software into test
2. Testers log a load of defects in a tool
3. Developers get around to the defects at some point and work through lists of defects P1, P2, P3 as prioritized by the project manager.
4. Go to step 1 for the next few months (sometimes years)
The Scrum approach is:
1. Smaller software batches are put through testing.
2. Defect cards are often created by testers and placed in the development column of the scrum board or card wall.
3. Developers take on the red cards, finishing by putting them back into the test column.
4. Continue at step 1 until all issues are fixed or the sprint is over. Any flaws or tales that are left behind are carried over to the following sprint.
The Kanban approach is:
1. The tester inserts a tale into the test
2. A tester discovers flaws.
3. The developer instantly halts their work and collaborates with the tester to fix the problems. There are no defects noted. Red cards are not produced. The improved automated testing.
4. The goal is to finish the story in a manner that is acceptable.
5. Send the story to a live or production.
The method described above is just for managing in-development defects. However, what about flaws that go undetected and enter a live environment? These flaws are frequently referred to as Escaped Defects.
These Escaped Defects are added to the backlog in Kanban and given the same priority as the rest of the product backlog. It might be hastened, but the Product Owner and other stakeholders will decide whether to do so.

Biggest Product Recalls of All Time: Johnson & Johnson’s Tylenol Recall
● Year: 1982
● Cost: $100 million
It’s true that several recalls since have cost and in scope beyond Johnson & Johnson’s (JNJ(opens in new tab), $125.10) 1982 Tylenol recall. The cost of the recall, after inflation, was almost $250 million.
But it’s arguable that no other event has had a greater influence as the turning point in the history of recalls.
J&J, dubbed “the recall that started them all,” established the norm for how businesses should respond to such situations. Seven persons in the Chicago area passed away as a result of consuming cyanide-laced Extra-Strength Tylenol in an instance of product tampering. To recall 31 million bottles of their top-selling product, J&J spent over $100 million.
Tylenol, which at the time represented 17% of the company’s profits, was saved because of J & J’s quick and effective response. Even if the stock price originally fell, it soon rose again.

Course Manual 2: Take Only What’s Needed
Why Prioritization is Important and How to Best Prioritize Your Backlog
When it comes down to it, setting job priorities can be challenging. Even with the best of intentions, backlogs quickly fill up as upcoming epics, features, and tech debt compete for the top spot. What are some ways to prioritize your backlog throughout your IT transformation and why is prioritization so crucial? And how do you prepare for the future?
According to Benjamin Franklin, “By failing to prepare, you are preparing to fail.” Backlogs will overflow, sprints will lack focus, and there will be a lot of work in progress without a purpose for finishing features and distributing them to consumers if there is no plan in place for how your team will accept new work and prioritize it. The trick is planning for the future and realizing that your team cannot work on everything at once and yet provide value to your consumers.
It is crucial to prioritize such goods so that the delivery teams can pay attention to them, even if it is normal for other things to compete for attention. There are frequently five or more priorities that lack concentration and scheduling considerations, according to sprint ceremonies. You smooth delivery by offering clarity.
Constantly changing priorities results in a lack of focus and slowed delivery, much like how having too much work in progress can affect delivery. Establishing goals and sharing them with the team, the stakeholders, and perhaps even your customers—hence, prioritizing them—is one method to avoid this. By setting important priorities, you can make sure that the right tasks are completed on time and that additional deliverables don’t go overlooked. By maintaining the prioritization of your backlog, it also aids in everyone staying on course.
Focusing delivery on what matters most, and what will bring the most value to customers
Customer-focused goals should be considered when determining what can be completed in a sprint, release, or quarter. What will offer your customers the most value? Who or what are they awaiting? Are there any upcoming surprises or important deliverables (contracts, events, etc.) with deadlines?
These are the factors you should be considering as we go over the various ways of prioritization below. Keep in mind not to assume what your customers value and anticipate. In the end, speaking with your customers is the only way to truly comprehend them. Knowing your target market and the issues that your product addresses for them is essential to understanding your product.
What are the best techniques for determining what comes next, then, and how do you manage prioritization? Two effective techniques are listed here. In the end, how you and your team operate will determine which is ideal for you. Iterate to discover the optimum procedure, just as you would while developing a product to find the best features.
Stack Ranking
The simplest basic prioritization technique is stack ranking. It simply entails prioritizing each item one at a time, starting at the top of the backlog.
When stack ranking your backlog, begin by going over the first item to get a sense of the “ask.” Next, consider the second backlog item. Do you think the second thing is more crucial than the first? In that case, move it up. In that case, leave it alone and go on to the next thing. Continue in this manner until the backlog is completely cleared.

The following factors should be taken into account when weighing the items:
• value to the Customer
• legal requirements
• deadlines
• and dependencies.
Prioritize products that your clients will appreciate highly. Priority is also given to contractual, legal, and security matters. Don’t ignore timing when determining priority. If there are any contractual deadlines or any planned activities, these must come first. The last factor to take into account is whether an item has a greater priority if it depends on another to be completed.
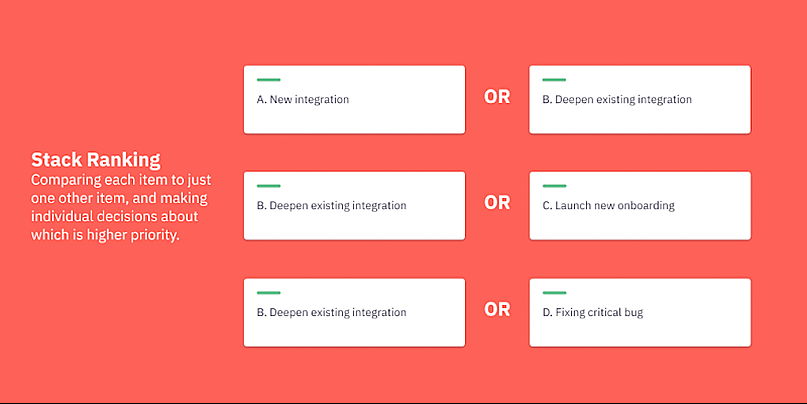
While Stack Ranking can be completed independently, involving the team and stakeholders will add perspective and guarantee that the product as a whole, rather than just one viewpoint, is taken into account when setting priorities. Of course, the price increases with the number of participants. Prioritize and group related work items in the backlog after a few preliminary passes and before meeting with the team and stakeholders. Grouping will make the Stack Ranking procedure more effective. As you go through the backlog, similar items can be moved together if they are together.
Although it may seem tedious, the great thing about this approach is that once you get to the end of the backlog, you are finished (at least for the time being). Now that the backlog is organized, you should make an effort to keep it that way in order to position the product for success.
MoSCoW method
Rapid Application Development gave rise to the MoSCoW approach. The items are divided into the four categories of “must haves,” “should haves,” “could haves,” and “won’t haves” using this procedure.
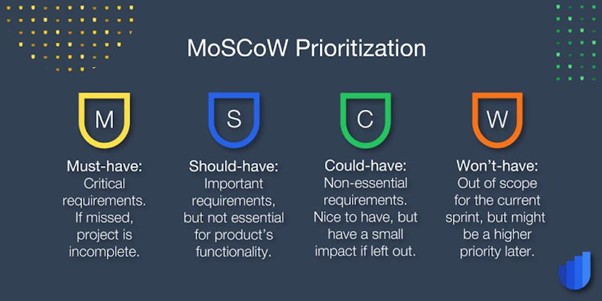
• Must Have – Things that the product must contain. These are the things that a Minimum Viable Product (MVP) must have. The delivery would be deemed unsuccessful without them.
• Should Have – Items that are expected but not necessary. These things aren’t Must Haves, but they aren’t far behind in importance.
• Could Have – These things could be included if there is time and money available. Although they are not as crucial as Should Have items, they would benefit your customers.
• Won’t Have – Things that won’t be incorporated. This does not imply that the item will never be finished. These items, however, are not currently a priority and will not be incorporated into the next releases.
Decide how you will flag which category each item belongs to using the MoSCoW approach first. Your backlog tool will determine how you handle this. You’ll need a method for searching and filtering each category. The optimal approach is this one if searchable labels are provided. Another option is to utilize a priority or stack rank field and give each of the four groups a priority or stack rank.
Work through the backlog labeling each item with either Must Have, Should Have, Could Have, or Won’t Have once you’ve determined how to group the items within the parameters of your backlog tool. After all backlog items have been classified, group them by category and arrange them in the proper order, starting with the must-haves and moving on to the should-haves and so forth.
The next step requires discipline; use stack ranking to order the entries in each category. Decide which item in each group is most crucial by focusing just on those elements. what follows after that.
“If these are all Must Haves, does it matter?” you might be asking. Yes, it is important. The items will be picked up and implemented in the backlog sequence. Dependencies and complexity, in addition to what is most crucial, should be taken into account for Must Haves in particular. It is always best to take care of the most crucial issues first. Would you like a Should Have that would please your customers be released if you were to run out of time for the following delivery for some reason?
These choices need to be made. This activity can be done alone, much like stack ranking, but it gains perspective when stakeholders and the team are involved. Start with the grouping exercise so that these meetings won’t be drawn out and tedious. Next, in a different meeting, stack the groups according to rank. Though it might take some time, once finished, you’ll have a backlog that is well-organized and prepared for both the current release and planning of upcoming releases.
Continue Setting Yourself up for Success
Talking about new work and timeliness is simpler once you know what’s coming up. Don’t allow the hard effort you put into the prioritization process to go once it is over. Establish priorities as new items come in to ensure success. Check in at the conclusion of each sprint to make sure that the work scheduled for the following sprint still complies with the current priorities.
Check in with stakeholders and the team once a release or quarter to make sure the backlog priorities are still being met. Contact customers frequently to get their input and determine whether any new issues need to be resolved. By doing this, you can be confident that you’re focusing on the tasks that are most crucial and will benefit clients the most.

Other Backlog Prioritization Techniques That Work
1. Kano Model
Professor Noriaki Kano created the Kano model in the 1980s. The Kano Model classifies features based on customer demands and expectations. The Kano model is available in a number of variations. The original, on the other hand, divides objects into five categories based on five thresholds: must-be, attractive, one-dimensional, indifferent, and reverse.
Must-Be — Customer expectations include these. They are characteristics that won’t impress them. They are a must for your product and frequently taken for granted.
Attractive — When these are present, users are happy, but they don’t let them down when they aren’t.
One-Dimensional — When these features are present, users are satisfied, and when they are not, they are sad.
Indifferent — The levels of client satisfaction are unaffected by these. Refactoring your code, for instance, can make it simpler to read and comprehend certain sections of it. Although there is no immediate benefit to the customer, it will be simpler for you to maintain in the long run.
Reverse — When these are present, users are sad, but when they are not, they are happy. You might, for instance, integrate high-security features that need an additional step for login. Customers won’t appreciate the extra step if they don’t value increased security, though.
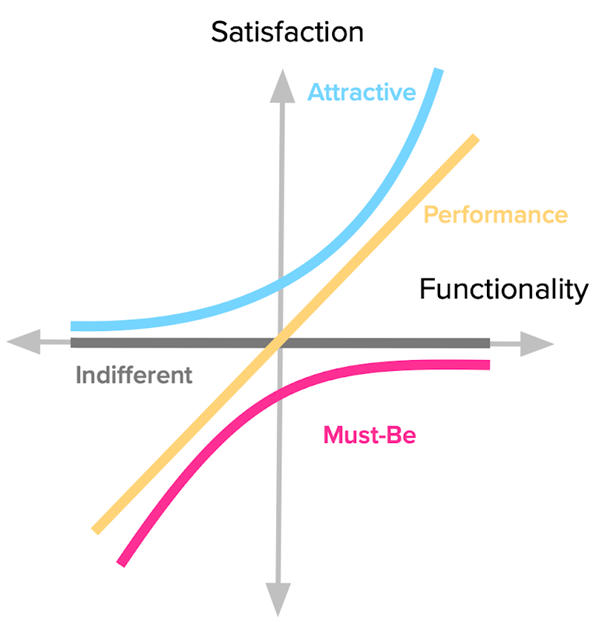
Why Use the Kano Model?
In organizations that frequently only implement Must-Be features, the Kano model is incredibly helpful. But you also need to offer appealing and limited features if you want to succeed in the market. Picking one item from each of the crucial areas listed above is a smart practice when it comes time to prioritize what gets into a release.
Kano Model Versus MoSCoW Model — The Difference
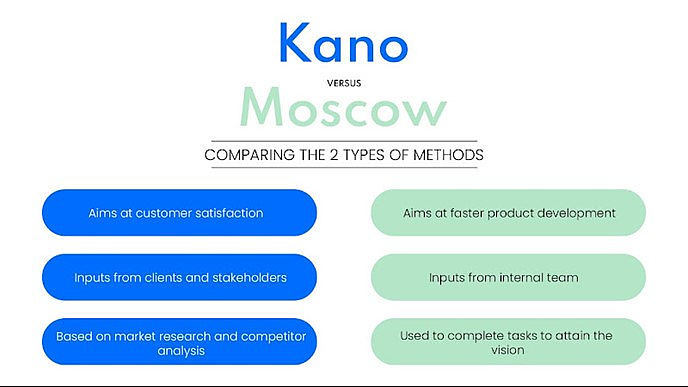
Both the Kano Model and the MoSCoW model offer buckets that can be sorted by level of need. But they are not interchangeable. In the MoSCoW model, a “must have” differs from a “must be” in the Kano model.
Since the MoSCoW category is controlled by the product owner, it frequently receives priority attention and has a product-driven viewpoint. On the other side, the Kano model categorization has a market-driven approach because it relies more on input from product management, sales, competitive analysis, etc.
Therefore, combining these two approaches can be very beneficial for Agile teams. You may make sure your product has a decent balance of customer-friendly, market-ready features by supplying a combination of “must-be”, “attractive”, and “one-dimensional” features in addition to “must-haves” per MoSCoW.
2. Cost of Delay
Donald Reinertsen, a pioneer in the lean movement, advises quantifying the cost of delay if you must choose one thing to measure.
The majority of product development organizations today have little to no shared understanding of the cost of delay for each feature, notwithstanding this powerful adage.
Answering the question “What will be the cost per time unit if we delay delivery?” will help you estimate the cost of a delay. The estimate to supply the feature with the largest cost of delay and which is cheapest to accomplish first can then be compared to your response. Prioritization in this manner is known as Weighted Shortest Job First (WSJF).
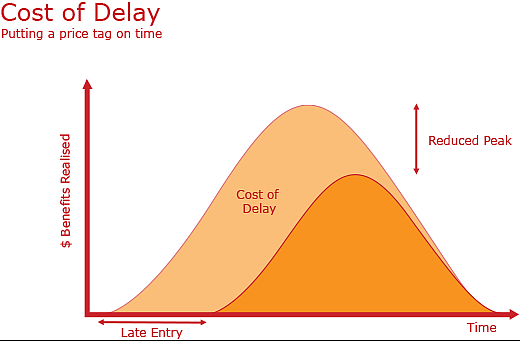
Keep in mind that the cost of a delay is not always calculated in monetary terms. Value and cost can be evaluated in a variety of ways. Two examples are tale points or reputation.
It can be difficult to calculate the cost of delay for each specific feature. Those who are good at it make an effort to take time-varying costs of delay into account. They frequently adhere to the following standards.
Linear — We incur some financial loss for each day we don’t deliver. Money lost as a result of rivals having a feature that you don’t is a typical example of a linear cost of delay.
Fixed date — It’s too late if we don’t provide by a specific deadline. As an illustration, consider creating New Year’s cards for 2019. The cost of delay is really substantial if you don’t provide them before the end of 2018. It doesn’t matter if you deliver after that, in January or February; it’s too late!
Intangible — For the time being, we can delay with little expense, but in the future, it might be costly. The price of waiting to resolve a few bugs or rearrange your code is a nice illustration. You can skip today, but doing so will eventually increase the expense of other upgrades and potentially exponentially increase the cost of delay.
Expedite — If it isn’t done right away, the cost will drastically increase. An extreme issue that renders your product worthless to all of your customers is an example of an expedite feature.
You can usually determine what should be done first by comparing the cost of implementation to the cost of delay categorization.

Rocks, Pebbles and Sand
Before his students, a philosophy professor stood with various items in front of him. He took up a large, empty mayonnaise jar before class started and filled it completely with rocks, each measuring about 2 inches in diameter.
Then he questioned the pupils, “Is the jar full?” They both agreed it was.
The professor filled the jar with pebbles after taking a box of them out of his pocket. He gently shook the jar. Naturally, the pebbles rolled into the spaces between the boulders. The pupils chuckled.
He once more questioned his students, “Is the jar full?” They concurred that it was.
Later, the professor took a box of sand and poured it into the container. Naturally, the sand covered everything else.
“Now,” the professor said, “I want you to understand that this is your life. Your family, your relationship, your health, your children, or anything else that is so essential to you that losing it would almost destroy you are the rocks in your life.
The other important aspects of life are represented by the pebbles, but at a lower size. The pebbles stand in for items like your house, car, and place of employment.
Everything else is just the sand. the minor details.
There is no room for the rocks in the jar if the sand or pebbles are placed there first. It’s the same with your life. You won’t have time for the things that are actually most important if you focus all of your effort and attention on trivial, worldly matters.
Pay close attention to the important aspects of your life. Play games with your kids. Invite your partner to a dance.
Going to work, cleaning the house, hosting a dinner party, and fixing the garbage disposal will all always have time. Take care of the important stuff first, the rocks.
The same is true of setting priorities at work. Smaller, less urgent jobs can wait while the big, vital ones (the rocks) are completed first.
Decide on your priorities. All that is left is sand and pebbles.

Prioritizing Work Efficiently: Classes of Service in Kanban
Although many project managers recognize Kanban’s advantages for productivity and efficiency, they are unsure of how to prioritize tasks effectively. How would you handle a crisis? What considerations are made for deadlines and milestones? When are maintenance activities performed?
Kanban Classes of Service can help with it. Classes of Service let you create parallel workflow streams for various task kinds, keeping your projects on schedule without disrupting the usual flow and accelerating critical tasks as required.
What are Kanban Classes of Service?
Classes of Service (CoS) are used to categorize various work items based on their priority and to specify exactly how each CoS’s items should be handled.
Imagine, for illustration, that all of the servers at your business fail. The top priority is to get connected again right away! Implementing a new feature, on the other hand, has a lesser priority. These two tasks would be classified under two distinct Classes of Service. This function was created early in the history of modern Kanban to manage tasks with various priority levels.
Different policies are applied to different levels of priority in Kanban Classes of Service, which group tasks based on their priority. These guidelines, which are based on the needs of the project and the team, may specify when tasks are added from the backlog to the workflow, the number of tasks that can be actively worked on, and how resources should be distributed.
Types of Classes of Service
Kanban teams are allowed to have as many Classes of Service as they feel necessary for the project at hand. Starting off, we advise keeping things straightforward using the CoS listed below:
• Standard: Items, features, and upgrades that are commonplace. The majority of your work products ought to be in this CoS.
• Fixed Delivery Date: Deliverables that need to be made by a specified date or earlier. Important project milestones, compliance obligations, release dates, etc. may fall under this category. A typical CoS policy would state that progress towards the Fixed Delivery Date cannot exceed 30%.
• Expedite/Emergency: Tasks that need to be finished right away. Normally, there can only be one task of this type active at once; urgent tasks should advance quickly through the workflow. Even if the Kanban WIP limit has been surpassed, urgent jobs can still be retrieved from the queue.
The majority of Kanban teams classify bugs as a type of service that must be resolved fast and with a level of priority that falls between emergencies and required features. Some Kanban teams include additional classes; a Chore or Intangible class is a typical inclusion. This is used to gather maintenance chores that are necessary but not urgent but frequently go neglected in favor of more important duties. If left unattended over a long enough period of time, a Chore CoS item may develop into an Emergency.
Benefits of using Classes of Service
Implementing Classes of Service allows you to prioritize special cases without disrupting your regular workflow, which is its main advantage. The team can handle emergencies, meeting project milestones, and other crucial duties by adhering to set policies because everyone is aware of what to do in each situation.
The capability to calculate the Kanban metrics for each Class of Service individually is another advantage. While the cycle time for standard features ranges from 5-7 days, your target cycle time for emergency items may be 48 hours.
The tendency to treat too many tasks as emergencies is a common drawback of employing Kanban Classes of Service. Standard duties may be overlooked if all of your team’s efforts are focused on completing projects that must be completed quickly. If an excessive number of jobs are being flagged as emergencies, your team may be under staffed or there may be a bottleneck that needs further study.
How to implement Classes of Service
Choosing your classes is the first step in putting Classes of Service into practice. Standard, Fixed Date Delivery, and Expedite/Emergency are the three options we advise starting with first in order to keep things easy. Try combining different Classes of Service to see what works best for your project. You might discover later that you need to add another CoS or two.
The policies for how each CoS should be handled should then be specified. Even though tasks are part of the same workflow and follow the same procedures, their Class of Service may have an impact on how quickly they move through the system. You might need to experiment with various WIP limits to find the right mix for your team. Some teams like to set percentage caps on the number of tasks from each CoS that can be active at once. Keep in mind that lower WIP limits are optimal for productivity when in doubt.
WIP restrictions are but one element of CoS policy. How do you want your team to handle the various priority levels? Is it preferable to assign one or two team members to an emergency assignment rather than “swarm” the work with all team members to get it through the system as quickly as possible? What circumstances, if any, allow one assignment to interfere with work on another? What stage of the workflow should low-priority items be brought into? Project managers should carefully consider how to approach these issues and be ready to modify and enhance their procedure over time.
You can greatly benefit from using the Kanban workflow management strategy to accurately prioritize activities. It will direct you to prioritize work and deal with essential situations as quickly as feasible. Setting some fundamental guidelines on your Kanban board and ensuring that your team rigorously adheres to them is all that is required.
How to Prioritize Work with Kanban Columns?
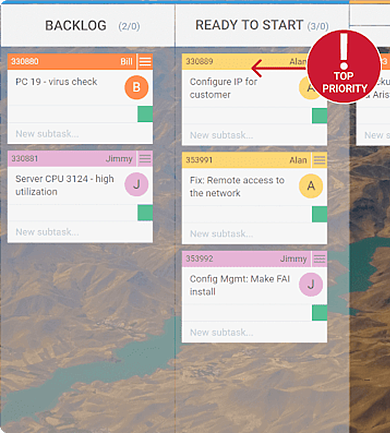
Source: Kanbanize
Every Kanban board typically begins with a column titled “backlog”. All of your future work and ideas should go here.
The “requested” or “ready to start” column is the next one, and it acts as the place where work items enter your workflow. Depending on their importance, all Kanban tasks that the team committed to commencing are positioned there.
Nevertheless, depending on the capabilities of your team, there may be various waiting Kanban column types further along in the workflow on your board.
Your group must adhere to the principle of pulling the top cards first for each of them in order for the most urgent jobs to be finished as soon as feasible.
Following are some instances of waiting Kanban columns:
• Waiting for Approval – For actions that need permission before processing (such as payments and promotional sales), this kind of Kanban queue column is appropriate.
• Waiting for Review – Work items waiting to be evaluated are in this Kanban queue, which is an important step in the workflow. Before tasks receive feedback and advance to the completion stage or go back for improvements, it functions as a filter. It is essential to the quality of the product or service (for example, in product development, content creation, design, etc.).
• Waiting for External Activity – Tasks that are awaiting completion of activities from other parties can use this type of Kanban column. When a team interacts with other units outside the firm, it frequently occurs. (For instance, collaborations, affiliate schemes, etc.)
Kanban typically results in a pull system where team members pull their subsequent tasks after completing their present ones. However, you must be aware of one fundamental principle before pulling the next work item:
When you place future tasks in a waiting Kanban column, you need to make sure that the top ones will be of the highest importance.
It will always be the highest priority Kanban job that one of your team members chooses to pull. This does not imply that tasks with high importance will always take precedence over ones with low priority. Only urgent job items must be expedited.
Prioritizing Tasks with Kanban Swimlanes
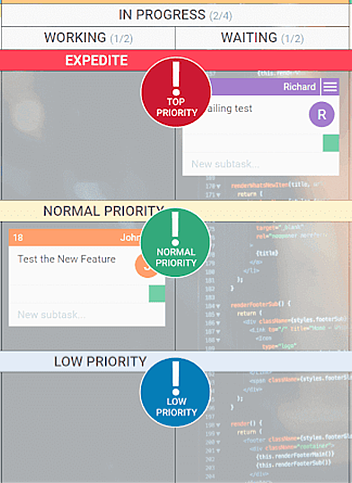
Source: Kanbanize
Swimlanes are a tool for increasing transparency, but they may also be used to rank the jobs on your Kanban board. Swimlanes can be used in a variety of ways, including: While columns separate your workflow into several stages (such as development, review, and ready for delivery, etc.), swimlanes can be utilized in:
1. Grouping tasks depending on the type of work, for example, web development, technical features, content, etc.
2. Grouping tasks based on product development: Working on product X, product Y, or product Z.
3. Grouping tasks depending on their priority: low priority, average priority, high priority.
Work prioritization is simple to do in the first two situations. A “expedite” swimlane needs to be added to your Kanban board’s top row. After that, all you have to do to address an important matter is move it to the top swimlane. Additionally, make sure the team member assigned to this specific issue focuses solely on it until it is resolved.
You may be sure that important work items will be finished before others by using Kanban swimlanes to prioritize tasks. Additionally, visualizing the entire process will enable you to identify weak points in your workflow and make ongoing improvements to it.
The Kanban Backlog
The backlog is the area where you put tasks or ideas that won’t be completed for a while. All of the tasks in the Kanban Backlog may not, however, be completed. The items in this column are more of a team’s option than a commitment point for upcoming work.
Prioritizing the Kanban backlog
Your team may plan all upcoming work in the backlog, but it can quickly become disorganized and overflow with ideas.
For this reason, your team needs to go over every item on the backlog to make sure it contains the right ones and to prioritize them. This should be a continuous activity or, even better, a frequent activity.
During this process of refinement, your team can do a number of things, including:
• removing irrelevant tasks
• new tasks that cover newly discovered requirements
• merging tasks
• breaking down items that are too big and others
Additionally, you can add sub-columns to your backlog to distinguish between tasks scheduled for various timeframes, such as every quarter of the year.
Prioritizing Tasks With Color Indicators
One of the most typical methods for prioritizing work is the use of color indicators. You can typically mark priority levels with specific colors in modern Kanban software solutions.
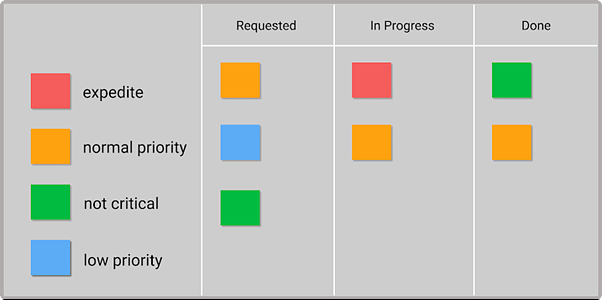
Source: Kanbanize
A red card can indicate a crucial priority, but a green one might indicate a typical priority. Additionally, you can add color codes for tasks like “bug” and “change required,” etc. Color markers act as visual cues that each team member can recognize.

Demands of the Market
It’s critical to develop goods and services that are a reflection of market demands in order to avoid overproduction and waste. You will then be able to give jobs that are important to customers a high priority.
Market demand is the precise amount of a good or service that customers can afford to and desire to purchase at the stated cost of that good or service. Market demand has an impact on both firms and consumers since it influences production and shapes market competition. In order to design, produce, and promote goods and services to consumers in order to meet demand, firms must be aware of the market demand.
Why is market demand important?
When launching a new product or service, market demand is crucial to take into account because it enables businesses to meet consumer needs. Here are a few more advantages of researching market demand:
• Customer satisfaction: Knowing the market demand allows a business to produce the goods and services that customers want and need, as well as the appropriate quantity of those goods and services to satisfy demand.
• Business opportunity: Analyzing consumer behavior trends and market demand might help companies predict their clients’ demands. This entails paying attention to customers’ needs and designing products accordingly.
• Production and customer-focused strategy: Analyzing market demand aids organizations in developing customized products for customers and ways to engage with them. How a firm addresses its target audience is determined by calculating and comprehending the market demand.
• Cost-effective techniques: Businesses can calculate market demand to determine how much of a product or service to provide customers. By doing this, overproduction, which may be expensive for a corporation, is avoided, and it is ensured that the company can sell and profit from its goods or services.

Target’s Disastrous Failed Expansion into Canada
Being a well-liked brand in the US, Target’s up-north expansion into Canada seemed to be met with the same enthusiasm. Executives at Target needed to decide. They decided to use a brand-new, unproven system since they needed a way to monitor their stock levels. Target Canada would eventually find out what happens when inexperienced workers are expected to launch a business using technology that nobody—not even at the US headquarters—understands while working under a tight deadline.
Target stores were understocked in 2013 as a result of the company’s difficulties transferring merchandise from its sizable distribution centers onto shop shelves. The company’s supply chain software, which controls the transfer of merchandise, included data that was rife with errors, and Target quickly realized this was the root of the problem. The checkout system had issues and didn’t properly process transactions. Even worse, no one in the company appeared to really comprehend how the technology used to manage inventories and sales.
Why Too Much Inventory is Bad:
Along with technology issues, ordering and inventory issues were out of control. Target experienced delays with items that had extensive lead times and were imported; either the products didn’t fit as planned into shipping containers or the tariff codes were incomplete or missing. The distribution center couldn’t complete requests for sending finished goods to a store. Other items couldn’t properly fit on store shelves. What at first seemed to be a few little fires suddenly grew into a blazing inferno that threatened to shut down the company’s supply line.
The dead stock and merchandise were overflowing from Target’s distribution centers. More merchandise than Target Canada could sell was ordered. A sophisticated forecasting and replenishment system had been purchased by the corporation, but it wasn’t useful right away because it needed years of historical data to provide accurate sales estimates. The procurement staff relied on excessively optimistic estimates created at US headquarters when getting ready for store openings.
Target Canada filed for creditor protection around two years after they began operations, bringing a stop to their first overseas venture and one of the most perplexing corporate sagas in Canadian history. The scandal cost the parent business billions of dollars, damaged its reputation, and resulted in the loss of employment for almost 17,600 workers.

Course Manual 3: Produce the Exact Quantity Required
The PBI, CFD, PO, TDD, INVEST, and other acronyms that are popular in the Agile and Lean communities are among the most misunderstood of all.
The majority of people appear to believe that creating a “Minimum Viable Product” is the bare minimum that must be done to a product before it can be launched onto the market.
MVP: Minimum Viable Product
“A learning vehicle” ~ Eric Ries
An approach for iteratively learning about your customers is to use MVP. It “assists entrepreneurs in launching the learning process as quickly as possible.” Instead of investing a lot of time and money in a fully-fledged product before you know whether it has the necessary value, MVP suggests that you learn about your vision by getting potential customers to test an idea/prototype/initial offering, then adapt your product based on the feedback collected. “It is not necessarily the smallest product imaginable, though; it is simply the fastest way to get through the Build-Measure-Learn feedback loop with the least amount of effort,” writes Eric Ries in Lean Startup. Its objective is to verify basic business assumptions.
As an illustration, if I wanted to launch a T-shirt business, I may ask passersby their opinions after bringing some sketches to a busy street corner. Another strategy would be to upload various photographs to a website and monitor which ones get the most clicks. Using either strategy, I could then base the initial batch of T-shirt production on the designs that garnered the most interest (and avoid spending money on stock that no one would buy).
Minimum Viable Product does NOT equate to the bare minimum product that can be sold.
MMP: Minimal Marketable Product
“… the smallest possible feature set that addresses the user needs, creates the desired user experience” ~ Pichler
When individuals use the term MVP, I believe they usually mean Minimum Viable Product (MMP): this is the product with the fewest features that you deem to have market value; you wouldn’t want to expose your product to the general public before it has reached this stage.
This might be a website with 6 distinct designs in 5 different sizes that clients can purchase from using PayPal for our t-shirt business. However, it’s also possible that the site only offers one design, requiring customers to call in to place their orders. Your business model will determine how this will work.

What is the Purpose of a Minimum Viable Product?
According to Eric Ries, who popularized the idea of the minimal viable product as a component of his Lean Startup technique, an MVP serves the following purposes: It is the version of a new product that enables a team to get the most verified customer learning with the least amount of work.
A business could decide to create and market a minimal viable product because of the following objectives of its product team:
● Release a product to the market as quickly as possible
● Test an idea with real users before committing a large budget to the product’s full development
● Learn what resonates with the company’s target market and what doesn’t
An MVP can reduce the time and resources you might otherwise devote to developing a product that won’t succeed in addition to enabling your business to validate an idea for a product without producing the whole product.

Successful Minimum Viable Product Example: Amazon
One of the most prominent illustrations of a minimal viable product that was successful is the well-known, custom-multipage shopping destination for individuals. The fact that Amazon once began as an online bookstore in the early 1990s may be little known. People did not trust the internet at that time, therefore it was simply impossible to have an online store that sold “everything.” However, the founder, Jeff Bezos, had a goal of creating a vast empire. According to a report he had read, digital commerce would rise by 2,300 percent annually in the near future. Therefore, he began by developing a minimum viable product.
The top 20 products that could be successfully marketed online were streamlined in the first stage of development, and then they were reduced to 5. But Bezos ultimately decided that books were the most easily sold item online. Price, a wide range of titles that could be marketed, and a large global demand for books were the deciding reasons. He therefore began by purchasing books from the distributors and selling them through a straightforward website at a discount. While the majority of business owners would have spent money on a fully functional store. Bezos lived cheaply and tested his concept with a straightforward website (MVP).
More books were added as the number of online book orders increased. The MVP was fantastic, and during the subsequent 20 years, other innovations were made to increase the range of available products. The website received a long list of new features, and a warehouse was also purchased. Currently, Amazon is the retail colossus and holds the title of largest retailer in the world (outside of China) after outpacing many eCommerce behemoths.
How Do You Define Your Minimum Viable Product?
How does one create a minimal viable product, and how does one let the rest of the team know when it is ready to be released? Here are a few clever things to do.
1. Make sure your planned MVP aligns with your business objectives.
The first step in creating your MVP is to confirm that the product will correspond with your team’s or your company’s strategic goals before deciding which features to construct.
What are these objectives? Do you have a target revenue goal for the next six months? Are your resources limited? These queries may influence whether it is even appropriate to begin creating a new MVP at this time.
Ask what function this minimum viable product will fulfill as well. Will it, for instance, draw in new customers in a market that is close to the one where your current products are sold? If you currently have it as one of your business goals, then this MVP approach might be strategically sound.
However, if your company’s current priority is to keep concentrating on its core markets, you may need to shelve this idea and give your attention to something else, such as an MVP that provides new functionality for your current customers.
2. Start identifying specific problems you want to solve or improvements you want to enable for your user persona.
You can now consider the precise solutions your product should provide users after determining that your MVP plans are in line with your business goals. These solutions, which you might describe in user stories, epics, or features, only cover specific aspects of the product’s overarching vision. Keep in mind that your MVP can only have a limited amount of functionality.
When selecting which limited functionality to include in your MVP, you must exercise strategic judgment. You can base these choices on a number of things, such as:
● User research
● Competitive analysis
● How quickly you’ll be able to iterate on certain types of functionality when you receive user feedback
● The relative costs to implement the various user stories or epics
3. Translate your MVP functionality into a plan of development action.
It’s time to integrate this into a development action plan now that you’ve considered the strategic factors mentioned above and decided on the restricted functionality you want for your MVP.
Keep in mind that the product must be viable when creating an MVP. This implies that it must offer a top-notch user experience while enabling your consumers to finish a task or project in its entirety. A user interface with numerous incomplete tools and functionalities is not acceptable for an MVP. It must be a functional product that your business can sell.

What are Examples of the Minimum Viable Product?
If you’re curious how this would actually work, let’s look at how a few well-known companies started their successful MVPs.
Airbnb:
The Airbnb founders tested their business idea in their own flat because they lacked the capital to start a company. Their goal was to establish an online marketplace for short-term, peer-to-peer rental housing. They built a simple website, posted pictures and other information about their place, and almost immediately they started receiving payments.
Foursquare:
Check-ins and gamification incentives were the only features available in the initial MVP of the location-based social network Foursquare. Once the concept had been approved by a willing and expanding user base, the Foursquare development team started adding recommendations, city guides, and other features.

MVP delivery using Kanban
Lean Inception and Kanban can work well together, much like Scrum does. While Lean Inception assists a team in being efficient by focusing individuals on the product, Kanban aids this team in being effective in its workflow and method of operation.
The next phase is to proceed with the building of the MVP after doing a Lean Inception, comprehending the features, and breaking them into stories. And how does that apply to Kanban?
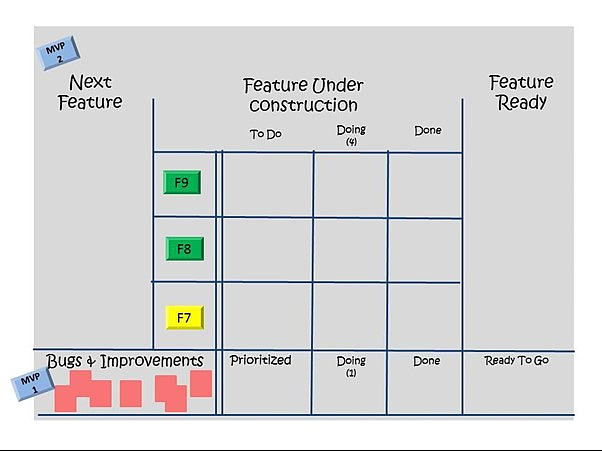
Image: Kanban board template.
You will choose and shape the following features into user stories on a condensed Kanban board. You will move the Feature card from Next Feature to Feature Under Construction in the image above. The Feature is then further developed into User Stories, which are then added to the To Do stage. The User Stories that are being worked on proceed from the Planning stage to the Doing stage and then, when ready, to the Done stage. A feature’s card changes to Feature Ready once all of its user stories and tasks have been finished.
As a result, the “pull system” that was previously discussed is still in effect: after finishing all the stories in a feature, you free up a spot on the board and select the following feature. Run a PBB session if necessary, then edit and write user stories for the upcoming feature and post them in the To Do column of the Kanban board. As they continue to work, the team is drawn into Doing until everything is finished (Done).
It is important to keep in mind that when a given feature comes from the next increment and not the MVP, it must be made visible on the Kanban board, whether it be physical or virtual. The team will deliver the MVP once all of the features for the MVP have been completed, signal completion, and then move on to the following features and stories for the following Product Increment.
The team will probably get valuable usage feedback once the MVP has been produced and put in the hands of the users. Identifying who will handle this demand and who will work on the features of the next product increment is necessary in order to organize the workflow in an agile manner without overburdening any team members. This feedback will often involve improvements (and bug fixes).
Then…
It is possible to demonstrate that using outstanding frameworks like Scrum and Kanban will improve the outcomes of a Lean Inception and the progress of the job after this team alignment and MVP planning. Whatever option you decide on, keep an eye on the workflow and know what your team members prefer to do in order to deliver highly successful products in a quick and efficient manner.

Cost of Delay: the Economic Impact of a Delay in Project Delivery
Cost of delay (CoD) is a crucial statistic in lean management that gauges the financial effects of project delivery delays. However, most businesses are unaware of how to calculate it or why they should.
Delays could cost your firm millions of dollars, depending on how big your business is.
To reduce cost of delay (CoD), you must understand what it is, how to calculate it, and how to optimize your process.
What Is Cost of Delay?
The simplest explanation you’ll discover states that the cost of delay (CoD) is the financial cost of a project delivery delay.
This can be used in a variety of situations, such as:
● Product development – the amount of money you will lose if you delay your new product’s launch.
● Software development – the amount of money you will lose if you delay the release of a groundbreaking feature that will give you an advantage over the competition.
● IT Operations – the amount of money you will lose if you fail to deliver the strategic initiative that the CEO wants.
CoD blends value with urgency, two characteristics that humans struggle to separate from one another. You need to know both how valuable and urgent something is in order to make decisions.
How to Calculate Cost of Delay?
You must estimate the profit you will make each week after putting something on the market in order to determine the potential expenses of delay.
For instance, if you work for a SaaS company and intend to deploy a new add-on feature that would earn you $20 000 each week, each week that the release is delayed will cost your business this amount.
Consider that you have three projects scheduled for the near future to provide a clear explanation of how to determine the cost of delay. While each of them will benefit your clients and your business financially, the order in which they are delivered will have an impact on both.
You must specify the so-called “CD3” value of each project in order to choose the best action plan. In other terms, the project time is divided by the delay cost.
Here is the precise calculation method:
1. Calculate the expected project’s weekly profit/value.
2. Calculate, approximately, how much time it would take to implement it.
3. Divide the profit by the estimated project duration.
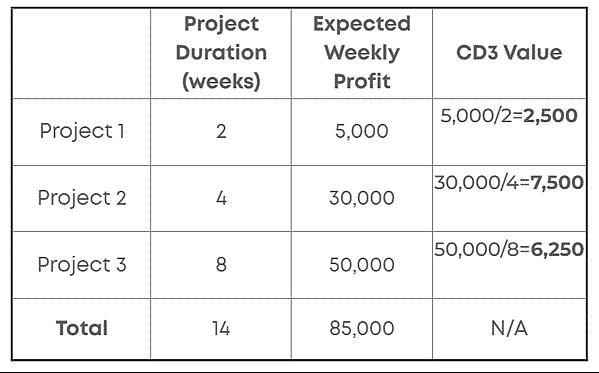
You may find the CD3 value of a project by performing this computation. You should keep in mind that a project becomes more significant from an economic standpoint the higher that value is since the project will see a quicker return on investment.
How to Prioritize Projects by Cost of Delay?
If you know how to estimate the costs of postponing the projects, you can prioritize them by following these 3 easy steps:
1. Imagine the outcomes of the scenarios
2. Compare the scenarios and analyze the influence of prioritization on the cost of delay
Visualize Project Completion
You have a total estimated weekly profit of $85 000 if you follow our example, and there are many different methods to approach the work that needs to be done. The four rationales options are:
● Sort projects in order of priority, starting with the shortest
● Sort projects according to value, starting with the most important.
● Set priorities by lowering CD3 score costs, starting with the highest one.
● All projects are processed simultaneously.
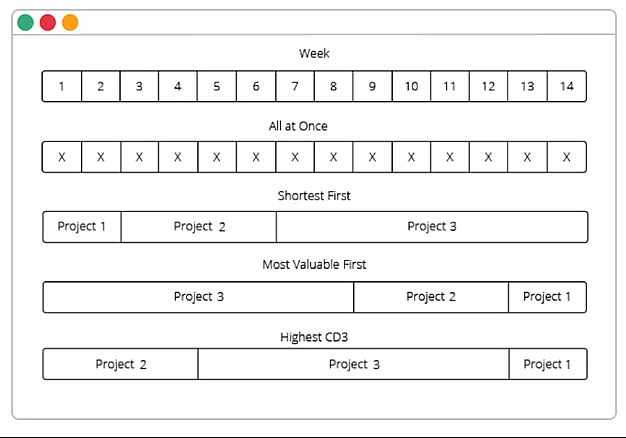
Source: Kanbanize
Before making a hasty choice, you should weigh the potential costs of delay associated with each of these possibilities for your business.
Analyze Prioritization Impact
Calculating the cost of using any prioritization system is a straightforward undertaking.
Keeping with our project example, if you predict that it will take 14 weeks to complete all three projects, you simply add the weekly delay costs for each project.
You should keep in mind that each project’s potential profit would be delayed until it and any projects that came before it were completed.
Scenario 1
According to project duration, the cost of delivery for the first two weeks is $10,000. The total cost of the delay increases to $180 000 for the following 4 weeks after the smallest project is completed. Once the second one is finished, the final one will cost $700 000 and take 8 weeks to complete. The total cost is $890 000.
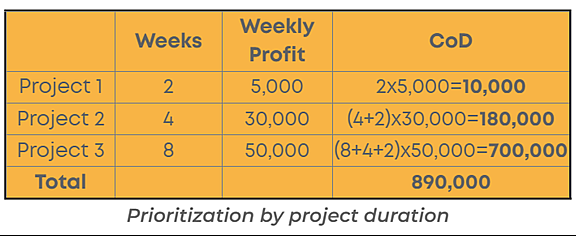
Scenario 2
Prioritizing according to project value reveals that the cost of a delay is $400 000 for the first eight weeks, $360 000 for the following four, and $70 000 for the final two. The total cost is $830 000.
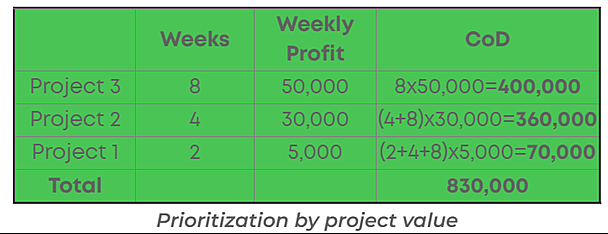
Scenario 3
The CoD for the first four weeks is $120,000; for the following eight weeks, $600,000; and for the final two weeks, $70,000 if you prioritize by CD3 value. The total cost is $790,000.
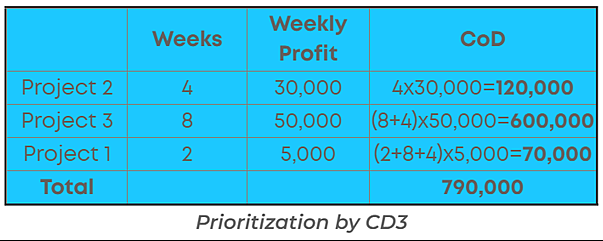
Scenario 4
It will take 14 weeks before you can realize any business value if you choose to start all projects at once and finish them all at once. Since the combined weekly profit of the three projects is 85,000, the cost of the delay in this case will be 14 weeks. Thus, 85,000 x 14 = 1,190,000 is the result.
Compare Scenarios
These four examples show that each choice has a unique financial effect on your business. When you compare the cost of delay estimates side by side, it is obvious that choosing to prioritize by CD3—which would cost you the least—is the most advantageous course of action.

Cost of Delay Types
You need to be aware of the various sorts of CoD you need to address in order to comprehend the effects a delay has on the execution of your project and to concentrate on lowering its cost.
Standard Cost of Delay
We have only discussed the common type of CoD up to this point.
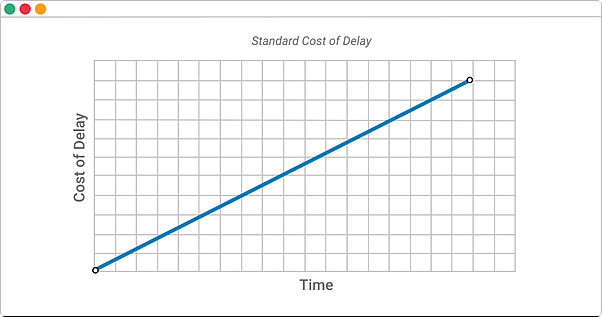
Since it is unaffected by time, it increases linearly over time and is simple to calculate.
Fixed Date Cost of Delay
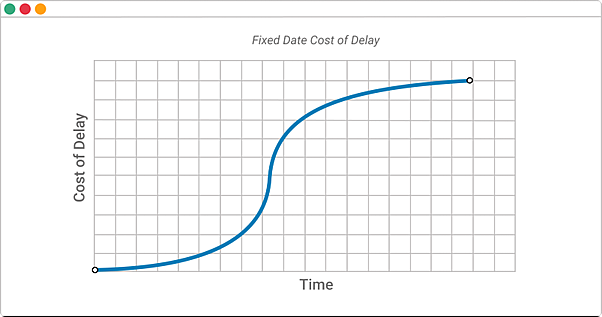
This kind of CoD is frequently associated with a SLA or a defined deadline. It is a common issue faced by IT Ops teams. By a certain time, the cost of a delay is minimal or nonexistent. After it is passed, the price increases rapidly.
For instance, the service provider must pay the client if the team fails to address a pressing issue, such as restoring a down website, within the agreed-upon time range. This might be accomplished through a refund or the payment of a negotiated price, depending on the contract.
Cost of Delay Tied to Urgency
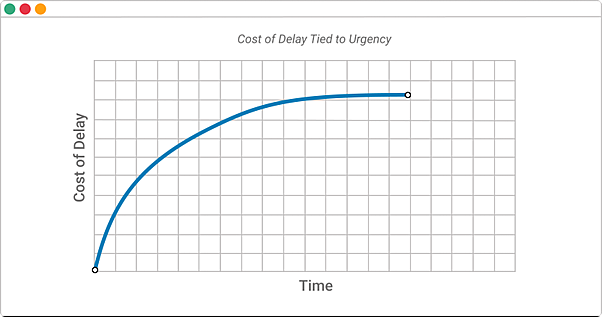
The cost of a delay that is caused by a project’s urgency increases quickly and steadily in a very short amount of time. When you are aware that your primary rival is creating a ground-breaking feature or product that will significantly alter your position in the market, that is a prime illustration of such CoD.
The cost of delay for you will increase exponentially quickly and then gradually over time if you are unable to equal or surpass their new value proposition by the time of release.

How to Reduce Cost of Delay by Implementing Lean?
Unsurprising or not, an ineffective management process is the main offender for the mounting cost of delay.
According to a study by Black Swan Farming, waiting time, one of the seven wastes of lean manufacturing, accounts for roughly 80% of the total cost of delays.
Lean provides you with a wide range of alternatives that you may use to eliminate this kind of waste and thereby lower CoD. Some of the ones that will have an immediate impact are the following:
Managing Workflow with Kanban
The Kanban method is an effective tool for streamlining your workflow and raising throughput and productivity. It enables you to see each phase of your workflow, even at the global portfolio level, as well as to keep track of project development and bottlenecks.
The so-called WIP limitations, which forbid your team from working on more than X tasks/projects at once, are among the strongest aspects of Kanban for lowering the cost of delay.
Taking Gemba Walks
The Toyota Production System, which made the Japanese automaker the largest automaker in the world, left behind gemba walkways.
They encourage managers to observe how work is completed by spending more time on the manufacturing floor, even if it is a digital one. Gemba walks are an excellent alternative to depending solely on progress reports for insight into any delays.
You should search for any flaws in the workflow while on a Gemba and inquire as to why the team is carrying out certain tasks in a particular manner.
Tackle the Root Cause of Any Cost of Delay
The only way to guarantee that a delay won’t impact future projects is to address its underlying cause.
Lean gives you two main techniques for performing a root cause analysis:
● The 5 Whys
● A3 problem solving
The five whys method can be used to delve deeply into the causes of any issue, including delays. Finding the underlying reasons is simple using this method. Simply asking “why” repeatedly will reveal the reason behind a delay.
The A3 problem-solving model is a seven-step method for creating a problem report that is clear and succinct. In the context of coping with delays, it is simple to apply. The term “A3” simply refers to the European A3 paper size, which is equivalent to the report’s dimensions of 11 by 17 inches or 29.7 cm by 42 cm.
The steps that make up a report typically are as follows:
● Background/Clarify the problem (in our case, delay)
● Assessing the current situation
● Set targets/goals
● Root cause analysis
● Countermeasures
● Implementation
● Effect confirmation/Follow-up
Since many people are involved in the report’s preparation, it is beneficial for promoting collaboration throughout the organization as well as identifying the main causes of any delays.
Adopt a culture of shared leadership
Last but not least, excessive handoffs and micromanagement frequently contribute to wait times.
Your frontline team members will be able to take responsibility for their portion of the process by establishing a shared leadership culture.
You should make your process more agile and give each employee some discretion over decisions. By doing this, you can shorten the time spent waiting for a bottleneck supervisor to approve every minor item, even if it has little bearing on the organization.
As a result, it will be less probable that lengthy procedures may cause delays.

Course Manual 4: Level the Production
The Toyota Production System served as the initial introduction to the majority of the Lean ideas that we now understand. The one of them is Heijunka.
Toyota long ago came to the conclusion that batch production is ineffective. They came to the conclusion that no business operation could fully adapt to changing client demand without creating waste owing to inconsistent productivity and overwork. For this reason, the Toyota Production System’s 12 pillars included the heijunka concept.
What is Heijunka?
Heijunka, according to the Lean Lexicon, is the process of “leveling the type and quantity of production over a fixed period of time.” Heijunka’s primary objective is to remove the likelihood of Mura and Muri through volume-based leveling and product/service type-based leveling.
Heijunka Explained
Every manager or business owner would concur that maintaining a consistent flow of work is a challenging task. This is mostly caused by the unpredictable nature of consumer demand, which is something that firms work extremely hard to meet. The ugly truth is that it can be challenging to estimate customer demand. Due to this reality, businesses might make an effort to maintain a sufficient product inventory to satisfy shifting demand. This strategy would result in the company producing more inventory than is actually required.
Say a business creates many services and products that go through the same procedure, adding to the complexity. The demand for each kind of product will probably differ. Businesses would typically make each type of product in batches in this circumstance. Usually, they would begin manufacturing the item with the most demand. The issue with this situation is that it prevents businesses from being responsive enough to the possibility that demand for a different type of product may arise at a time when they are not producing it, nor does it provide them with enough buffer to meet that need.
The Problem with Batching
Work is typically distributed unevenly when organizations batch products with varying degrees of demand, which greatly increases the potential of overtime or downtime on the assembly line. When demand spikes, your staff are overworked; conversely, when demand drops, productivity suffers. This is because of the peaks and valleys in production.
In Japanese, these conditions are referred to as Mura and Muri, respectively. The irregularities in business practices known as mura, or unevenness, cause changes in productivity. Muri, or overload, is the process by which people and equipment are put under excessive stress and pressure to do work. These two are frequently met together, thus when there is variance in the workload, there will undoubtedly be overburden.
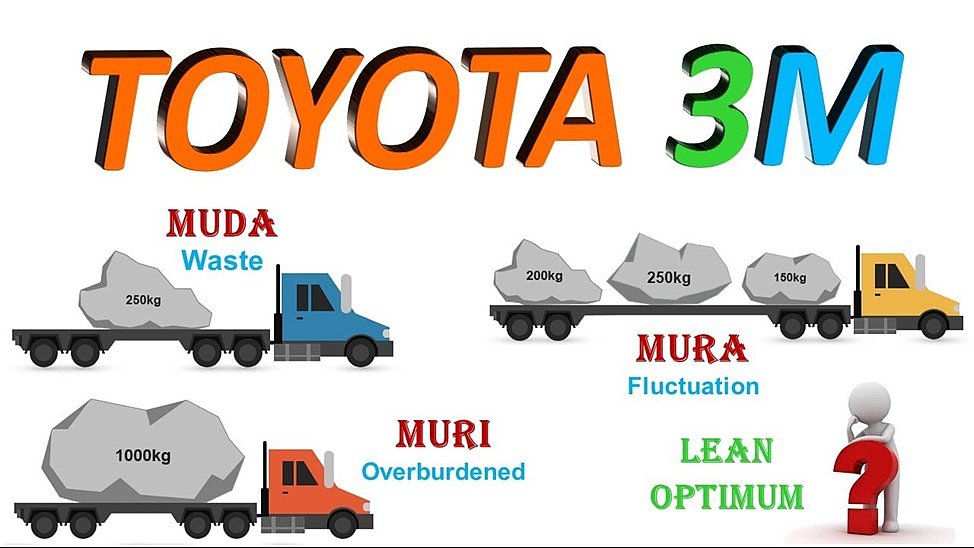
And the problem doesn’t end there.
Additionally, these two—Mura and Muri—are the primary contributors to the numerous production wastes, often known as the Seven Wastes in lean manufacturing—or Muda in Japanese. Mura and Muri’s presence permits Muda to infiltrate firm activities, increasing losses for the corporation.
So, what is an ideal production line and how do we get there?
Mura and Muri can be eliminated when organizations are able to standardize work and at the same time level the volume of production over a given period of time.
This leveling of production is referred to as Heijunka in the lean methodology.

How to Implement Heijunka
Businesses can ensure that heijunka is achieved in one of two ways: by leveling by volume or by kind.
Leveling by Volume
Let’s say a company that makes shirts gets a weekly order for 500 shirts. But the demand varies every day, which is the issue. The demand fluctuates from 200 on Mondays to 100 on Tuesdays to 50 on Wednesdays to 100 on Thursdays to 50 on Fridays.
Some business owners would plan their production to meet demand in this situation. As a result, they work twice as much on Mondays while, worse yet, working less throughout the other days of the week. Workers put in more hours on Mondays to keep up with the increased demand, which results in higher prices for firms. Workers would be idle on Wednesdays and Fridays when demand is low.
The business can level the workload to a typical 100 per day production demand to resolve this issue using heijunka. In order to make this work, the business would initially need to create 100 units as make-to-stock items to satisfy Monday’s demand. This would imply that there are 100 shirts available as buffer inventory every Monday. When production is standardized at 100 shirts per day, the corporation can scale back. How to level by volume is as follows.
Leveling by Type
Now, let’s make things a little more complicated.
Assume that the shirt manufacturer creates 4 different shirt variations. Each version also sees a range of demand. Average demand for the 500 units each week would be split between Shirt A at 50%, Shirt B at 10%, Shirt C at 24%, and Shirt D at 16%.
Traditional businesses would often start by producing Shirt A, which has the biggest demand. What is typically referred to as batching is this. With this method, we could attempt to depict the production process sequence as follows:

But what if at the time the company is producing Shirt A, demand for Shirt C becomes high? They would either switch to producing Shirt C haphazardly or lose the customer because they weren’t able to satisfy the demand on time.
Lean organizations would use heijunka to approach this situation differently. What they would do is create a product mix that incorporates making each type of Shirt at any given lot.
What would that look like?
Given what we know about the demand distribution, we’d know that for every 100 shirts the product mix is 50 for Shirt A, 10 for Shirt B, 24 for Shirt C, and 16 for Shirt D. By using heijunka, the production sequence would look something like:

We would produce a multitude of things all at once with little changeover time, as opposed to producing one sort of product in batches. This will enable the business to adjust to shifting client needs as well as balance out production efforts on the shop floor. Each sort of goods has supply on hand at all times, preventing long-term losses.
We must employ a heijunka box in order to clearly understand the production schedule and effectively convey requirements throughout the shop floor.
Heijunka Box
A heijunka box is a scheduling device that specifies the kind and quantity of goods that must be produced at predetermined intervals of time. It helps to visualize product demand and choose the best order and combination of products to be produced.
A matrix of horizontal and vertical rows makes up a heijunka box. The vertical rows denote the time period by which production is carried out, and the horizontal rows identify the type of product that must be produced. The heijunka box includes kanban cards that list the items and quantities that will be manufactured during each production interval.

Companies can quickly implement their production sequence and evenly distribute the manufacture of certain parts with the help of the heijunka box. The objective is to develop an ideal timetable that will enable the business to consistently produce the desired product mix with a minimum amount of changeover time.
The Role of Takt Time in Heijunka
The team needs to be aware of their takt time in order to implement heijunka.
Takt time is the amount of time needed to complete a product in order to meet demand from customers. The consumer purchase rate is a common name for this. They can choose the appropriate tempo or interval for their production schedule by knowing the takt time.
It is crucial that the team has made steps to lessen the inefficiencies in their workflow in order to deploy heijunka properly. Prior to implementing heijunka, bottlenecks and other pointless tasks should ideally have been resolved.
Benefits of Heijunka
It would also be helpful to consider standardizing the components that go into different goods as well as the processes used to generate the products in order to create work streams that save changeover time. Teams will benefit from applying 5S principles in this endeavor.
Simply expressed, this means that before applying heijunka, the team must have made some lean process improvements. The manufacturing schedule will then be leveled, which will enable Heijunka to further improve the situation.
A crucial component of any Lean deployment is heijunka. It enables businesses to achieve predictability via balancing product demand, flexibility through the ability to adapt to shifting consumer tastes, and stability through long-term averaging of production volume and type. With them in place, businesses can profit from:
• Lesser costs due to inventory
• Satisfied customers who receive the products that they want, when they want it
• Levelled demand for upstream processes and suppliers
• Higher reliability of machines due to levelled load
• Happier and productive employees due to removal or prevention of overburden and idle time
In fact, by using heijunka, businesses may run consistently at a level that is best for the overall success of their enterprise.

Factors to be Considered in Level Production Strategy
When implementing the level production method, organizations need to take a few things into account. These consist of:
The demand for the product
This is likely the most important aspect because businesses need to make sure they produce enough of the product to satisfy consumer demand. Customers may experience stockouts and dissatisfaction if demand is too high, while businesses may end up with excess inventory that can restrict cash flow if demand is too low.
The availability of resources to produce the product:
Businesses must make sure they have the resources (such as labor, raw materials, etc.) needed to produce the product. A lack of resources will cause a delay in the production process.
The inventory carrying costs
Businesses must balance the benefits of having inventory on hand to satisfy client demand against the expenses of maintaining the stock. Storage, insurance, and depreciation are just a few examples of the expenditures associated with moving.
Capacity expenditure
Businesses must take into account the expenses incurred during product production. These expenses may include equipment, labor, and overhead.
Production management skills
For businesses to efficiently manage the production process, qualified individuals are required. Production that is not properly managed can cause delays, mistakes, and higher expenses.
Advantages
It produces a product that is consistent.
Use of the level production method has several benefits. Businesses can guarantee that the quality of their product is consistent by producing a certain quantity of items at a fixed rate.
It achieves economics by scale.
By producing a greater volume of a good or service, a level production approach can assist a corporation in achieving economies of scale. This may result in lower per-unit costs and higher profitability.
Manages workforce.
A corporation can manage its staff more effectively with the aid of a level production strategy. For instance, the industry can schedule employees in shifts when goods are produced in huge quantities to guarantee that someone is always available to generate the goods. That might result in more effectiveness and production.
It is efficient and smooth.
The level production strategy’s efficiency and smoothness are additional benefits. This kind of production approach enables better control over product quality while ensuring a streamlined and effective production process.
It reduces costs.
The level production approach might assist companies in cost-cutting. This is so that a given volume of product can be produced with less resources.

Disadvantages
A few drawbacks of the level production method are as follows:
It can lead to stockout.
The level production strategy’s potential to cause stockouts is one of its key drawbacks. This is so that enterprises can meet demand regardless of how many things they have to make. Businesses could not have enough inventory to meet demand if customer demand rises.
It can lead to overstock.
The fact that the product is produced even when there is no market demand for it is another drawback of this technique.
It can be inflexible.
The level production strategy’s potential for severity is another drawback. This is so that companies may commit to manufacturing a set quantity of product, regardless of changes in consumer demand. Because of this, it could be challenging for businesses to adapt to market developments.
It can be costly.
The level manufacturing approach could also be pricey. This is so that companies can make the product, which requires the appropriate resources (such as labor, materials, etc.). Companies also need to think about the expenses of keeping inventories.

Marks and Spencers – failure to stock enough of popular demand
Marks & Spencer admitted failure to stock enough clothes in popular sizes during autumn of 2019. They called it a “challenging period” for their clothing and homeware business. After-sales falling 2.1% in the space of a few months the brand quickly released this inventory oversight was costing them almost £5 million. As well as poor availability of stock, the brand also admitted to too much stock and markdown on their clothing line.
Ralph Lauren – inventory cuts and restructuring
In 2016 Ralph Lauren appointed a new chief executive – Stefan Larsson. Stefa’s first task? Cut costs in inventory and warehouse management. That meant a ‘refocus’ on the brand’s best-selling labels, cutting it’s different layers of management and closing stores. The result of such dramatic changes? Profits plummeted 50 percent in the two years to follow. The brand had an inventory lead time of fifteen months which kicked up several issues. Firstly, the company couldn’t be responsible when it came to being reactive with trends. Secondly, holding on to so much excess stock was expensive. Third, Ralph Lauren’s inventory grew by 26% over three years, but sales only grew by 7%.
The end result? Lots of discounted stock, lots of promotions, and a desperate need to shift shock.
Conclusion
A level production plan maintains a steady level of output production over the course of each cycle. The employment of a level production strategy has both benefits and drawbacks, which we covered in this course manual. This kind of strategy is frequently combined with chase production.
The key benefit is that it can contribute to cost reduction and improved productivity. The biggest drawback is that rising demand may result in stock shortages. Overall though, enterprises may find a level production approach to be a useful tool in their IT transformation.

Course Manual 5: Process Optimization – Lead & Cycle Time
Life is full with ideas that, while seemingly similar, are fundamentally different. Given the large stakes involved, differentiating between them is quite critical. For instance, high school children frequently struggle to understand the distinction between notions like energy and power, whereas adults frequently struggle to distinguish between the flu and the common cold.
There are two such phrases that are used in some Agile approaches, such the Kanban methodology, but they are sufficiently close to one other to be confusing. There is no denying that there is a significant overlap between lead time and cycle time. Additionally, both ideas have the same conclusion. But what they stand for is false.
Since lead time and cycle time are very relevant elements that may be controlled, it is crucial to understand them. Doing so will increase your production as a whole.
Let’s first clarify what lead and cycle time are and how they differ from one another before discussing how to manage them effectively for greater efficiency.
What is Lead Time?
The time between when a task enters the work system and when it is finished is the best way to define lead time. The amount of time it takes for an input to pass through all of the processes and arrive at the destination is known as the lead time. The total amount of time it took for the assigned job to get to the right-most column in a Kanban system.

To understand it in a simpler way, imagine ordering a pizza. The amount of time it takes from the moment you ordered the pizza to when you get it delivered is defined as the lead time. So, if you placed the order at 8 and got the pizza at 8:30, your lead time would be 30 minutes.
What is Cycle Time?
Cycle time shows how much time the team spends working on a prioritized assignment. Cycle time begins when any team member begins working on a job and transfers it to the “in progress” column. It continues until the task is finished.

In keeping with the pizza comparison, the lead time starts as soon as you submit your order. But the order hasn’t yet been delivered to the kitchen. The cycle time only begins when the cook begins preparing your order. Your cycle time would be 20 minutes if the preceding section’s pizza order took ten minutes to process and was delivered to the kitchen at 8:10.
Why Should Agile Teams Care About Lead Time?
You’re probably not as agile as you believe if you’re not keeping track of lead times. However, there are a staggering number of metrics to monitor, and almost everyone will tell you that a particular measure is the most crucial and that if you aren’t tracking it, you aren’t as agile as you think you are.
Because of this, we’re not here to advise you to prioritize One True Agile Metric over all others. Instead, each indicator serves as a crucial piece of the production pipeline puzzle. If you’re not keeping track of lead times, your development process may not be as complete as it could be.
What exactly is lead time, and why is it important?
The lead time is the amount of time between when a task is created and when it is finished.
You’re only getting a partial picture of agile if you’re only concerned with cycle time, which is the amount of time it takes from when your team begins working on a product until it is delivered to the end user.
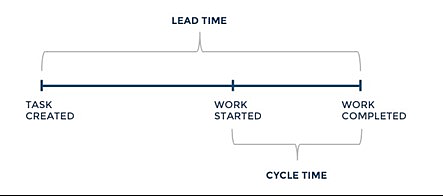
Source: www.extremeuncertainty.com
In other words, lead time measures the amount of time it takes from the user’s perspective for a feature to get from “requested” to “complete.” Cycle time, on the other hand, is a “developer point of view” metric that calculates how long it takes a programmer to complete a task before delivering it.
Consider it like ordering a pizza: the clock on lead time begins when you place the order and it ends when the pizza arrives at your door. However, cycle time only accounts for the period between when the cook begins to prepare your order and when it is placed in your hands.
So why is it harmful to merely track the cycle time (or lead time) of your pizza rather of the entire order pipeline? Since you’ll either receive your pizza late or not at all (which would be a true tragedy) if there’s a problem between the time you place your order and when the dough is thrown. And no matter how quick the pizza makers (developers) are to throw the dough (code), these problems will ruin your experience. We could continue making pizza and software development comparisons in this sentence all day, but we should probably move on.
This might have happened for a variety of reasons, including a malfunction with the pizza shop’s online ordering system, a message that distracted the adolescent processing your phone order, or the possibility that your order got lost during the lunch rush. The owner of the pizzeria, or you in the case of your own non-pizza-related enterprises, will undercut all the hard, efficient work of their cooks if they don’t track lead time because they won’t know what’s delaying the process and aggravating consumers.
Rephrased in less offensive language: Your jobs can be taking too long to be accepted and prioritized, stagnating in your backlog, or sitting too long in your queue. These limitations might increase your budget, cause friction in your otherwise agile workflows, and postpone the development of important improvements or issue fixes. Long lead times can make your clients wait longer to receive the functionality they require.
But if you’re not keeping track of lead time, you’ll never know:
• Lead time enables you to determine whether you are truly agile.
• Lead time reveals if you’re practicing agile overall, or if you’ve just used the methodology when building your code.
You need to clear a development pipeline that requires moving from point A to point B and then C. In the past, there were obstacles at every step. Cycle time simply reveals what’s slowing things down between B and C, but you need to clear away everything that’s in your way along the entire pipeline. Because you aren’t zoomed out far enough, you can still see that you are blocked between A and B.
Measuring lead time corrects this by enlarging your perspective and comprehension of your development pipeline to identify the bottlenecks that are wiping away all of your developers’ agile work.
Working agile typically entails using a framework like Scrum to divide your work into manageable sprints that are carried out using sprint planning, stand-ups, reviews, and retrospectives.
If your cycle times are low—that is, your developers are working rapidly and agilely—but you’re still seeing problems, such users having to wait too long for the deployment of crucial improvements, the knowledge gained from lead time is very important.
You should map out your value stream to determine the precise areas of development that are holding you up before you start calculating lead time. Scheduling, which occurs before the cycle time clock starts, may be your restriction if you have a small staff and a lot of user requests. Or, if you’re used to having less-important changes pushed back in favor of urgent requests for modifications, your limitation can be backlog management. You might be able to find your restriction by creating a value stream map, and measuring lead time will show you how well you’re doing in removing that constraint.
You can ensure that you’re agile all the time, not just when you’re writing code, by reducing your overall lead time and effectively managing work throughout your development pipeline.

Your development pipeline can be optimized with lead time.
Lead time gives you information to establish benchmarks for the time it takes for your work to complete from beginning to end.
You can identify which phases of development take the longest or where work is getting overlooked by using your lead-time data. You can use this information to determine where your process needs to be improved and what ongoing issues are holding up your development pipeline. You can then experiment with modifications, like adding extra resources or dividing tasks up, based on these findings, to reduce lead time in the future.
If you’re using Scrum, your lead time should match your sprint schedule, which is one to four weeks. There is a problem to be found when your lead times routinely fall short of your sprint schedules.
There are a number of issues that can cause high lead times, but some of the most common include:
• Inefficiencies in backlog management: When new tasks come in, they’re often relegated to a team’s backlog. Without a clearly defined and measured process for handling how work is released from this queue, requests can be relegated to the sideline.
• Delays with hand offs and manual procedures: Organizational silos can cause high lead times because everyone is relying on their own systems of batch-based approvals.
• Holdups during approval: While the approvals process originally served to reduce risk and provide quality assurance, the extra work involved in getting sign-off for each new feature slows down lead time.
• Issues with environment management and provisioning: If your software developers are left waiting for environments you’ll see lead times rise and negatively impact release schedules.
• Manual software deployments: Where else could you potentially automate your processes?
• Manual software testing: Manually testing your code base is a slow process no matter your project size.
Any one of those delays will cause your project to take longer to complete. You can learn which touchpoints generate the greatest friction and why by keeping track of lead time.
Consider setting priorities and controlling your backlog. When users ask for a feature or when your team discovers a new feature or capability is required, you add a feature request to the queue. However, depending on the urgency of the modification request and the tasks that arrive at the same time, work may remain in your backlog for days, weeks, or even months.
You may have a capacity problem if, as part of your lead time measurement, you observe that your backlog expands over time despite regular activity by developers.
When you monitor your queue and keep things moving forward, you may avoid the possibility of work being forgotten or neglected.
Lead time will reveal and help you understand outliers
When you monitor lead time, you’ll learn not just how your projects develop from beginning to end but also the exceptions to these generalizations. This is due to the fact that lead time provides a complete view of not just the steps that each task must take before being worked on and deployed, but also any unique characteristics or task types.
In an ideal scenario, you would be able to anticipate each request made by your end consumers and produce the ideal product the first time. We don’t, however, live in an ideal environment, and end-user requests are brought on by a wide range of diverse situations. Users seek adjustments of this nature frequently, but not always.
Use lead time and other agile metrics to get the whole picture
Lead time is a crucial measure to comprehend and monitor in order to make sure that you are implementing all of your teams’ and users’ good ideas, but it is not the end all be all of tracking agile metrics. To acquire a high-level, comprehensive perspective of your manufacturing flow, combine lead time and cycle time.

What is cycle time?
Cycle time, which is calculated from the beginning of the first task to the conclusion of the last task, is the real amount of time spent working on creating an item or rendering a service. Both value-added and non-value-added time are included in cycle time. The essential term in the definition is “actual,” as many businesses use “cycle time” to refer to the anticipated amount of time it will take to produce an item, even though these two timeframes are frequently not the same. People frequently confuse other time concepts, such lead time or takt time, for cycle time, which further complicates what should be a straightforward idea.
Cycle time’s mathematical foundations are simple to comprehend. Add the time the first task began to the time the last task was completed.
Cycle Time for single piece flow item = Finish Time – Start Time
The cycle time for making a toaster, for instance, is three hours if the first step in manufacturing one begins at 8:30 in the morning and the finished toaster is wrapped and prepared for shipping at 11:30 in the morning.
Cycle times can also be used to describe distinct steps in a process, with one cycle time being used for assembly, another for testing, and a third for packaging.
To calculate the cycle time per part when working with batches of items rather than a single piece flow, just multiply the total number of parts produced by the production run time.
Cycle Time = (Finish Time – Start Time) / Units Produced
Say you’re working on understanding the cycle time for painting the toasters from the earlier example. The toasters are painted by an automatic robot arm that paints four toasters at a time in a wave movement. Afterwards, the toasters are placed in a heating chamber to quick-dry the paint.
From the beginning of the painting to the completion of the paint drying in the chamber takes 40 minutes, but the cycle time is not 40 minutes since multiple products were worked simultaneously.
Divide the total parts produced, four, into the production run time, 40, to arrive at an actual cycle time of 10 minutes per part.

Benefits of attending to cycle time
The formulas are simple and clear. Knowing what to do with your cycle time information is where the actual value lies.
Improve timeliness
Understanding your product’s or service’s cycle periods will help you decide whether you can deliver them in a timely way that satisfies your customers’ needs. Takt time and cycle time are frequently discussed together and frequently used interchangeably. Takt time, as opposed to cycle time, is the length of time it takes to produce just one product in order to meet customer deadlines. As a result, your system must be configured so that your cycle time is lower than your takt time in order for your business to offer on-time delivery.
Set up your system in an ideal way
Knowing your cycle times enables you to set up your operations correctly. It makes it possible for the factory floor to be set up properly in a manufacturing environment. Understanding how many machinery, tools, and people are required is crucial. You can adjust the line if you find that your cycle time is currently longer than your takt time. The cycle time can be lowered and eventually brought under your takt time by adding the appropriate employees, equipment, and more tools.
Identify possible system improvements
Cycle time is another tool used to determine whether the system can be made better. Changes in the environment may cause the cycle time to increase, even if it is less than the takt time. You can spot unexpected cycle time increases caused by previously unanticipated changes by routinely monitoring your cycle times. Perhaps there is a material shortage that contributes to the holdups, or a machine experiences an unplanned stoppage that lengthens cycle time. Cycle times must be closely monitored to ensure that customer demand will be satisfied and to spot any cost-cutting opportunities. Many times, a process that moves more quickly can be managed for less money.
3 cycle time best practices
• Keep in mind to distinguish between takt time and cycle time. This error is commonly made by professionals. It has been known for businesses to claim that their processes have a takt time value when in reality they do not. Takt time depends on client demand and the amount of time that is available, and for many products, it is constantly changing as the demand from the market shifts. System performance affects cycle time rather than takt time.
• Be careful while using automated data collection methods. Waste not, want not. Many systems cannot be trusted because of subpar data collection procedures, even though some are highly accurate. To get accurate data on real cycle times, go to the location where the work is done and conduct a time study. The times will not only accurately reflect reality, but you are also likely to discover other problems with your process that require correction.
• Cycle time should not be regarded as a constant. Too many experts get caught on how long the process should take without comprehending that, even when procedures are designed to fulfill a cycle time goal, variables like supply chain problems, equipment breakdowns, staffing shortages, etc., will always keep cycle time a moving target.

How DBS Bank uses cycle time to constantly improve their services and stay competitive
The Singapore-based DBS has taken the lead in modernizing its operations through cycle time data, whether it be in consumer banking, trade finance, audit, or HR, in order to make more informed decisions, identify trends, and remain competitive.
“Over the past few years, DBS has been embracing various forms of digital technology to help simplify and improve the customer experience,” says David Gledhill, group chief information officer at DBS. “Some examples of these technologies include cloud computing, artificial intelligence and data analytics.” Big data technologies with open source programming and integrated analytics allow the bank to glean stronger insights to improve decision-making and have a deeper understanding of customer behaviours and transaction flows.
Challenging norms in the consumer space
When it comes to employing data analytics to boost consumer banking productivity, DBS has gone above and beyond. Big data’s radical transformation of the bank’s ATM infrastructure in its native market serves as one prominent example.
With more than 25 million transactions per month, the bank’s ATM network is among the busiest in the world. By using data analytics, DBS was able to almost eliminate cash withdrawals by comprehending the patterns of ATM cash flow and predicting when cash would run out. The bank’s outsourced cash replenishment service being phased out has been a side effect. The advancement of ATMs has reduced time spent using ATMs by roughly 25%.
Trade Finance taken to the next level
The focus on big data has also reduced documentation errors in trade finance. Trade finance controls are dependent on the bank’s knowledge of its clients, the nature of the transaction, documentation financing, and credit monitoring in a typically paper-intensive sector involving manual operations.
DBS has partnered with Cloudera, one of the top providers of data management and analytics platforms, A*Star, Singapore’s largest ICT research organization, and the fintech startup to eliminate trade abnormalities. They have developed a ground-breaking program to identify unusual trade finance transaction activities as a result of their collaboration. The system, which is a first for a Singapore bank, uses data analytics to identify suspicious trade flows and identify fraud anomalies through transactional trends. It uses plenty of different kinds of commerce data, like shipping data.
Applying big data to Audit
DBS is able to identify high-risk branches and identify branches with weak controls by integrating big data innovations into the bank’s auditing operations. The bank created a mechanism to identify parameters related to mismatched cash balances against branch transactions using data spanning more than four years. These findings assist in alerting the teams so that they can intervene early and enhance staff training. In order to do this, 15% of branch audit procedures have been automated.
Data-diving in the HR pool
For the purpose of analyzing trends and identifying risk factors for early employee attrition, the bank established its Human Capital Analytics team within HR. Poor performance, taking medical absence within the first few months of employment, and skipping training sessions are a few of these contributing reasons. Managers are then prompted by the statistics to contact these workers early and offer extra coaching. The attrition rate was reduced by this approach from 27% to roughly 18%.

Course Manual 6: Process Optimization – Throughput
Throughput in Kanban refers to the volume of work completed within a predetermined time frame. In a nutshell, throughput is a measurement of the amount of work or advancement you produce by the project’s finish. Any incomplete work is not counted in throughput.
You must be able to analyze team performance in order to measure it. You may make data-driven decisions by assessing your team’s performance and determining its ability to deliver. In this situation, throughput is important.
Kanban throughput information is typically shown as a bar chart or histogram. The throughput chart will showcase the actual throughput on a daily, weekly, or monthly basis, helping the team and stakeholders see the actual throughput data. The throughput data’s frequency of distribution is made more clear by histograms, which also show the data’s skew, spread, mean, median, and mode as well as how they change over time.
Why do Kanban metrics matter?
One of the simplest ways to evaluate and manage your workflow is to use the Kanban method. It’s so easy since there aren’t any major structural adjustments or initiation rituals needed to start. Metrics are crucial to Kanban because they aid teams in identifying process problems.
Agile metrics give teams the ability to pinpoint process flaws and make the required modifications to streamline workflow. Teams have the option to monitor and enhance their performance over time with the help of throughput metrics.
For many teams, throughput is a good option for various reasons, including:
• Gauge team performance: Throughput histograms assist teams in seeing patterns in the execution of tasks across time. It may indicate that there is an issue with your team if your team notices a decline in the amount of jobs delivered. Your team is doing well if task completion rates are rising or remaining stable.
• Improve collaboration: Throughput motivates team members to cooperate. Teams can find chances for improvement by using throughput.
• Predict performance: Throughput tracks projects using metrics. With the aid of that information, you may enhance client interactions and make precise forecasts regarding a delivery.
Why throughput is an effective metric.
Teams can get reliable data collected over time through throughput. It gauges how well a group performs over time. Teams can keep a consistent workflow by monitoring throughput using a chart. They can assess and analyze their throughput on a daily, weekly, or monthly basis. Your procedure is more predictable if the values are more similar.
In one example, a team delivered eight, 12, ten, and ten cards over four weeks. As a result, the average throughput cards would be ten cards per week. By using these metrics to track their throughput, teams identify areas to improve in their process.

What is throughput’s relationship with WIP and cycle time?
Understanding throughput, Work in Progress (WIP) ceilings, and cycle time is crucial. The output of a team represents its performance over time. Response time is a gauge of responsiveness. WIP limitations are the maximum number of tasks that can be active at once.
Cycle time, throughput, and WIP are all related. One change in one will have an impact on the others, if not all of them, according to Little’s Law, an equation that describes how they are related. Since it functions without the team having to undergo significant adjustments, this law only holds for teams with established systems.
Little’s Law: WIP = Throughput * Cycle Time
Teams with reliable throughput have decreased their WIP, according to Little’s Law. They shorten their cycle times as a result, which speeds up delivery. Metrics are used by Kanban to assist teams find problems more quickly and produce high-quality work.
Here is a breakdown of how these Kanban metrics work together:
• Throughput is based on the number of cards delivered within the period.
• Cycle time calculates the time that the team works on the card until it’s delivered.
• The WIP limit does not allow new tasks to begin until the previous task is complete.
Together, these measures can improve teams’ productivity, quality of work, and customer happiness. The foundation of Kanban is the idea that teams perform better when they focus entirely on one job. Because of this, throughput, WIP, and cycle time measurements are required to finish tasks quickly and provide high-quality work.
How to measure throughput to make your team more efficient.
A throughput histogram depicts the frequency with which a team reaches a particular throughput over a given period of time. You should be able to gather some fundamental information from this histogram, such as the median value, spread’s width, and distribution of the completed job.
Monitoring throughput allows you to predict future performances with accuracy. In other words, you can precisely predict how long it will take to complete a project based on prior performances provided you have a throughput histogram.
Increase efficiency with throughput.
Better analytics allow teams to identify inefficiencies and make changes to their workflow. Based on the projects they have completed, accurate metrics enable teams to set appropriate expectations for future timelines.
Throughput supports teams in producing high-quality work within predetermined deadlines, enhancing long-term planning, and improving customer connections.
Example of Throughput
Bicycles are produced by ABC Cycles. The business has systems in place for maintaining the machinery used to build motorcycles, and it plans production capacity based on planned employee staffing and machine maintenance schedules.
However, ABC must also get in touch with its suppliers of metal bike frames and seats to request delivery of these part when it needs them for production. The company’s throughput will be reduced if the parts don’t show up when ABC Cycles needs them.
Moving on, ABC Cycles starts producing various bicycle models. Both road and mountain bikes share the same frame and seat as they begin manufacture using a joint production process. However, as the process progresses, the production separates since each bike model utilizes unique suspensions, brakes, and tires. Since ABC must take into account production capacity and supply chains in both joint and independent production processes, this makes production more difficult to manage.
Let’s assume that ABC Cycles has 200 bikes in stock and that each bike takes five days on average to produce. The business’s throughput would be:
T = (200 bikes / 5 days) = 40 bikes a day.

Evaluate Process Performance: Throughput Histogram
Throughput is the primary gauge of workflow effectiveness in the Kanban Method, as was previously discussed. Throughput just gauges what has been completed, regardless of the number of jobs being worked on.
Although kanban throughput is frequently shown as a bar chart, a throughput histogram will provide you far more insight into your process. The frequency distribution of your data is shown through histograms. You can establish your team’s capacity, measure your workflow performance over time, and evaluate your process efficiency by learning to read these charts.
The Kanban throughput histogram
One of the most precise ways to monitor workflow performance is average throughput, and the best way to visualize this statistic across time is through a throughput histogram.
Your data’s distribution and form are displayed using histograms. The ability to track fundamental dataset characteristics, such as the median value, the spread’s width, and the distribution of your team’s assignments overall, is their use’s biggest advantage.
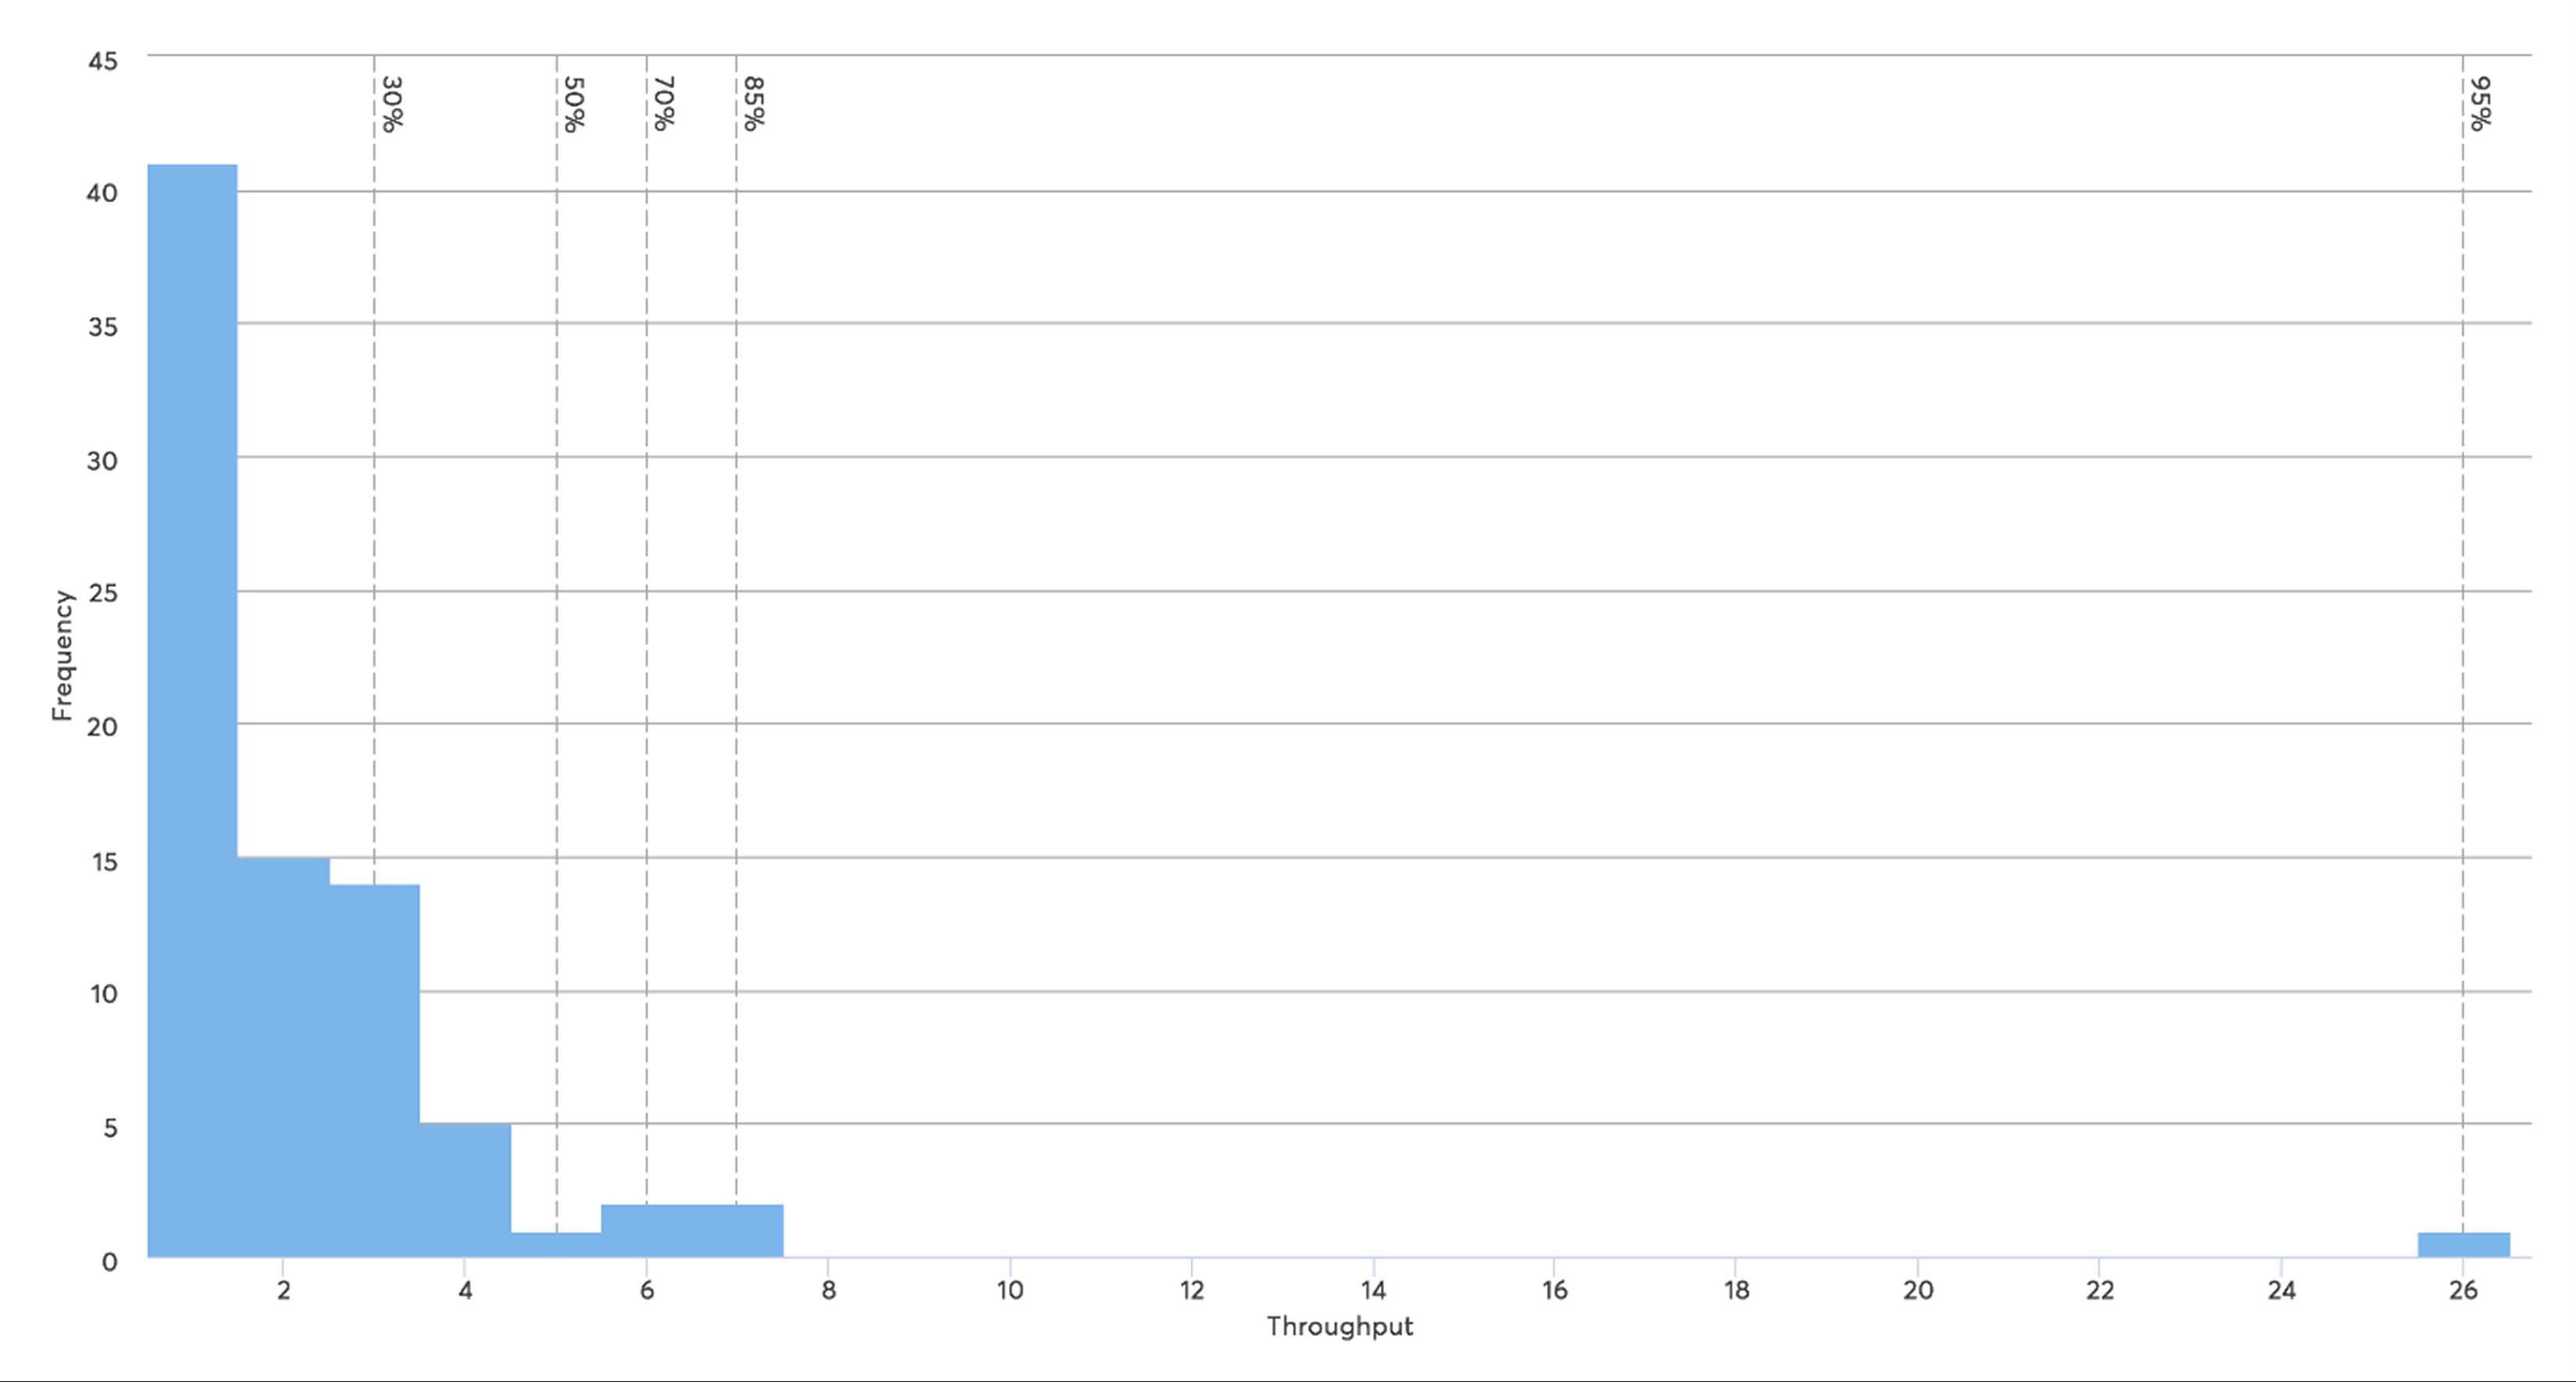
You can see from the throughput histogram how regularly your team produces outcomes. The throughput (number of jobs performed) is shown on the horizontal axis, and the frequency (number of days) is shown on the vertical axis. According to the graph above, there is a 50% chance that this team’s future throughput will be 5 items/day or less. The vertical percentile lines show the likelihood that throughput will be replicated in the future. The likelihood of the throughput being less than 7 items per day is 85%. Service level agreements can be defined using these variables.
Plotting a throughput histogram
Let’s see how to plot a histogram to display a team’s throughput over the course of a month. The team’s results are shown in the following table:

It is challenging to understand the numbers with such a straightforward table. The two zero values that appear every seven days—weekends—do stick out, though. Trying to visualize this data as a scatterplot
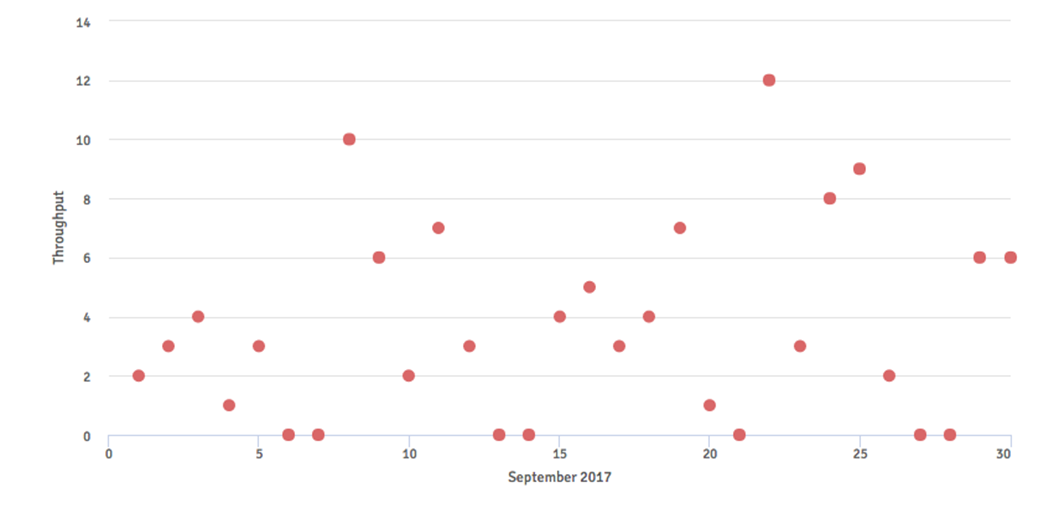
This is more logical because it’s clear how the team’s throughput has changed from day to day throughout the month. However, it is difficult for us to determine our team’s average throughput or identify trends over time.
Let’s plot this data as a histogram. Count the days that have a specific throughput first.

Let’s visualize this data as a histogram.
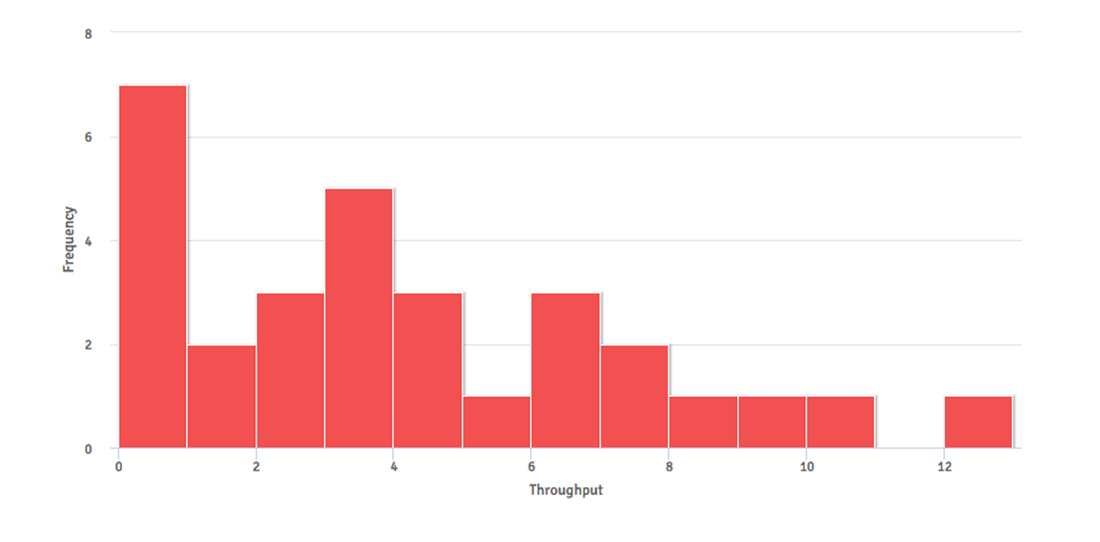
may you identify any insightful inferences and beneficial conclusions that may be made from the histogram that we have now?
How to read throughput histograms
Average throughput calculates the typical amount of work completed over the course of a week or month in order to track trends over time. This value can also be used to generate a preliminary estimation and commit to the number of things a team can provide within a specific time frame.
The most crucial measure we want to identify is the monthly average throughput of our crew. There are three methods for calculating averages; although they can yield the same result, they typically differ and have slightly different meanings.
An important aspect of a typical throughput data set to keep in mind is the occurrence of zero values on non-working days, such as weekends, federal holidays, vacations, etc. This may give the impression that your team is less effective than it actually is.
The average throughput estimated with and without weekend values is nevertheless important to know. While taking these out will result in a more realistic throughput average for the usual business day, including the weekend lows will give you an accurate throughput value to compute over longer periods of time.
• Mode is the easiest average to calculate – The mode in this situation is a throughput of 0. These 0 values are weekends, which aren’t representative of a typical workday, as we stated previously. Weekend values are eliminated, yielding a mean of 3.
• The median displays the data set’s middle value. For instance, the median of the values (1, 2, 4, 7, 8) is equal to 4. This subsequent set’s median (3, 3, 4, 5, 5) similarly has a 4. The value between the two center integers is used if the data set is an even number. Six tasks per day are the median in the aforementioned histogram.
• Mean is the average calculation that you are most likely to be familiar with. To do this, add up all the values and divide them by how many instances there are in the data collection. With 111 work items performed throughout the course of the full month and 30 occurrences (days) in the set, there were 3.7 tasks completed on average every day.
What use does it serve to compute the various averages? Different data sets may be better able to forecast the central tendency of the set depending on its range. The real average throughput of the team is reflected in this core tendency or central value.
An excellent method for performing approximate estimations is average throughput. But many teams advise utilizing the Monte Carlo approach for longer-term estimates that are more precise.

What is a Monte Carlo Simulation and How to Use it
Have you ever been in a position where prompt, accurate responses were required, such as when a certain activity was expected to be completed or how many tasks were expected to be completed by date X? If the answer is “yes,” you may find it advantageous to use a Monte Carlo simulation to provide your clients, project stakeholders, and team members with data-driven feedback.
Let’s quickly define simulation before we delve into what Monte Carlo Simulation is all about and how to use it in practice.
A simulation can be defined as a time-based imitation of how a real-world process might operate. The usage of models, which in turn reflect the key components of the process under consideration, is a crucial component of simulations.
When the real process cannot be fully incorporated for a variety of reasons or when the real process is not entirely available at the time we are researching the process (i.e., real variable values and outputs), simulations are frequently employed.
You may be wondering what a Monte Carlo simulation is at this point. In the following part, we look at that.
What is Monte Carlo Simulation?
A statistical method known as Monte Carlo simulation uses computer algorithms to anticipate the likelihood of various scenarios while concentrating on the continuous repetition of random sampling to identify potential process outcomes. To put it another way, Monte Carlo simulation accounts for the likelihood of uncertain outcomes that are challenging to anticipate due to the interference from input random variables. Theoretically, problems with a probabilistic background can be solved using Monte Carlo simulation.
Numerous domains of knowledge, including the physical sciences, engineering, applied statistics, finance and business, law, climate change, project management, and many others, use Monte Carlo simulation. This simulation is very helpful for systems with lots of inputs that have a lot of uncertainty.
To further comprehend the idea behind the Monte Carlo simulation, let’s look at an example. To start, we look at a process’s straightforward model representation, as seen in the image below.
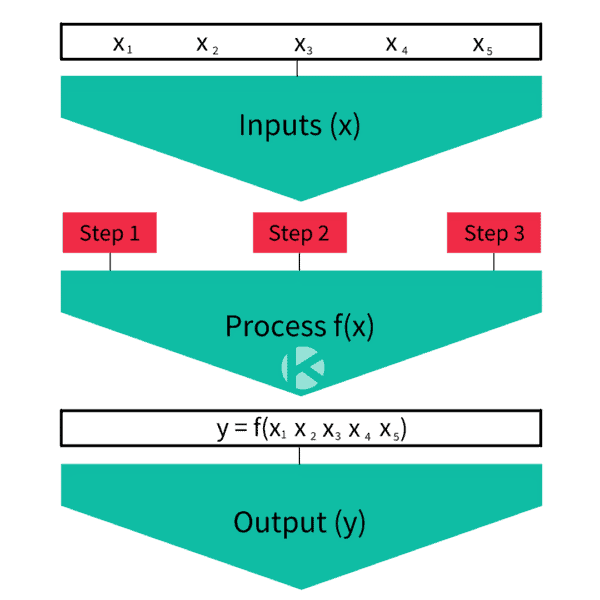
A process essentially consists of a number of steps intended to deliver a good or service as requested by the client.
Three components make up a process: inputs (x), process steps (f(x), and output (y). We have five process inputs (x1, x2, x3, x4, and x5), one process output (y), and three process phases (Step-1, Step-2, and Step-3) in our example, which is depicted on the above picture.
The process output (y) can be thought of as, for instance, the finished product supplied to the client, whereas the process inputs can be thought of as the resources we use in the process with the goal of obtaining a specific output (y).
Any change in the inputs of the process causes variation in the output (y). Therefore y= f(x), in other words, the process output (y) is a function of the process inputs (x).
In general, if we maintain consistency in the process inputs, consistency in the process output is also predicted (i.e., modest output changes) and may be evaluated simply. In other words, the same initial inputs will result in a comparable ultimate output, which could be a good or a service.
Let’s assume that the inputs to each operation now range inside a predetermined range of likely values. It is therefore reasonable to anticipate that the process output will differ in this instance. Additionally, evaluating the process output will get more difficult as we continue to add increasingly diverse inputs to the process. You should think about using the Monte Carlo simulation to help you forecast the outcome of such complex processes.
How to Use Monte Carlo Simulation?
Project managers frequently utilize this simulation in the field of project management and Lean Agile techniques to evaluate, for instance, project duration risk and occasionally also budget difficulties.
From this point forward, we’ll use project duration prediction as an example of a Monte Carlo simulation.
Assume for a moment that the various project tasks represented by the process stages in the above diagram are process steps. The first step is to identify each of the three tasks (i.e., tasks 1, 2, and 3). The range of potential durations for each work, as well as the range of potential probability, must then be estimated. Therefore, we must specify a probability distribution function (such as a normal distribution, etc.) for each task in order to inform the range of potential programmed deviations from the primary estimate.
The full range of potential task lengths will be used in the Monte Carlo simulation, and the results will be presented as a histogram.
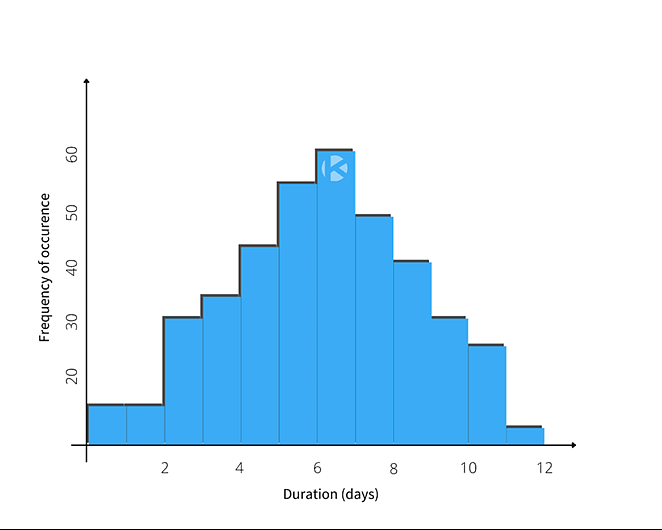
We can see the data distribution, data location (through the average task length), and data variation (also known as standard deviation) using the histogram that is displayed above. It is feasible to determine the probability of occurrence for each unique value of task duration by taking into account that the data duration of the tasks follows a statistical normal distribution.
The Monte Carlo simulation has thus far in our example been based on the estimations we supplied earlier and the presumption that these values are reliable. The entire simulation would suffer if we occasionally misjudged how long the tasks would take to complete.
Therefore, it is advised to use actual process data as the foundation for Monte Carlo simulations. To do that, you might consider tracking Kanban metrics throughout the entire process. Lead time, cycle time, throughput, and task age are a few examples of the key Kanban metrics that may be deduced from the process. These Kanban metrics enable data-driven forecasts to be grounded in reality and assessed using the process performance data, which can support ongoing process improvements.

Cumulative Flow Diagram
Do you frequently fall short of your SLA? Before committing to deadlines, do you have any second thoughts? Have you encountered difficulties providing value at regular intervals? The use of a cumulative flow diagram in your process will undoubtedly be advantageous if the response to any of these questions is yes.
Adopting a Kanban board and visualizing each stage of your process is a solid initial step, but you must realize that these two components by themselves will not be enough to produce a reliable process.
Thankfully, your project management toolkit may contain a cumulative flow diagram that will tip the scales in your favor.
What is a Cumulative Flow Diagram?
One of the most sophisticated Kanban and Agile analytics charts is the cumulative flow diagram (CFD), sometimes known as a CFD. It offers a brief visual representation of the three key KPIs of your Agile flow:
• Cycle time
• Throughput
• Work in progress
Its main purpose is to show you how stable your flow is and help you understand where you need to focus on making your process more predictable. It gives you quantitative and qualitative insight into past and existing problems and can visualize massive amounts of data.
How To Read a Cumulative Flow Diagram
The chart tracks the total number of work items in the columns of the “In Progress” section on your Kanban board each day.
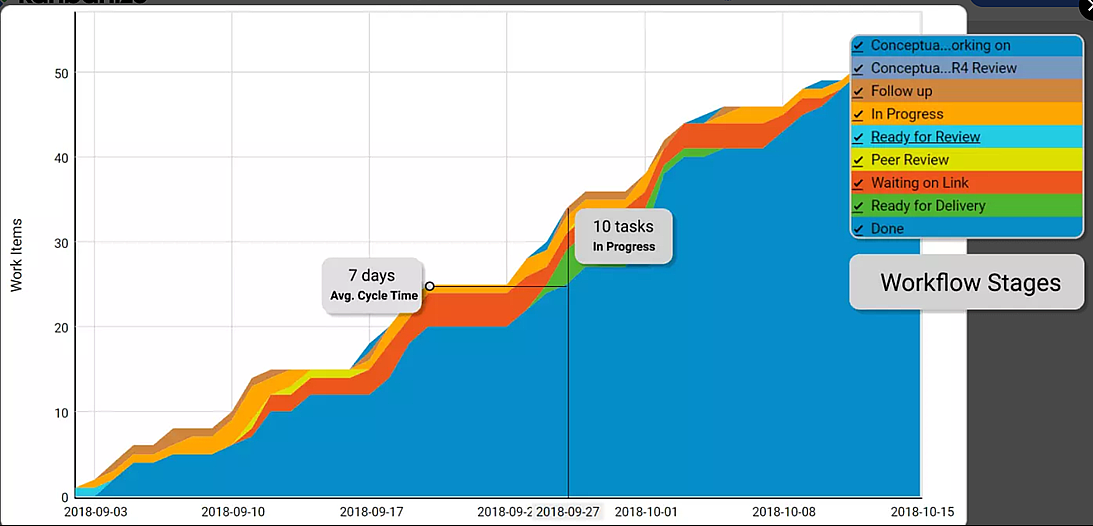
The time period for which the chart’s data is being seen is represented by the horizontal axis of the CFD. The total number of cards in the workflow at different times is displayed on the vertical axis.
The many stages of your process are represented by the bands of various colors that split sections of the upward flow on the actual Kanban board. The bands always move upward or downward depending on how many assignments go through your process.
On the cumulative flow chart, the top line of each band reflects the point at which tasks enter the corresponding stage of your Kanban board, and the bottom line indicates the point at which they exit. When a line becomes flat, nothing enters the stage it corresponds to or leaves it.
Using a CFD, you can get an idea of how long your tasks’ approximate cycle time is.
This can be done by counting the horizontal distance between the bottom line of the final “in progress” stage and the top line of the first stage on the cumulative flow diagram.
The approximate average cycle time of your team’s tasks for the given time period is the number of days, weeks, or months that have elapsed.
The distance between the lines of a CFD will show you the problems of your workflow.
Understanding the data on a CFD Chart
By observing how the top and bottom lines of each band in your cumulative flow diagram change, you can quickly determine whether your process is stable.
There are three common scenarios:
The Bands are Progressing in Parallel
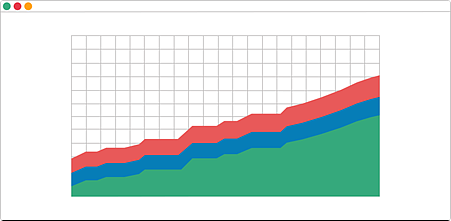
This means that your throughput is stable, and new tasks are entering your workflow in parallel to those that are leaving it. This is the ideal outcome and shows that you can focus your efforts on shortening your assignments’ cycle times.
A Band is Rapidly Narrowing
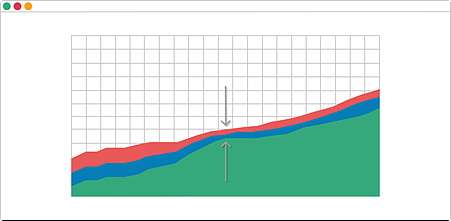
If a band on your CFD is continuously narrowing, that means that the throughput of the stage it represents is higher than the entry rate. This is a sign that you’ve got more capacity than you really need at this stage, and you should relocate it to optimize the flow.
A Band is Rapidly Widening
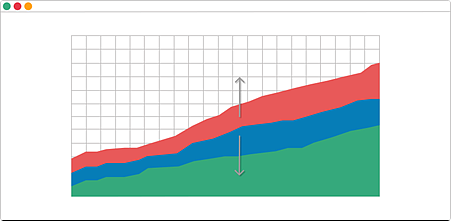
The number of cards that enter the associated stage on the Kanban board is higher than the number of assignments leaving it whenever this occurs on a cumulative flow diagram. Multitasking and other wasteful activities that don’t add value are the main causes of this widespread issue.
To fix this problem, there are numerous options. If this is not the result of a dependent on external stakeholders, you should reevaluate the current WIP limitations on your Kanban board and put more emphasis on completing ongoing tasks before beginning new ones.
The bands are dissipating is a potential fourth scenario that you should be aware of. Your cumulative flow diagram is in error if any band on it decreases. Never let a task vanish from your workflow.
The cumulative flow diagram, in conclusion, is a sophisticated analytical tool that will accurately depict how stable your process is and how effective your team is. In a single glance, you can obtain useful guidance regarding where to concentrate your efforts in order to enhance your procedure.

Course Manual 7: Kanban Metrics Charts
What is a Burndown Chart?
In software development, a burndown chart illustrates the process of “burning down” the backlog of unfinished work. A burndown chart, in short, displays the amount of work that has to be done from the time the task began (x-axis) until it is finished (y-axis).
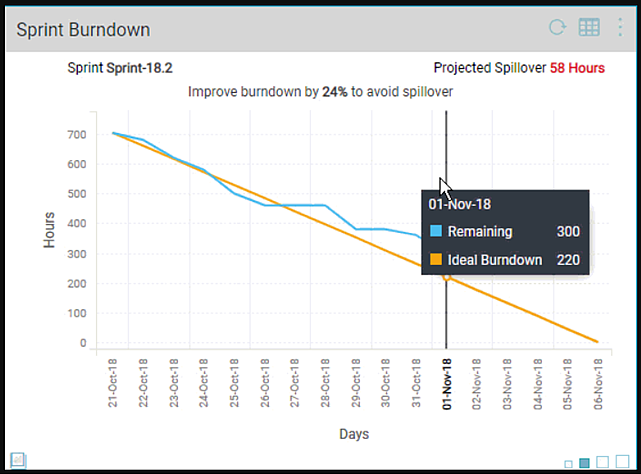
How Do You Read a Burndown Chart? What Does It Tell You?
A burndown chart is a straightforward visual representation of how work advances. It identifies whether the actual remaining work (represented by the vertical bars) is in front of (below) or behind (above) the ideal work remaining line (represented by the straight line). The optimal work remaining line assumes that you consistently accomplish tasks at the same rate. It would be more appropriate to call it the average work remaining line because that is not likely to occur.
What Can You Use Burndown Charts for in Agile?
Burndown charts are a Scrum innovation. They were developed by Ken Schwaber as an easy way for teams to track their progress during a Sprint.
Burndown charts, however, are not exclusive to Scrum teams. They work equally well with XP (extreme programming), Kanban, and Lean.
Additionally, you may use them to visualize development for any size of project. So, for:
• Scrum Sprints or iterations in general
• Epics
• Releases
• Projects
An iteration burndown typically shows the amount of story points and days left in the sprint/iteration. The remaining work is shown in story points on the other burndown charts, but the duration is shown in iterations.
Why Is a Burndown Chart Important? Or: What Do You Get Out of It?
• A burndown chart reveals the actual state of the task in progress. There is no need for more speculation. Of course, this is only true if the data used to generate your burndown chart is kept current.
• A burndown chart keeps everyone updated on progress—or lack thereof—and involved. This works best when it is displayed on a large monitor or other information radiator that is directly in front of everyone.
• A burndown chart enables you to identify slower-than-expected advancement. So you can figure out what’s causing it and address it before it gets out of control and becomes a problem.
• Burndown charts are simple to comprehend. It is a highly effective progress tracker due to its simplicity.
The Limitations of a Burndown Chart, or What It Doesn’t Tell You
Burndown charts are pleasant and easy, but they also have some limits that you should be aware of.
• Burndown charts are just concerned with their small portion of the pie, so they don’t provide any information on scope changes in the whole pie. For instance, if you’re seeing a Sprint burndown, the rest of the backlog won’t show scope changes. The project or product burndown is the only burndown that provides a complete picture.
• Charts of burndown solely display the volume of work. They don’t display the user stories that have been finished, nor do they indicate whether those were the proper tales to finish.
• The accuracy of your estimates directly affects how informative burndown charts are. Time estimates are frequently wrong. Accurate time estimates are just impossible for humans due to their cognitive biases. Story points that address complexity and relative sizing are preferable. But there will always be biases involved in estimation.
Why Burndowns charts don’t explain why there is more work left to complete. Either more work will be added or the estimated amount of work still to be done will be increased. They also mask the impact of deleting work because it appears to be finished.
• You can overcome this restriction by displaying both finished and newly added work. It’s a good idea to include removed work in release burndowns. These improvements make it simple to detect scope changes.
This restriction can be lessened by displaying both finished and newly added tasks. It’s a good idea to include removed work in release burndowns. These improvements make it simple to detect scope changes.
• A burndown chart can warn you when there is trouble in paradise or ice cream and soda, but it cannot tell you when an epic will be finished. Your choice of which versions to include the epic’s stories will determine that.
• The delivery date (day) for the beginning workload is displayed on the average work remaining line. But if you consistently work more slowly or more quickly than the average, the delivery date is incorrect. Additionally, scope modifications really throw a wrench in the works.
Add an average work remaining line from the most recent iteration that was finished to help alleviate this. Moreover, base it on the typical velocity attained thus far. The work remaining lines for the lowest and greatest realized velocities are optionally added. You will receive an “earliest” and a “latest” projection as a result.
Fire up Your Progress Tracking With a Burndown Chart
It’s time to put your understanding of burndown charts into practice now that you understand what they are, what they do, and what they don’t tell you. Order that large monitor now; delivery will take some time. Then, on your Scrum or Kanban board software, locate the burndown charts. And then arrange something basic to display on that monitor for them. That enormously attractive information radiator will keep everyone up to date. Imagine how much more effectively you will be able to handle difficulties as they arise rather than after they have already developed into problems. And how that will affect your level of stress. You can do this. To burn down your work on your information radiator, go make some fire.

Flow Efficiency Chart
The inquiry “When will my request be completed?” is one of the most frequently posed to working professionals. We frequently use lead time metrics to answer questions in order to provide a reliable response. We can set delivery expectations with a high degree of confidence by examining lead times over time. It serves as a predictability tactic.
We frequently concentrate on ways to enhance the active work we perform for the requests we receive when looking to reduce such lead times. We might develop continuous delivery pipelines, enhance test automation, and/or implement code reviews. All of those are admirable initiatives. Too many teams, though, are unaware that minimizing the amount of time we spend NOT working on our requests may be the most effective method to shorten the lead times for our work.
Introducing the Flow Efficiency metric
Working time and waiting time are the two fundamental parts of lead time that are examined by flow efficiency.

Lead time has both of these elements unless you just work on one thing at a time and are never interrupted. There are numerous factors that can cause waiting time, including dependencies, shifting priorities, having too much work in process, etc.
Or, to put it another way, a work-in-progress isn’t always one that is. How frequently that is true is revealed by flow efficiency.

Nvidia’s Workflow Efficiency
The creator of the GPU, NVIDIA, is now the driving force behind autonomous vehicles, intelligent machines, and the Internet of Things. In a nutshell, this team is made up of a very skilled and highly diversified group of individuals who have workflow down to a science.
NVIDIA can afford to be the technological trailblazer it is because to its over $10 billion in annual revenue. In actuality, it is their innovations that provide them the ability to master resource allocation through process. How do they achieve this? By taking on the meaning of the idiom “eating your own dog food,” which is used frequently in the software business.
NVIDIA is a leader in the field of artificial intelligence, as the nerds reading this article are already aware. They have been in the forefront of AI-based developments in translation, recommendation, object instance segmentation, object detection, and image categorization. The nerds may not be aware that they use these technologies to budget funds in order to reduce expenses and improve workflow efficiency.
NVIDIA keeps records on every part of their business, including the number of CPUs they have sold and the price of the raw materials used to make those CPUs. By incorporating AI into business processes, they can assess the precise cost of every activity and utilize that information to automatically allocate funds in the most cost-effective manner in real time. They are a workflow success because they use cutting-edge technology to reinvest in their own business.
Calculating your flow efficiency
Although it is possible to measure the flow efficiency of a process for a single request, it is much more likely that you will wish to do so for all requests that were completed within a certain time frame. You will require the following information for the tasks finished during that time.
1. Overall Lead time (work + wait time)
2. Active Work time (do not include time spent waiting)
The active work time is then divided by the total lead time to determine flow efficiency. The answer to that equation, multiplied by 100%, is your flow efficiency for the designated time period.
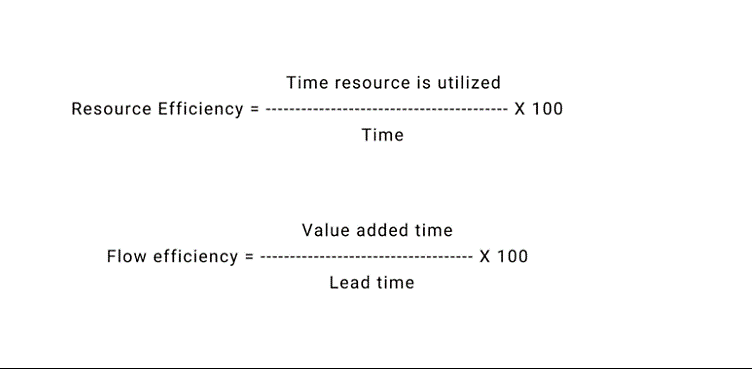
Visualizing your wait
The time that work spends waiting is crucial information for flow efficiency calculations. Your board structure will be set up to indicate when work is queued and prepared to be pulled to the following stage if you are using a board for a true pull system. To determine flow efficiency correctly, it is necessary to measure the amount of time work spends in those queue columns.
People frequently inquire about the appropriate level of detail to use when comparing wait and work hours. Like many other things, the cost of maintaining the data for the calculation must be weighed against the potential rewards. I advise against trying to pinpoint events down to the minute. Some people prefer to count the days they spend working on a task while others prefer to keep track of the hours they put in each day. My recommendation? Find your team’s or your own ideal balance by beginning someplace. Err on the side of simplicity and then become more specific if you find that it is necessary because if there is too much overhead, people will abandon it.
What is a normal flow efficiency?
The most kind-hearted of all the assertions I’ve heard about the flow efficiency of your typical team/organization claims that teams who aren’t paying attention to this idea often have flow efficiencies around the 15% mark. 15% is therefore “normal.” That means that work typically waits for something for 85% of its lifespan.
Some of the reasons for this delay are easier to fix than others. In some cases, we may simply stop making decisions that result in delays, but in other cases, we require assistance from other departments or organizations to fix the problems. That is possibly one of the reasons David J. Anderson claims that anything above 40% is a decent flow efficiency.
The math nearly always shows us that if we prioritize fixing wait reasons over simplifying the task, we can reduce lead time by a significantly higher proportion. There is a great chance for happy customers there.
Improving your flow efficiency
Your flow efficiency result, like other measures, won’t teach you how to increase your efficiency. Any attempt to do so in a manner that is standard and devoid of context is likely to create more issues than it resolves. Any metric’s consumer is responsible for comprehending what it intends to show them (and what it doesn’t). You must also investigate the reasons behind the trends and informational points the metric reflects.
When you examine the job in detail, you may start to identify the factors that contribute to the needless wait times and the effects that each one has. Then you can start to plan tests to see if you can shorten the delay and improve your flow efficiency.
Long lead times can be defeated by visualizing and minimizing the wait, as well as by optimizing the task itself. This is the key to creating satisfied customers.

SpaceX’s Flow Efficiency
Advanced rockets and spacecraft are created, produced, and launched by SpaceX. The business was established in 2002 with the intention of revolutionizing space technology and ultimately paving the way for human habitation on other planets. Nothing major.
The once-considered insane SpaceX made the decision to fly a rocket into space every two weeks one day. This was a pretty high standard to set before they ultimately reached the promised land thanks to their enhanced workflow. This is what they did.
Supply chains, internal production, and workflow for engine testing were all skills that SpaceX started to hone, and the results soon became apparent. From 5 launches in 2015, they were able to increase that number to 18 launches a year by 2017 and 21 launches in only the past year. Their fundamental tenets are to adhere to two ideas: 1) expand the number of launchpads in accordance with demand; and 2) continuously improve supply chain, production, and engine testing workflows.
SpaceX launched 21 rockets doing precisely that in 2018 alone. SpaceX could easily launch 26 rockets in 2019, which would be a record for any public or commercial space exploration organization, if it stays on its current course. That is definitely workflow at its best.
Workshop Exercises

Fine-Tuning Kanban Exercises
01. Never Pass Defective Products: Explain in your own words how this process will directly impact upon your department?
02. Take Only What’s Needed: Explain in your own words how this process will directly impact upon your department?
03. Produce the Exact Quantity Required: Explain in your own words how this process will directly impact upon your department?
04. Level the Production: Explain in your own words how this process will directly impact upon your department?
05. Process Optimization – Lead & Cycle Time: Explain in your own words how this process will directly impact upon your department?
06. Process Optimization – Throughput: Explain in your own words how this process will directly impact upon your department?
07. Kanban Metrics Charts: Explain in your own words how this process will directly impact upon your department?

SWOT & MOST Analysis Exercises
01. Undertake a detailed SWOT Analysis in order to identify your department’s internal strengths and weaknesses and external opportunities and threats in relation to each of the 12 Fine-Tuning Kanban processes featured above. Undertake this task together with your department’s stakeholders in order to encourage collaborative evaluation.
02. Develop a detailed MOST Analysis in order to establish your department’s: Mission; Objectives; Strategies and Tasks in relation to Fine-Tuning Kanban . Undertake this task together with all of your department’s stakeholders in order to encourage collaborative evaluation.
Project Studies
Project Study (Part 1) – Customer Service
The Head of this Department is to provide a detailed report relating to the Fine-Tuning Kanban process that has been implemented within their department, together with all key stakeholders, as a result of conducting this workshop, incorporating process: planning; development; implementation; management; and review. Your process should feature the following 12 parts:
01. Never Pass Defective Products
02. Take Only What’s Needed
03. Produce the Exact Quantity Required
04. Level the Production
05. Process Optimization – Lead & Cycle Time
06. Process Optimization – Throughput
07. Kanban Metrics Charts
Please include the results of the initial evaluation and assessment.
Project Study (Part 2) – E-Business
The Head of this Department is to provide a detailed report relating to the Fine-Tuning Kanban process that has been implemented within their department, together with all key stakeholders, as a result of conducting this workshop, incorporating process: planning; development; implementation; management; and review. Your process should feature the following 12 parts:
01. Never Pass Defective Products
02. Take Only What’s Needed
03. Produce the Exact Quantity Required
04. Level the Production
05. Process Optimization – Lead & Cycle Time
06. Process Optimization – Throughput
07. Kanban Metrics Charts
Please include the results of the initial evaluation and assessment.
Project Study (Part 3) – Finance
The Head of this Department is to provide a detailed report relating to the Fine-Tuning Kanban process that has been implemented within their department, together with all key stakeholders, as a result of conducting this workshop, incorporating process: planning; development; implementation; management; and review. Your process should feature the following 12 parts:
01. Never Pass Defective Products
02. Take Only What’s Needed
03. Produce the Exact Quantity Required
04. Level the Production
05. Process Optimization – Lead & Cycle Time
06. Process Optimization – Throughput
07. Kanban Metrics Charts
Please include the results of the initial evaluation and assessment.
Project Study (Part 4) – Globalization
The Head of this Department is to provide a detailed report relating to the Fine-Tuning Kanban process that has been implemented within their department, together with all key stakeholders, as a result of conducting this workshop, incorporating process: planning; development; implementation; management; and review. Your process should feature the following 12 parts:
01. Never Pass Defective Products
02. Take Only What’s Needed
03. Produce the Exact Quantity Required
04. Level the Production
05. Process Optimization – Lead & Cycle Time
06. Process Optimization – Throughput
07. Kanban Metrics Charts
Please include the results of the initial evaluation and assessment.
Project Study (Part 5) – Human Resources
The Head of this Department is to provide a detailed report relating to the Fine-Tuning Kanban process that has been implemented within their department, together with all key stakeholders, as a result of conducting this workshop, incorporating process: planning; development; implementation; management; and review. Your process should feature the following 12 parts:
01. Never Pass Defective Products
02. Take Only What’s Needed
03. Produce the Exact Quantity Required
04. Level the Production
05. Process Optimization – Lead & Cycle Time
06. Process Optimization – Throughput
07. Kanban Metrics Charts
Please include the results of the initial evaluation and assessment.
Project Study (Part 6) – Information Technology
The Head of this Department is to provide a detailed report relating to the Fine-Tuning Kanban process that has been implemented within their department, together with all key stakeholders, as a result of conducting this workshop, incorporating process: planning; development; implementation; management; and review. Your process should feature the following 12 parts:
01. Never Pass Defective Products
02. Take Only What’s Needed
03. Produce the Exact Quantity Required
04. Level the Production
05. Process Optimization – Lead & Cycle Time
06. Process Optimization – Throughput
07. Kanban Metrics Charts
Please include the results of the initial evaluation and assessment.
Project Study (Part 7) – Legal
The Head of this Department is to provide a detailed report relating to the Fine-Tuning Kanban process that has been implemented within their department, together with all key stakeholders, as a result of conducting this workshop, incorporating process: planning; development; implementation; management; and review. Your process should feature the following 12 parts:
01. Never Pass Defective Products
02. Take Only What’s Needed
03. Produce the Exact Quantity Required
04. Level the Production
05. Process Optimization – Lead & Cycle Time
06. Process Optimization – Throughput
07. Kanban Metrics Charts
Please include the results of the initial evaluation and assessment.
Project Study (Part 8) – Management
The Head of this Department is to provide a detailed report relating to the Fine-Tuning Kanban process that has been implemented within their department, together with all key stakeholders, as a result of conducting this workshop, incorporating process: planning; development; implementation; management; and review. Your process should feature the following 12 parts:
01. Never Pass Defective Products
02. Take Only What’s Needed
03. Produce the Exact Quantity Required
04. Level the Production
05. Process Optimization – Lead & Cycle Time
06. Process Optimization – Throughput
07. Kanban Metrics Charts
Please include the results of the initial evaluation and assessment.

Project Study (Part 9) – Marketing
The Head of this Department is to provide a detailed report relating to the Fine-Tuning Kanban process that has been implemented within their department, together with all key stakeholders, as a result of conducting this workshop, incorporating process: planning; development; implementation; management; and review. Your process should feature the following 12 parts:
01. Never Pass Defective Products
02. Take Only What’s Needed
03. Produce the Exact Quantity Required
04. Level the Production
05. Process Optimization – Lead & Cycle Time
06. Process Optimization – Throughput
07. Kanban Metrics Charts
Please include the results of the initial evaluation and assessment.

Project Study (Part 10) – Production
The Head of this Department is to provide a detailed report relating to the Fine-Tuning Kanban process that has been implemented within their department, together with all key stakeholders, as a result of conducting this workshop, incorporating process: planning; development; implementation; management; and review. Your process should feature the following 12 parts:
01. Never Pass Defective Products
02. Take Only What’s Needed
03. Produce the Exact Quantity Required
04. Level the Production
05. Process Optimization – Lead & Cycle Time
06. Process Optimization – Throughput
07. Kanban Metrics Charts
Please include the results of the initial evaluation and assessment.

Project Study (Part 11) – Logistics
The Head of this Department is to provide a detailed report relating to the Fine-Tuning Kanban process that has been implemented within their department, together with all key stakeholders, as a result of conducting this workshop, incorporating process: planning; development; implementation; management; and review. Your process should feature the following 12 parts:
01. Never Pass Defective Products
02. Take Only What’s Needed
03. Produce the Exact Quantity Required
04. Level the Production
05. Process Optimization – Lead & Cycle Time
06. Process Optimization – Throughput
07. Kanban Metrics Charts
Please include the results of the initial evaluation and assessment.

Project Study (Part 12) – Education
The Head of this Department is to provide a detailed report relating to the Fine-Tuning Kanban process that has been implemented within their department, together with all key stakeholders, as a result of conducting this workshop, incorporating process: planning; development; implementation; management; and review. Your process should feature the following 12 parts:
01. Never Pass Defective Products
02. Take Only What’s Needed
03. Produce the Exact Quantity Required
04. Level the Production
05. Process Optimization – Lead & Cycle Time
06. Process Optimization – Throughput
07. Kanban Metrics Charts
Please include the results of the initial evaluation and assessment.
Program Benefits
Information Technology
- Agile IT processes
- Improved value delivery
- Decreased defects
- Continuous improvement
- Modernized infrastructure
- Re-tooled staff
- Increased morale
- IT Business partnership
- Meaningful metrics
- Effective sourcing
Management
- Decreased costs
- Aligned strategies
- Servant leadership
- Clarified priorities
- Improved effectiveness
- Improved transparency
- Reduced risk
- Measurable results
- Satisfied customers
- Vendor partnerships
Human Resources
- Empowered teams
- Servant leaders
- Re-tooled staff
- Improved teamwork
- Enhanced collaboration
- Improved performance
- Reduced turnover
- Improved loyalty
- Leadership development
- Employee development
Client Telephone Conference (CTC)
If you have any questions or if you would like to arrange a Client Telephone Conference (CTC) to discuss this particular Unique Consulting Service Proposition (UCSP) in more detail, please CLICK HERE.


