


Actualizing NetZero – WDP2 (Energy Costs)

The Appleton Greene Corporate Training Program (CTP) for Actualizing NetZero is provided by Mr. Chidwick Certified Learning Provider (CLP). Program Specifications: Monthly cost USD$2,500.00; Monthly Workshops 6 hours; Monthly Support 4 hours; Program Duration 12 months; Program orders subject to ongoing availability.
If you would like to view the Client Information Hub (CIH) for this program, please Click Here
Learning Provider Profile
Mr. Chidwick comes to Appleton Greene with over 25 years of energy experience in multiple industries and has hands-on experience with developing energy strategies for net zero mitigation and adaption. His engineering background, business involvement, and dedication to the green energy movement inspired him to leverage this wealth of real-world experience to develop the ‘Actualizing NetZero’ program to help other companies create energy plans appropriate for their unique circumstances.
Mr. Chidwick understands the current energy issues facing businesses. For decades, burning fossil fuels provided cheap and abundant energy that brought success to the economy and was perceived as an infinite source of low cost heat and power. Over the past decade, global climate awareness has spawned technical mandates, intertwined with ethical and financial pressures, to reduce energy consumption and carbon footprints. As a result, our economy is transitioning to a lower energy and carbon future, where most organizations are influenced by three objectives: to reduce energy costs, to reduce carbon emissions, and to provide energy security through sustainability.
Mr. Chidwick supports the effective development of your Actualizing Net Zero program, which is tailored to your specific industry and location by engaging with your workforce and data to ensure the strategy is future proof, actionable, and successful.
Mr. Chidwick combines an understanding about businesses and the energy issues facing them with real-life experience creating solutions, and provides a compelling course that adds value to any business arsenal serious about tackling the realization and actualization of affordable netzero energy.
Following a successful career as a management consultant in the energy sector developing strategies to help organizations reduce energy costs, reducing emissions and developing energy security, Mr. Chidwick has developed the ‘Actualizing NetZero’ program. This program brings together first-hand experience working in this rapidly developing industry, understanding the breadth of challenges in different regions and industries, as well as a passion for energy efficiency and carbon management.

MOST Analysis

Mission Statement
The second workshop in the “Actualizing Netzero” program leads to establishing the energy consumers and costs for your facility.
Participants are exposed to the fundamentals energy systems in your facility and identifying the key energy consumers as well as the factors that impact the energy costs.

Objectives
The key objective for this workshop is to understand the factors that are impacting energy costs. These include:
1. Understand the need for interval data
2. Dissect your energy bills to determine the factors that affect energy costs
3. Understand the different structures for energy contracts
4. Determine the energy use intensity for your facility (efficiency metric)
5. Use the Energy Star Portfolio Manager to compute the efficiency score
6. Understand the energy consumers at your facility
7. Design a sub-metering project to ensure we have the data we need
8. Design an energy data management solution
9. Understand options for emissions data management
10. Understand the need and challenges for EV charging in your market
11. Understand the energy advantages in your location

Strategies
1. Review the benefits and challenges for detailed interval energy data
2. Develop a project for sub-metering to ensure we have the data we need
3. Develop an energy data management solution
4. Determine the factors that impact energy costs
5. Discuss options for energy contracts to reduce costs
6. Understand the Energy Use Intensity and the factors affecting the EUI
7. Develop an energy score for your facility to contrast with similar facilities
8. Develop an energy systems database for your facility
9. Understand the market demand for EV chargers
10. Understand the energy advantages for your facility

Tasks
1. Review your energy invoices to determine the factors that affect costs
2. Review your energy contracts to determine if there is a better structure
3. Compute the energy use intensity (EUI) and compare with similar facilities
4. Determine what additional data is required for a data-driven approach
5. Develop a project for sub-metering
6. Develop a project for energy data management
7. Develop a data base of the major energy consumers and their condition
8. Develop a data base for emissions data management .
Introduction

The Actualizing NetZero program develops the processes, governance and tools required to develop a strategy for energy and carbon emissions.
This program will develop an investment grade energy strategy (IGS) which provides comprehensive analyses that leads to actionable investment decisions. In every case, the IGS has led to the implementation of successful energy projects.
The IGS is not just another energy audit which are technical and often do not lead to implementation. Rather, the IGS translates the “techy-speak” into “CFO-speak” providing the analyses and metrics that financial decision-makers require to have confidence to make investment decisions.
An investment grade energy strategy is a comprehensive assessment of a facility’s energy usage and potential areas for improvement. This type of strategy serves as a foundation for making informed decisions regarding energy efficiency measures and on-site energy generation initiatives.
The first step in developing an investment grade energy strategy is to understand the scope of the problem – starting with energy costs.
Approach
This second workshop is broken down into seven major sections:
Understanding Energy Data
Understanding Your Energy Costs, including rates and tariffs
Energy Use Intensity – a measure of the energy efficiency of your building
Energy Scores
Energy Consumers at your facility
Energy Data Management
Energy Advantages at your facility
Energy Data
In the fields of sustainability and energy management, energy is a basic idea. Measuring it is essential for keeping an eye on consumption, assessing effectiveness, and putting sustainable strategies into action. There are several ways to measure energy, and each has its own use and context. The definitions, uses, and conversion factors of the most widely used energy units of measurement are all covered in detail in this workshop.
A basic feature of modern living is electricity consumption; so, the change to a more energy-efficient and environmentally sustainable future mostly hinges on our understanding and control of this use. Interval electricity data —that is, the comprehensive, time-sequenced data gathered by smart meters or other measurement systems—is one effective instrument for controlling energy use. Interval data tracks electricity use at regular intervals, frequently in increments as small as 15 minutes, unlike conventional monthly or annual meter readings, so offering extensive insights into consumption trends.
Improving energy efficiency, lowering prices, minimizing greenhouse gas emissions, and guaranteeing energy security depend on this detailed data. The significance of interval electricity data, its benefits, its part in energy management, and its collecting and management practices are discussed in this paper. We also look at the difficulties gathering interval data and offer actual case studies of its use.
Energy Costs
In this workshop, we will develop an understanding of the scope of the energy and carbon problem. We will investigate the current energy costs and develop and understanding of the key issues that impact energy costs.
We will review the current energy costs and identify those areas that have the highest potential for improvement. The first step in reducing costs and emissions is to improve energy cost efficiency. Changing operational processes to operate the facility more efficiently is often the easiest first step.
We will identify the risks and constraints for energy systems. Each location has energy advantages as well as constraints that will limit solution options. We will develop an understanding of the regional energy advantages and explore case studies where these advantages have been successful.
This workshop will dissect your electricity and natural gas invoices to better understand the components that contribute to the overall energy costs. This will consider the costs of energy, delivery and fixed fees. We will review fixed rate contracts, time-of-use contracts and deregulated markets,
We will investigate the different types of energy contracts, their advantages and disadvantages. We will also review the pros and cons of energy hedging contracts.
Energy Use Intensity
One of the most important metrics for evaluating a building’s energy efficiency is Energy Use Intensity (EUI). It calculates a building’s energy use per unit area over a given time frame, usually a year. Building owners and managers that want to minimize their environmental effect, cut operating expenses, and reduce energy consumption must comprehend and manage EUI. This thorough review looks at the importance of EUI, how to measure and evaluate it, what influences EUI, and how to make it better.
The lower the EUI, the more efficient the facility. This provides a metrics by which you can compare the efficiency of your facility with other similar facilities in the same climate conditions.
This workshop will examine the factors affecting the EUI, including:
Architecture / building envelope
HVAC systems
Occupancy and Use
Location
Maintenance and Operational Strategies
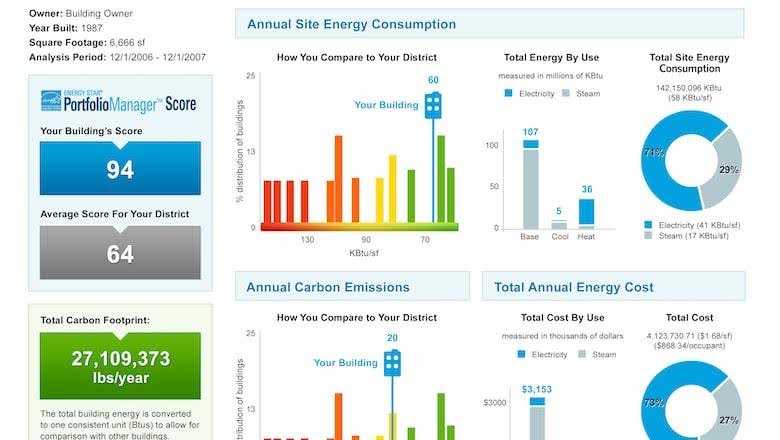
Energy Scores
Rating the energy efficiency of a building is a complex process that involves ranking a building’s energy consumption patterns alongside a peer group, normalizing for factors such as local climate and occupancy.
An energy performance score does not by itself explain why a building performs a certain way, or how to change the building’s performance. A score is an indicator as to the efficiency of the building… but not what to do about it.
Energy Star Portfolio Manager (ESPM) is a free service offered by the Department of Energy (USA and Canada) to simplify the normalization of data for weather and location.
In this workshop, we will explore the advantages and challenges of ESPM and use the ESPM to develop a score for your facility.
Energy Consumers
The energy consumption requirements of large structures, such as hotels, commercial real estate, and institutional buildings, are significant and varied. To find ways to increase energy efficiency, cut expenses, and minimize greenhouse gas emissions, it is crucial to comprehend the main energy users in these structures. This thorough review examines the main energy users in these kinds of buildings, with an emphasis on important energy systems including heating, cooling, and electricity.
In this workshop, we will explore the energy consumed by:
HVAC systems
Lighting
Water heaters
Building equipment such as elevators and appliances
Building envelope
Understanding where your energy is consumed is a key deliverable in this workshop and will help to focus attention in subsequent workshops.
However, without sub-meter data, this is often challenging. You cannot improve what you don’t measure. Most facilities either don’t have submeters or they don’t utilize the data that they collect to make informed decisions. Without an understanding of where energy is being consumed, it is very challenging to decide where to make improvements.
This workshop will determine what data is missing and design a sub-metering project to gather the required information in order to deliver a data-driven solution recommendation.
Finally, this workshop will discuss the challenges and market demand for electric vehicle (EV) charging. Driven by the fast acceptance of electric vehicles in all spheres, the worldwide need for electric vehicle (EV) chargers is witnessing exponential rise. The infrastructure for charging electric models has become increasingly important in facilitating this change as more customers and companies replace internal combustion engine vehicles with electric versions. Demand for EV chargers is especially rising in commercial real estate (CRE), high-density residential areas, and institutional buildings since these sectors realize they must meet the charging demands of an increasing number of owners of electric vehicles. In this workshop, we will explore the market demand for EV for commercial buildings, high density residential, institutional buildings and hotel/resorts.
Energy Data Management
Energy data management is the process of gathering, storing, analyzing, and using energy-related data in an organized manner in order to maximize energy use, improve energy efficiency, and assist with sustainability projects. This procedure entails keeping an eye on a variety of energy measures, including the use of steam, gas, water, electricity, and building portfolios. Reaching regulatory compliance, cutting expenses, finding inefficiencies, and achieving sustainability objectives all depend on effective energy data management.
In this workshop, we will explore the components of an energy data management solution and discuss the pros and cons of onsite data management and cloud based data management solutions.
This workshop will also explore the challenges of emissions data management, including scope 1 and 2 emissions.
Energy Advantages
Every region has their own unique energy advantages. Identifying the advantages in your area can lead to the types of energy systems that work best.
Modern life depends on energy; it drives homes, businesses, and transportation as well as industry. There are several sources of energy used worldwide; these can be classified as either renewable or non-renewable resources. Dealing with climate change and promoting sustainable development depend on an awareness of various energy sources and their application. This section investigates several energy sources: solar and wind, geothermal, gravity, hydropower and waves, chemical energy (oil, gas, and nuclear), and earth energy.
In this workshop, we will explore the advantages and challenges for each of the energy sources and determine which apply to your facility.

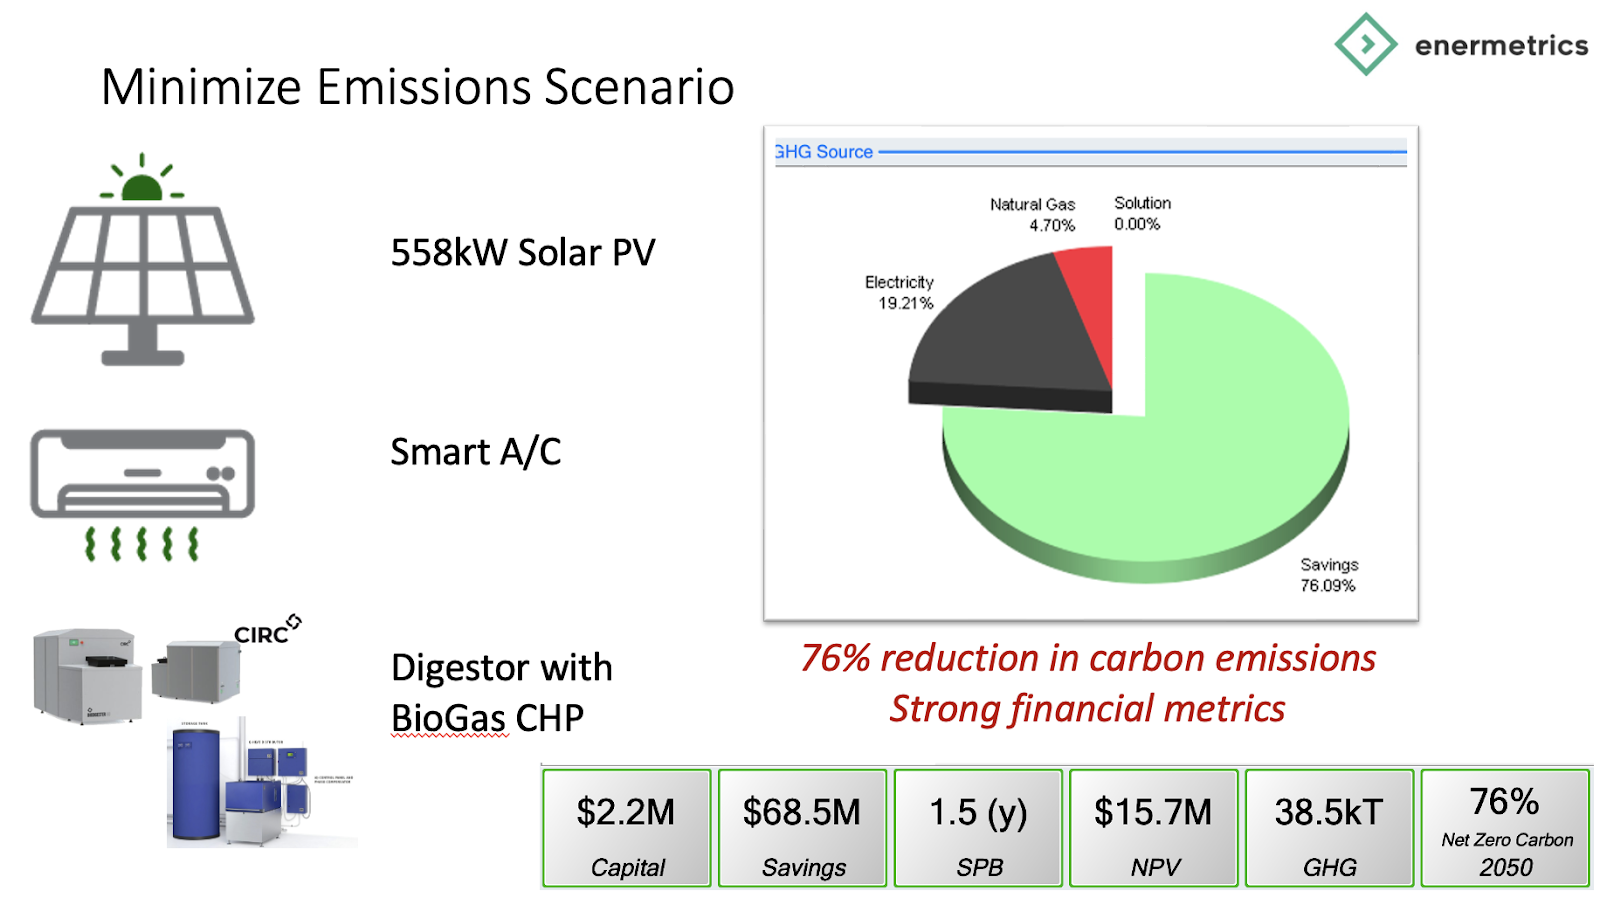
Case Study: Building Management System for Hotel / Resort
A hotel / resort struggled with very high energy costs. The resort implemented a number of systems to reduce their electricity consumption
Solar PV
Smart A/C
Sea water chillers
Bio-digester and small CHP
Since the major electricity consumption was due to air conditioning, the resort focused on reducing electricity consumption in this area. This included the smart A/C system described earlier as well as sea-water chillers to pre-chill the return water before entering into the main chillers. The result was that the main chillers didn’t have to work as hard as the water was already cooled down. However, the resort needed to understand if the cost of running the pumps for the cold sea water was less than the cost of running the chillers.
In order to track the performance of these investments, the resort implemented a number of sub-meters which captured the energy consumption in the existing building management system (BMS). This included:
Solar PV output
Air conditioner fans and pumps
Sea water chiller pumps
Electricity and heat generated by the CHP
The data was captured in their BMS and then used to generate analyses and reports for management demonstrating the performance of the investments.
Executive Summary

In the Workshop 2 module, we develop an understanding of the scope of the energy and carbon problem at your facility, based on industry, geographical location, and available energy options.
A first step in reducing costs and emissions is to improve current energy costs by changing operational processes to operate a facility more efficiently.
Our workshop objectives:
Understand the energy costs at your facility for electricity, heat, and cooling – We will investigate the current energy costs at your facility, and develop an understanding of the key issues that impact energy costs.
Find the issues that negatively impact your energy costs – We will identify the risks and constraints for different energy systems. Each location has energy advantages as well as constraints that limit solution options. We will develop an understanding of the regional energy advantages and explore case studies where these advantages have been successful.
Identify the best structure for your energy contracts – We will review the current energy costs and identify those areas that have the highest potential for improvement.
Chapter 1: Units of Measure
Energy can be measured in a variety of units which can make things confusing. There are simple conversion factors which we will discuss here before diving into the energy profile of your facility.
Common units of measure for energy purchased from utilities include:
Kilowatt Hour (kWh)
Giga Joule
British Thermal Unit
Therm
Cubic Meter
Quad
Electric energy is nearly always measured in kWh.
Fuel for heating has many measurements which all can be converted back to the metric unit of energy (GigaJoules). The imperial standard for heat energy is millions of BTU (MMBTU). Some regions deliver heating energy with Therms or cubic meters of natural gas or pounds of propane. A quad is one quadrillion BTU’s and is only used in the US.
The purpose for this chapter is to enlighten participants in order to avoid confusion as they dive into their energy data.

Chapter 2: Value of Interval Data
Interval data is captured every second, minute or hour – rather than just the monthly totals. This interval data is very important to better understand when and where the electricity is being consumed and the types of technologies that are most appropriate to reduce electricity consumption.
While monthly energy consumption totals are fine for a monthly billing cycle, they are inappropriate for designing an energy solution. In this example, the monthly data suggests a peak of 2300kW. But when we look at the hourly data, we see that the peak is actually 5000kW. This will dramatically change the financial metrics for the energy solutions considered.
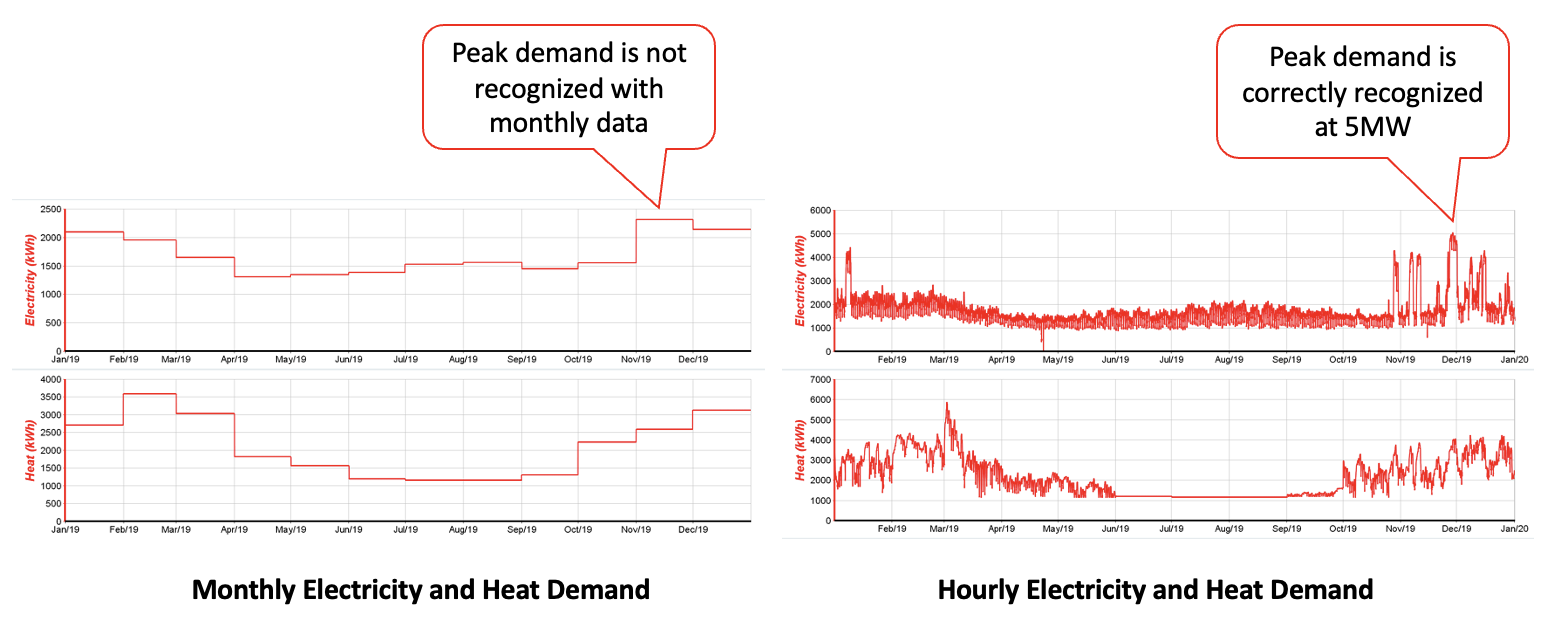
When we considered combined heat and power for this site using the monthly data and the hourly data, it is clear that the monthly data resulted in incorrect results.
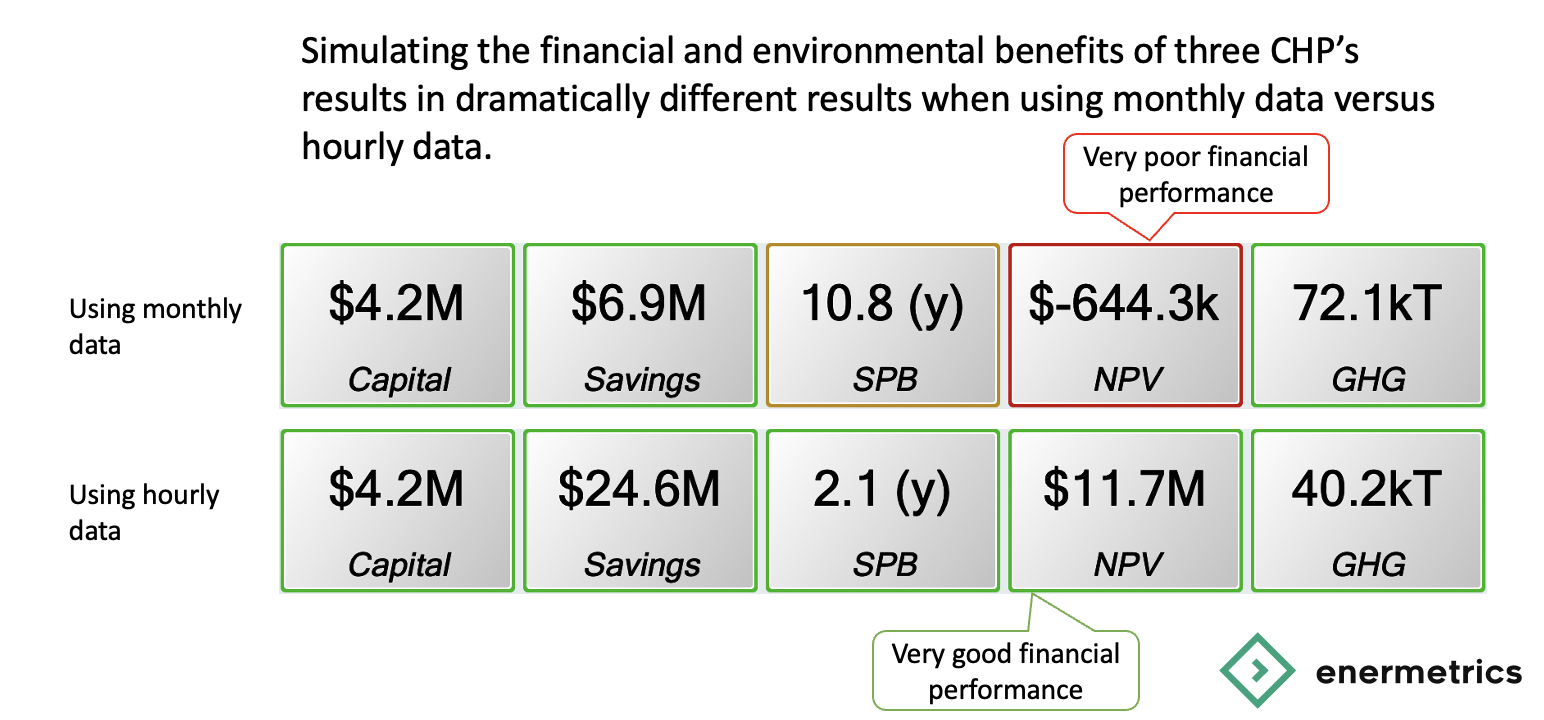
Many of the energy modeling and analyses tools only use monthly data. While it may be simpler, it’s clearly wrong.
If you’re going to invest in an energy project, it is critical that you consider the detailed hourly data to correctly forecast the value of the project and manage risk.

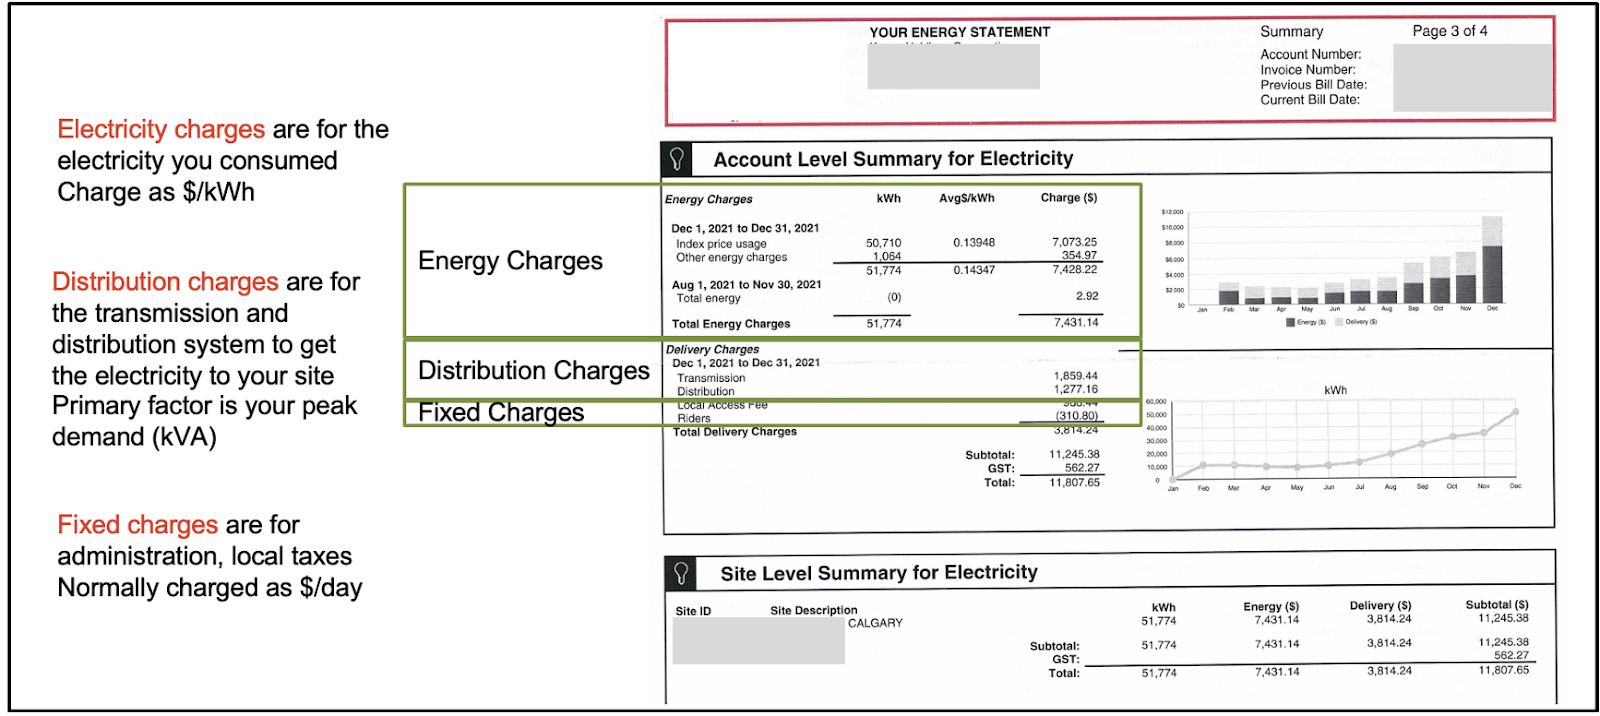
Chapter 3: Understanding Electricity Costs
The charges on your electricity bill generally fall into three categories:
Charges for the electricity consumed – Charged as $/kWh (cost per kWh of electricity consumed)
Charges for transmission and distribution (also called wires charges) – Charged as $/kVA or peak demand (cost per peak demand)
Fixed charges such as taxes, system access fees, administration fees, meter fees – Charged as $/month or $/day (fixed charges each billing cycle)
In this chapter, we will dissect your electricity bills and determine those factors that more significantly contribute to the electricity costs.

Chapter 4: Electricity Rates and Tariffs
There are a number of electricity rate contract models that are common across different jurisdictions. Often the rate structure is implemented over a state or province, but it is possible the rate structures are implemented over the coverage area of the utility – which can result in multiple rate structures within a state or province. These rate models include:
Fixed Rate
Tiered Rate
Time of Use Rate
The fixed rate is the simplest and has historically been the go-to rate structure. However, as utilities now need to upgrade their infrastructure, they are attempting to motivate electricity consumers to shift their demand profiles.
The tiered rate structure provides electricity at one rate for energy consumed below a specified level, and at a higher rate for energy above that level. This motivates facilities to reduce electricity consumption.
The time-of-use rate structures have a number of implementation models. In some deregulated markets, the price for electricity varies hour-by-hour. In other regions, the utilities divide the year into high, low and mid-rate periods. For periods where the grid is stressed (e.g. summer afternoons), the rates are high, and for periods where there is low demand on the grid (e.g. very early morning) the rates are low. This model attempts to encourage electricity consumers to shift their consumption.
In this chapter, we will review the electricity contract rate structure to determine if there are better alternatives.

Chapter 5: Energy Use Intensity
One important indicator used to assess a building’s energy efficiency is its Energy Use Intensity (EUI). It calculates a building’s energy use per unit area over a given time frame, usually a year. EUI is measured in terms of kilowatt-hours per square foot (kBTU/ft2/year) or kilowatt-hours per square meter (kWh/m2/year).
The EUI is an important metric for:
– Benchmarking: Using EUI, energy performance of various buildings may be compared to industry benchmarks and standards.
– Energy management: Assists in finding ways to increase efficiency and save energy.
– Sustainability: Is essential to determining how buildings affect the environment and creating plans to cut carbon emissions.
– Building Rating Systems: Used in energy-efficient building evaluation and recognition programs such as ENERGY STAR and LEED (Leadership in Energy and Environmental Design).
If your building has a high EUI (poor performance), this will lead us to consider strategies to improve the energy consumption, such as
– Energy Audits: Conduct regular energy audits to identify inefficiencies and areas for improvement.
– Upgrading Systems: Replace outdated HVAC systems, lighting, and appliances with more energy-efficient models.
– Building Envelope: Improve insulation, windows, and sealing to reduce energy loss.
– Operational Practices: Implement energy-saving practices such as optimizing thermostat settings, scheduling regular maintenance, and encouraging energy-conscious behavior among occupants.
– Renewable Energy: Incorporate renewable energy sources like solar panels to reduce reliance on non-renewable energy.
In this chapter, we will measure the EUI and compare with similar buildings to demonstrate how your building is performing. Further, we will utilize Energy Star Portfolio Manager to get a score for your building.


Chapter 6: Energy Scores
Rating the energy efficiency of a building is a complex process that involves ranking a building’s energy consumption patterns alongside a peer group, normalizing for factors such as local climate and occupancy.
An energy performance score does not by itself explain why a building performs a certain way, or how to change the building’s performance. A score is an indicator as to the efficiency of the building… but not what to do about it.
Energy Star Portfolio Manager is a free service offered by the Department of Energy (USA and Canada) to simplify the normalization of data for weather and location.
The U.S. Environmental Protection Agency (EPA) created the online tool ENERGY STAR Portfolio Manager to help building owners and managers monitor and evaluate water and energy use throughout their whole portfolio of properties. The tool was introduced in 1999 and is a key component of the ENERGY STAR initiative, which promotes energy efficiency in commercial and residential buildings. A standardized platform for monitoring, tracking, and benchmarking greenhouse gas emissions, water and energy use, and other sustainability metrics is offered by Portfolio Manager.
In this workshop, we will use the ESPM to compute the score for your building and compare with similar facilities.

Chapter 7: Energy Consumers
With the energy score from Workshop 6, we now need to discover where your energy is being consumed. This workshop will identify the major energy consumers at your facility.
HVAC Systems
Lighting
Water Heaters
Escalators and Office Equipment
Building Envelope Issues
The energy consumption requirements of large structures, such as hotels, commercial real estate, and institutional buildings, are significant and varied. To find ways to increase energy efficiency, cut expenses, and minimize greenhouse gas emissions, it is crucial to comprehend the main energy users in these structures. This thorough review examines the main energy users in these kinds of buildings, with an emphasis on important energy systems including heating, cooling, and electricity.
Numerous equipment and systems add to the overall energy consumption of major buildings, including hotels, office space, and institutional buildings. Significant energy users include office equipment, building envelope components, HVAC systems, lighting, water heating, escalators and elevators, industrial and specialized equipment, and renewable energy systems. Building owners and managers can find opportunities to increase energy efficiency, save operating costs, and support environmental sustainability by having a better awareness of these key energy consumers. Energy-saving upgrades to all of these systems have the potential to yield significant economic and environmental gains.

Chapter 8: Sub-Meter Design
In most cases, a building does not sub-meter their energy consumption. As such, it is impossible to accurately estimate what systems are consuming the energy and where there are opportunities to reduce energy consumption and costs.
The majority of energy costs are for electricity, especially in regions that require air conditioning (A/C). For example, hotels in tropical climates can spend over 50% of their electricity bill on A/C. However, without sub-metering the major electricity consumers, accurate modelling for different technology solutions is challenged.
Many BMS systems have the capability to host historians – which will collect the historical electricity consumption for the systems the manage. If these historians are not available, then installing electricity meters is required to gather the required information.
Sub-metering is not only used to inform us on where the electricity is being consumed. The sub-meter data will also demonstrate the success of projects that seek to reduce electricity consumption. Further the sub-meter data can be analyzed to show systems that are not optimally operated or are needing maintenance.
Finally, sub-metering is critical for the effective management of a micro-grid. You cannot optimize what your don’t measure. As such, micro-grid controllers depend on sub-meter data and sensors to control the distributed energy resources and the different loads.
This chapter will review the single line drawings (SLD) of the facility to determine where we need to have sub-meters in order to support the objectives, KPI’s and operational automation. We will review the advantages and challenges of implementing sub-metering projects.

Chapter 9: Energy Data Management
Capturing the energy data (electricity and heat) into a proper data management system is crucial. There are many energy data management systems on the market, both internal and cloud based. These systems not only provide a proper home for the energy data, they also provide the energy manager with the tools to validate and correct data issues, visualization tools, identify operational issues with building equipment and reporting.
It is strongly recommended that the facility manager start a project to implement one of these systems. Particular care should be taken to select a solution that is open (able to collect data from any meter), provides the reporting required, provides an appropriate level of alerts and systems analysis.
Energy management solutions break down into internal systems and cloud based systems, both have advantages. An internal system is often implemented in your building management system (BMS) and has the advantage of lower cost and leads to better utilization of the capabilities and automation with the BMS. However, often a facility does not have the resources / skills to effectively use configure and program a BMS.
Cloud based data management solutions will connect to all of your sensors and meters, gather and manage your data, providing visualization tools. These systems often have pre-packaged business rules to identify common operational issues (such as heating and cooling at the same time, fans that are running too often). This relieves the facility for needing a BMS expert to program the systems. However, automation with cloud based systems is more challenging.
Once energy data is managed, numerous dashboards can provide insights into operational issues, energy solution performance and automation.
This chapter will explore the pros and cons of internal and external data management solutions, considering the key issues of
Capabilities
Skills required
Cost
Risks

Chapter 10: Emissions Data
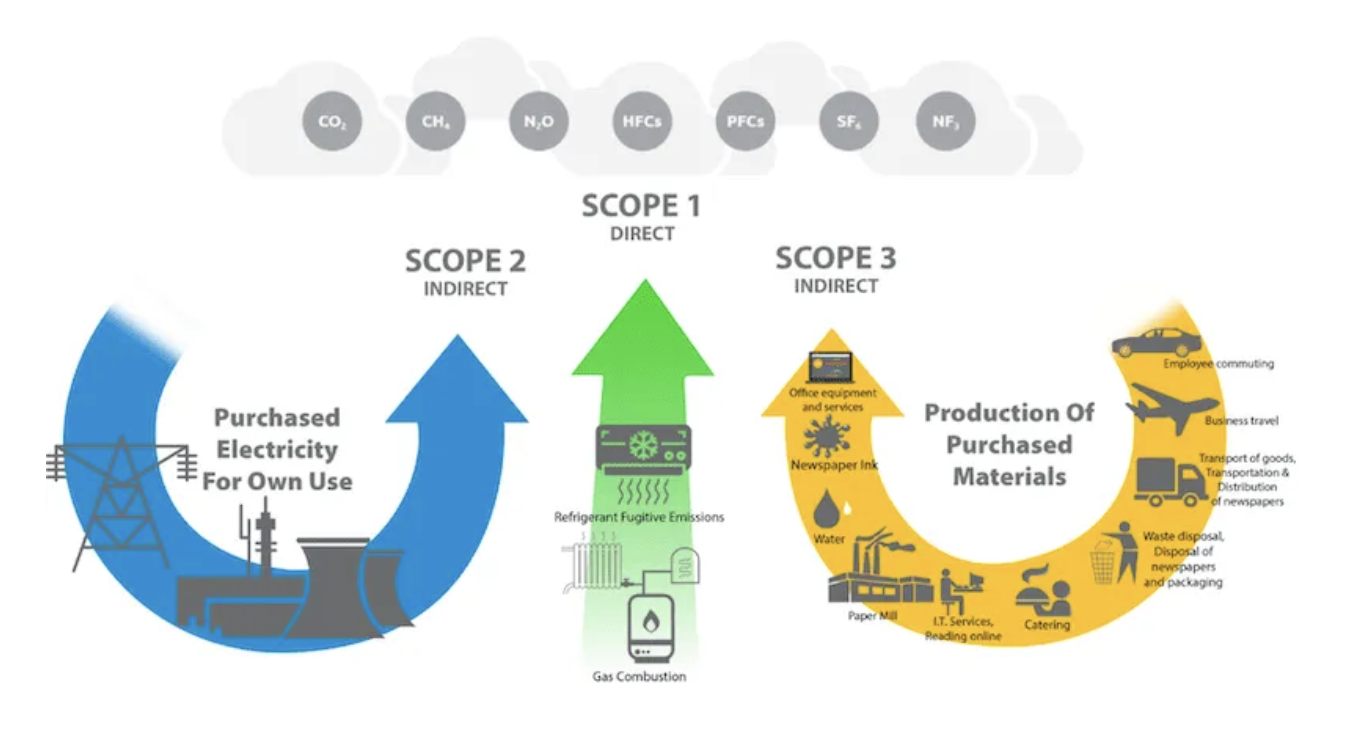
Many organizations are establishing their emissions reduction goals – primarily driven by customer demand. The question is how to reduce emissions affordably. Emissions break down into three sections
Scope 1 (emissions generated in the manufacturing of the organizations product)
Scope 2 (emissions associated with the energy that the organization consumes)
Scope 3 (emissions related to the supply chain)
Where emissions reduction was an afterthought a decade ago, many industries are finding that their customers are demanding a strong sustainability program and low emissions products. Many regions have implemented regulations on emissions and are requiring facilities to track and report on their emissions. Further, some financing organizations are demanding organizations track and report on their emissions in order to access financing – which is critical for any business.
The scope 1 and 2 emissions for your facility will be calculated in this workshop. This will consider the electricity grid carbon intensity and the emissions related to utilizing fossil fuels for heating.
The emissions data will feed the KPI’s identified for this program.
This workshop will identify the scope 1 and 2 emissions profile for your facility. This baseline will be used in future workshops to measure the impact of proposed solutions on emissions reduction.

Chapter 11: EV Chargers
The collision of two major market transitions (shift to EV’s and shift to densification of housing) has created concern that the electricity grid will be able to provide the energy required. This study demonstrates that combining onsite generation and batteries with intelligent energy management has the ability to address this issue.
As the residential market is moving towards densification to satisfy the growing population in urban centres, there is growing interest in providing EV chargers for high density residential facilities.
High density residential developers and condo owners recognize the growing demand for EV chargers at their facilities – and that there is strong motivation to maintain the value of their properties by providing an EV charging capability.
One of the biggest challenges for EV charging in high density residential buildings is the peak power demand. In a residential complex, the cars tend to plug-in to chargers when the electricity demand is at its highest – around 5-8pm. Without intelligent power management, a large number of EV chargers will dramatically increase the peak demand for the grid. This has a significant impact on the cost of electricity at the facility.
This workshop will discuss the need for supporting electric vehicles and the potential impact on electricity demand and associated costs. We will review technologies to manage the support for electric vehicle chargers while at the same time managing the facilities peak demand, utilizing intelligent EV chargers in combination with onsite generation.

Chapter 12: Regional Energy Advantages
Due to their distinct geographical and climatic features, many parts of the world are suited for different kinds of energy production. While onshore wind power flourishes in hilly places with strong wind speeds, solar PV is best suited for desert and plains areas with high solar irradiation. Because of the strong and steady wind and wave activity offshore, coastal areas benefit from wind and wave power. In areas like Iceland that have abundant geothermal resources, geothermal power is especially efficient. In many regions of the world, hydropower—which depends on big rivers and the capacity to build dams—is a dependable and effective energy source. Last but not least, nuclear power offers a steady and dependable power supply that is necessary to fulfill the rising global energy demand due to its high energy density and low greenhouse gas emissions. A diversified and sustainable global energy portfolio is facilitated by the distinct benefits and opportunities that each of these energy sources offers.
This workshop will review the energy advantages for your region and identify those advantages that can be leveraged. These include
Solar PV
Onshore Wind
Offshore Wind
Nuclear
Geothermal
Wave Energy
Hydro Power
Curriculum

Actualizing NetZero – WDP2 – Energy Costs
- Units of Measure
- Value of Interval Data
- Understanding Electricity Costs
- Electricity Rates and Tariffs
- Energy Use Intensity
- Energy Scores
- Energy Consumers
- Sub-Meter Design
- Energy Data Management
- Emissions Data
- EV Chargers
- Regional Energy Advantages
Distance Learning

Introduction
Welcome to Appleton Greene and thank you for enrolling on the Actualizing NetZero corporate training program. You will be learning through our unique facilitation via distance-learning method, which will enable you to practically implement everything that you learn academically. The methods and materials used in your program have been designed and developed to ensure that you derive the maximum benefits and enjoyment possible. We hope that you find the program challenging and fun to do. However, if you have never been a distance-learner before, you may be experiencing some trepidation at the task before you. So we will get you started by giving you some basic information and guidance on how you can make the best use of the modules, how you should manage the materials and what you should be doing as you work through them. This guide is designed to point you in the right direction and help you to become an effective distance-learner. Take a few hours or so to study this guide and your guide to tutorial support for students, while making notes, before you start to study in earnest.
Study environment
You will need to locate a quiet and private place to study, preferably a room where you can easily be isolated from external disturbances or distractions. Make sure the room is well-lit and incorporates a relaxed, pleasant feel. If you can spoil yourself within your study environment, you will have much more of a chance to ensure that you are always in the right frame of mind when you do devote time to study. For example, a nice fire, the ability to play soft soothing background music, soft but effective lighting, perhaps a nice view if possible and a good size desk with a comfortable chair. Make sure that your family know when you are studying and understand your study rules. Your study environment is very important. The ideal situation, if at all possible, is to have a separate study, which can be devoted to you. If this is not possible then you will need to pay a lot more attention to developing and managing your study schedule, because it will affect other people as well as yourself. The better your study environment, the more productive you will be.
Study tools & rules
Try and make sure that your study tools are sufficient and in good working order. You will need to have access to a computer, scanner and printer, with access to the internet. You will need a very comfortable chair, which supports your lower back, and you will need a good filing system. It can be very frustrating if you are spending valuable study time trying to fix study tools that are unreliable, or unsuitable for the task. Make sure that your study tools are up to date. You will also need to consider some study rules. Some of these rules will apply to you and will be intended to help you to be more disciplined about when and how you study. This distance-learning guide will help you and after you have read it you can put some thought into what your study rules should be. You will also need to negotiate some study rules for your family, friends or anyone who lives with you. They too will need to be disciplined in order to ensure that they can support you while you study. It is important to ensure that your family and friends are an integral part of your study team. Having their support and encouragement can prove to be a crucial contribution to your successful completion of the program. Involve them in as much as you can.
Successful distance-learning
Distance-learners are freed from the necessity of attending regular classes or workshops, since they can study in their own way, at their own pace and for their own purposes. But unlike traditional internal training courses, it is the student’s responsibility, with a distance-learning program, to ensure that they manage their own study contribution. This requires strong self-discipline and self-motivation skills and there must be a clear will to succeed. Those students who are used to managing themselves, are good at managing others and who enjoy working in isolation, are more likely to be good distance-learners. It is also important to be aware of the main reasons why you are studying and of the main objectives that you are hoping to achieve as a result. You will need to remind yourself of these objectives at times when you need to motivate yourself. Never lose sight of your long-term goals and your short-term objectives. There is nobody available here to pamper you, or to look after you, or to spoon-feed you with information, so you will need to find ways to encourage and appreciate yourself while you are studying. Make sure that you chart your study progress, so that you can be sure of your achievements and re-evaluate your goals and objectives regularly.
Self-assessment
Appleton Greene training programs are in all cases post-graduate programs. Consequently, you should already have obtained a business-related degree and be an experienced learner. You should therefore already be aware of your study strengths and weaknesses. For example, which time of the day are you at your most productive? Are you a lark or an owl? What study methods do you respond to the most? Are you a consistent learner? How do you discipline yourself? How do you ensure that you enjoy yourself while studying? It is important to understand yourself as a learner and so some self-assessment early on will be necessary if you are to apply yourself correctly. Perform a SWOT analysis on yourself as a student. List your internal strengths and weaknesses as a student and your external opportunities and threats. This will help you later on when you are creating a study plan. You can then incorporate features within your study plan that can ensure that you are playing to your strengths, while compensating for your weaknesses. You can also ensure that you make the most of your opportunities, while avoiding the potential threats to your success.
Accepting responsibility as a student
Training programs invariably require a significant investment, both in terms of what they cost and in the time that you need to contribute to study and the responsibility for successful completion of training programs rests entirely with the student. This is never more apparent than when a student is learning via distance-learning. Accepting responsibility as a student is an important step towards ensuring that you can successfully complete your training program. It is easy to instantly blame other people or factors when things go wrong. But the fact of the matter is that if a failure is your failure, then you have the power to do something about it, it is entirely in your own hands. If it is always someone else’s failure, then you are powerless to do anything about it. All students study in entirely different ways, this is because we are all individuals and what is right for one student, is not necessarily right for another. In order to succeed, you will have to accept personal responsibility for finding a way to plan, implement and manage a personal study plan that works for you. If you do not succeed, you only have yourself to blame.
Planning
By far the most critical contribution to stress, is the feeling of not being in control. In the absence of planning we tend to be reactive and can stumble from pillar to post in the hope that things will turn out fine in the end. Invariably they don’t! In order to be in control, we need to have firm ideas about how and when we want to do things. We also need to consider as many possible eventualities as we can, so that we are prepared for them when they happen. Prescriptive Change, is far easier to manage and control, than Emergent Change. The same is true with distance-learning. It is much easier and much more enjoyable, if you feel that you are in control and that things are going to plan. Even when things do go wrong, you are prepared for them and can act accordingly without any unnecessary stress. It is important therefore that you do take time to plan your studies properly.
Management
Once you have developed a clear study plan, it is of equal importance to ensure that you manage the implementation of it. Most of us usually enjoy planning, but it is usually during implementation when things go wrong. Targets are not met and we do not understand why. Sometimes we do not even know if targets are being met. It is not enough for us to conclude that the study plan just failed. If it is failing, you will need to understand what you can do about it. Similarly if your study plan is succeeding, it is still important to understand why, so that you can improve upon your success. You therefore need to have guidelines for self-assessment so that you can be consistent with performance improvement throughout the program. If you manage things correctly, then your performance should constantly improve throughout the program.
Study objectives & tasks
The first place to start is developing your program objectives. These should feature your reasons for undertaking the training program in order of priority. Keep them succinct and to the point in order to avoid confusion. Do not just write the first things that come into your head because they are likely to be too similar to each other. Make a list of possible departmental headings, such as: Customer Service; E-business; Finance; Globalization; Human Resources; Technology; Legal; Management; Marketing and Production. Then brainstorm for ideas by listing as many things that you want to achieve under each heading and later re-arrange these things in order of priority. Finally, select the top item from each department heading and choose these as your program objectives. Try and restrict yourself to five because it will enable you to focus clearly. It is likely that the other things that you listed will be achieved if each of the top objectives are achieved. If this does not prove to be the case, then simply work through the process again.
Study forecast
As a guide, the Appleton Greene Actualizing NetZero corporate training program should take 12-18 months to complete, depending upon your availability and current commitments. The reason why there is such a variance in time estimates is because every student is an individual, with differing productivity levels and different commitments. These differentiations are then exaggerated by the fact that this is a distance-learning program, which incorporates the practical integration of academic theory as an as a part of the training program. Consequently all of the project studies are real, which means that important decisions and compromises need to be made. You will want to get things right and will need to be patient with your expectations in order to ensure that they are. We would always recommend that you are prudent with your own task and time forecasts, but you still need to develop them and have a clear indication of what are realistic expectations in your case. With reference to your time planning: consider the time that you can realistically dedicate towards study with the program every week; calculate how long it should take you to complete the program, using the guidelines featured here; then break the program down into logical modules and allocate a suitable proportion of time to each of them, these will be your milestones; you can create a time plan by using a spreadsheet on your computer, or a personal organizer such as MS Outlook, you could also use a financial forecasting software; break your time forecasts down into manageable chunks of time, the more specific you can be, the more productive and accurate your time management will be; finally, use formulas where possible to do your time calculations for you, because this will help later on when your forecasts need to change in line with actual performance. With reference to your task planning: refer to your list of tasks that need to be undertaken in order to achieve your program objectives; with reference to your time plan, calculate when each task should be implemented; remember that you are not estimating when your objectives will be achieved, but when you will need to focus upon implementing the corresponding tasks; you also need to ensure that each task is implemented in conjunction with the associated training modules which are relevant; then break each single task down into a list of specific to do’s, say approximately ten to do’s for each task and enter these into your study plan; once again you could use MS Outlook to incorporate both your time and task planning and this could constitute your study plan; you could also use a project management software like MS Project. You should now have a clear and realistic forecast detailing when you can expect to be able to do something about undertaking the tasks to achieve your program objectives.
Performance management
It is one thing to develop your study forecast, it is quite another to monitor your progress. Ultimately it is less important whether you achieve your original study forecast and more important that you update it so that it constantly remains realistic in line with your performance. As you begin to work through the program, you will begin to have more of an idea about your own personal performance and productivity levels as a distance-learner. Once you have completed your first study module, you should re-evaluate your study forecast for both time and tasks, so that they reflect your actual performance level achieved. In order to achieve this you must first time yourself while training by using an alarm clock. Set the alarm for hourly intervals and make a note of how far you have come within that time. You can then make a note of your actual performance on your study plan and then compare your performance against your forecast. Then consider the reasons that have contributed towards your performance level, whether they are positive or negative and make a considered adjustment to your future forecasts as a result. Given time, you should start achieving your forecasts regularly.
With reference to time management: time yourself while you are studying and make a note of the actual time taken in your study plan; consider your successes with time-efficiency and the reasons for the success in each case and take this into consideration when reviewing future time planning; consider your failures with time-efficiency and the reasons for the failures in each case and take this into consideration when reviewing future time planning; re-evaluate your study forecast in relation to time planning for the remainder of your training program to ensure that you continue to be realistic about your time expectations. You need to be consistent with your time management, otherwise you will never complete your studies. This will either be because you are not contributing enough time to your studies, or you will become less efficient with the time that you do allocate to your studies. Remember, if you are not in control of your studies, they can just become yet another cause of stress for you.
With reference to your task management: time yourself while you are studying and make a note of the actual tasks that you have undertaken in your study plan; consider your successes with task-efficiency and the reasons for the success in each case; take this into consideration when reviewing future task planning; consider your failures with task-efficiency and the reasons for the failures in each case and take this into consideration when reviewing future task planning; re-evaluate your study forecast in relation to task planning for the remainder of your training program to ensure that you continue to be realistic about your task expectations. You need to be consistent with your task management, otherwise you will never know whether you are achieving your program objectives or not.
Keeping in touch
You will have access to qualified and experienced professors and tutors who are responsible for providing tutorial support for your particular training program. So don’t be shy about letting them know how you are getting on. We keep electronic records of all tutorial support emails so that professors and tutors can review previous correspondence before considering an individual response. It also means that there is a record of all communications between you and your professors and tutors and this helps to avoid any unnecessary duplication, misunderstanding, or misinterpretation. If you have a problem relating to the program, share it with them via email. It is likely that they have come across the same problem before and are usually able to make helpful suggestions and steer you in the right direction. To learn more about when and how to use tutorial support, please refer to the Tutorial Support section of this student information guide. This will help you to ensure that you are making the most of tutorial support that is available to you and will ultimately contribute towards your success and enjoyment with your training program.
Work colleagues and family
You should certainly discuss your program study progress with your colleagues, friends and your family. Appleton Greene training programs are very practical. They require you to seek information from other people, to plan, develop and implement processes with other people and to achieve feedback from other people in relation to viability and productivity. You will therefore have plenty of opportunities to test your ideas and enlist the views of others. People tend to be sympathetic towards distance-learners, so don’t bottle it all up in yourself. Get out there and share it! It is also likely that your family and colleagues are going to benefit from your labors with the program, so they are likely to be much more interested in being involved than you might think. Be bold about delegating work to those who might benefit themselves. This is a great way to achieve understanding and commitment from people who you may later rely upon for process implementation. Share your experiences with your friends and family.
Making it relevant
The key to successful learning is to make it relevant to your own individual circumstances. At all times you should be trying to make bridges between the content of the program and your own situation. Whether you achieve this through quiet reflection or through interactive discussion with your colleagues, client partners or your family, remember that it is the most important and rewarding aspect of translating your studies into real self-improvement. You should be clear about how you want the program to benefit you. This involves setting clear study objectives in relation to the content of the course in terms of understanding, concepts, completing research or reviewing activities and relating the content of the modules to your own situation. Your objectives may understandably change as you work through the program, in which case you should enter the revised objectives on your study plan so that you have a permanent reminder of what you are trying to achieve, when and why.
Distance-learning check-list
Prepare your study environment, your study tools and rules.
Undertake detailed self-assessment in terms of your ability as a learner.
Create a format for your study plan.
Consider your study objectives and tasks.
Create a study forecast.
Assess your study performance.
Re-evaluate your study forecast.
Be consistent when managing your study plan.
Use your Appleton Greene Certified Learning Provider (CLP) for tutorial support.
Make sure you keep in touch with those around you.
Tutorial Support

Programs
Appleton Greene uses standard and bespoke corporate training programs as vessels to transfer business process improvement knowledge into the heart of our clients’ organizations. Each individual program focuses upon the implementation of a specific business process, which enables clients to easily quantify their return on investment. There are hundreds of established Appleton Greene corporate training products now available to clients within customer services, e-business, finance, globalization, human resources, information technology, legal, management, marketing and production. It does not matter whether a client’s employees are located within one office, or an unlimited number of international offices, we can still bring them together to learn and implement specific business processes collectively. Our approach to global localization enables us to provide clients with a truly international service with that all important personal touch. Appleton Greene corporate training programs can be provided virtually or locally and they are all unique in that they individually focus upon a specific business function. They are implemented over a sustainable period of time and professional support is consistently provided by qualified learning providers and specialist consultants.
Support available
You will have a designated Certified Learning Provider (CLP) and an Accredited Consultant and we encourage you to communicate with them as much as possible. In all cases tutorial support is provided online because we can then keep a record of all communications to ensure that tutorial support remains consistent. You would also be forwarding your work to the tutorial support unit for evaluation and assessment. You will receive individual feedback on all of the work that you undertake on a one-to-one basis, together with specific recommendations for anything that may need to be changed in order to achieve a pass with merit or a pass with distinction and you then have as many opportunities as you may need to re-submit project studies until they meet with the required standard. Consequently the only reason that you should really fail (CLP) is if you do not do the work. It makes no difference to us whether a student takes 12 months or 18 months to complete the program, what matters is that in all cases the same quality standard will have been achieved.
Support Process
Please forward all of your future emails to the designated (CLP) Tutorial Support Unit email address that has been provided and please do not duplicate or copy your emails to other AGC email accounts as this will just cause unnecessary administration. Please note that emails are always answered as quickly as possible but you will need to allow a period of up to 20 business days for responses to general tutorial support emails during busy periods, because emails are answered strictly within the order in which they are received. You will also need to allow a period of up to 30 business days for the evaluation and assessment of project studies. This does not include weekends or public holidays. Please therefore kindly allow for this within your time planning. All communications are managed online via email because it enables tutorial service support managers to review other communications which have been received before responding and it ensures that there is a copy of all communications retained on file for future reference. All communications will be stored within your personal (CLP) study file here at Appleton Greene throughout your designated study period. If you need any assistance or clarification at any time, please do not hesitate to contact us by forwarding an email and remember that we are here to help. If you have any questions, please list and number your questions succinctly and you can then be sure of receiving specific answers to each and every query.
Time Management
It takes approximately 1 Year to complete the Actualizing NetZero corporate training program, incorporating 12 x 6-hour monthly workshops. Each student will also need to contribute approximately 4 hours per week over 1 Year of their personal time. Students can study from home or work at their own pace and are responsible for managing their own study plan. There are no formal examinations and students are evaluated and assessed based upon their project study submissions, together with the quality of their internal analysis and supporting documents. They can contribute more time towards study when they have the time to do so and can contribute less time when they are busy. All students tend to be in full time employment while studying and the Actualizing NetZero program is purposely designed to accommodate this, so there is plenty of flexibility in terms of time management. It makes no difference to us at Appleton Greene, whether individuals take 12-18 months to complete this program. What matters is that in all cases the same standard of quality will have been achieved with the standard and bespoke programs that have been developed.
Distance Learning Guide
The distance learning guide should be your first port of call when starting your training program. It will help you when you are planning how and when to study, how to create the right environment and how to establish the right frame of mind. If you can lay the foundations properly during the planning stage, then it will contribute to your enjoyment and productivity while training later. The guide helps to change your lifestyle in order to accommodate time for study and to cultivate good study habits. It helps you to chart your progress so that you can measure your performance and achieve your goals. It explains the tools that you will need for study and how to make them work. It also explains how to translate academic theory into practical reality. Spend some time now working through your distance learning guide and make sure that you have firm foundations in place so that you can make the most of your distance learning program. There is no requirement for you to attend training workshops or classes at Appleton Greene offices. The entire program is undertaken online, program course manuals and project studies are administered via the Appleton Greene web site and via email, so you are able to study at your own pace and in the comfort of your own home or office as long as you have a computer and access to the internet.
How To Study
The how to study guide provides students with a clear understanding of the Appleton Greene facilitation via distance learning training methods and enables students to obtain a clear overview of the training program content. It enables students to understand the step-by-step training methods used by Appleton Greene and how course manuals are integrated with project studies. It explains the research and development that is required and the need to provide evidence and references to support your statements. It also enables students to understand precisely what will be required of them in order to achieve a pass with merit and a pass with distinction for individual project studies and provides useful guidance on how to be innovative and creative when developing your Unique Program Proposition (UPP).
Tutorial Support
Tutorial support for the Appleton Greene Actualizing NetZero corporate training program is provided online either through the Appleton Greene Client Support Portal (CSP), or via email. All tutorial support requests are facilitated by a designated Program Administration Manager (PAM). They are responsible for deciding which professor or tutor is the most appropriate option relating to the support required and then the tutorial support request is forwarded onto them. Once the professor or tutor has completed the tutorial support request and answered any questions that have been asked, this communication is then returned to the student via email by the designated Program Administration Manager (PAM). This enables all tutorial support, between students, professors and tutors, to be facilitated by the designated Program Administration Manager (PAM) efficiently and securely through the email account. You will therefore need to allow a period of up to 20 business days for responses to general support queries and up to 30 business days for the evaluation and assessment of project studies, because all tutorial support requests are answered strictly within the order in which they are received. This does not include weekends or public holidays. Consequently you need to put some thought into the management of your tutorial support procedure in order to ensure that your study plan is feasible and to obtain the maximum possible benefit from tutorial support during your period of study. Please retain copies of your tutorial support emails for future reference. Please ensure that ALL of your tutorial support emails are set out using the format as suggested within your guide to tutorial support. Your tutorial support emails need to be referenced clearly to the specific part of the course manual or project study which you are working on at any given time. You also need to list and number any questions that you would like to ask, up to a maximum of five questions within each tutorial support email. Remember the more specific you can be with your questions the more specific your answers will be too and this will help you to avoid any unnecessary misunderstanding, misinterpretation, or duplication. The guide to tutorial support is intended to help you to understand how and when to use support in order to ensure that you get the most out of your training program. Appleton Greene training programs are designed to enable you to do things for yourself. They provide you with a structure or a framework and we use tutorial support to facilitate students while they practically implement what they learn. In other words, we are enabling students to do things for themselves. The benefits of distance learning via facilitation are considerable and are much more sustainable in the long-term than traditional short-term knowledge sharing programs. Consequently you should learn how and when to use tutorial support so that you can maximize the benefits from your learning experience with Appleton Greene. This guide describes the purpose of each training function and how to use them and how to use tutorial support in relation to each aspect of the training program. It also provides useful tips and guidance with regard to best practice.
Tutorial Support Tips
Students are often unsure about how and when to use tutorial support with Appleton Greene. This Tip List will help you to understand more about how to achieve the most from using tutorial support. Refer to it regularly to ensure that you are continuing to use the service properly. Tutorial support is critical to the success of your training experience, but it is important to understand when and how to use it in order to maximize the benefit that you receive. It is no coincidence that those students who succeed are those that learn how to be positive, proactive and productive when using tutorial support.
Be positive and friendly with your tutorial support emails
Remember that if you forward an email to the tutorial support unit, you are dealing with real people. “Do unto others as you would expect others to do unto you”. If you are positive, complimentary and generally friendly in your emails, you will generate a similar response in return. This will be more enjoyable, productive and rewarding for you in the long-term.
Think about the impression that you want to create
Every time that you communicate, you create an impression, which can be either positive or negative, so put some thought into the impression that you want to create. Remember that copies of all tutorial support emails are stored electronically and tutors will always refer to prior correspondence before responding to any current emails. Over a period of time, a general opinion will be arrived at in relation to your character, attitude and ability. Try to manage your own frustrations, mood swings and temperament professionally, without involving the tutorial support team. Demonstrating frustration or a lack of patience is a weakness and will be interpreted as such. The good thing about communicating in writing, is that you will have the time to consider your content carefully, you can review it and proof-read it before sending your email to Appleton Greene and this should help you to communicate more professionally, consistently and to avoid any unnecessary knee-jerk reactions to individual situations as and when they may arise. Please also remember that the CLP Tutorial Support Unit will not just be responsible for evaluating and assessing the quality of your work, they will also be responsible for providing recommendations to other learning providers and to client contacts within the Appleton Greene global client network, so do be in control of your own emotions and try to create a good impression.
Remember that quality is preferred to quantity
Please remember that when you send an email to the tutorial support team, you are not using Twitter or Text Messaging. Try not to forward an email every time that you have a thought. This will not prove to be productive either for you or for the tutorial support team. Take time to prepare your communications properly, as if you were writing a professional letter to a business colleague and make a list of queries that you are likely to have and then incorporate them within one email, say once every month, so that the tutorial support team can understand more about context, application and your methodology for study. Get yourself into a consistent routine with your tutorial support requests and use the tutorial support template provided with ALL of your emails. The (CLP) Tutorial Support Unit will not spoon-feed you with information. They need to be able to evaluate and assess your tutorial support requests carefully and professionally.
Be specific about your questions in order to receive specific answers
Try not to write essays by thinking as you are writing tutorial support emails. The tutorial support unit can be unclear about what in fact you are asking, or what you are looking to achieve. Be specific about asking questions that you want answers to. Number your questions. You will then receive specific answers to each and every question. This is the main purpose of tutorial support via email.
Keep a record of your tutorial support emails
It is important that you keep a record of all tutorial support emails that are forwarded to you. You can then refer to them when necessary and it avoids any unnecessary duplication, misunderstanding, or misinterpretation.
Individual training workshops or telephone support
Please be advised that Appleton Greene does not provide separate or individual tutorial support meetings, workshops, or provide telephone support for individual students. Appleton Greene is an equal opportunities learning and service provider and we are therefore understandably bound to treat all students equally. We cannot therefore broker special financial or study arrangements with individual students regardless of the circumstances. All tutorial support is provided online and this enables Appleton Greene to keep a record of all communications between students, professors and tutors on file for future reference, in accordance with our quality management procedure and your terms and conditions of enrolment. All tutorial support is provided online via email because it enables us to have time to consider support content carefully, it ensures that you receive a considered and detailed response to your queries. You can number questions that you would like to ask, which relate to things that you do not understand or where clarification may be required. You can then be sure of receiving specific answers to each individual query. You will also then have a record of these communications and of all tutorial support, which has been provided to you. This makes tutorial support administration more productive by avoiding any unnecessary duplication, misunderstanding, or misinterpretation.
Tutorial Support Email Format
You should use this tutorial support format if you need to request clarification or assistance while studying with your training program. Please note that ALL of your tutorial support request emails should use the same format. You should therefore set up a standard email template, which you can then use as and when you need to. Emails that are forwarded to Appleton Greene, which do not use the following format, may be rejected and returned to you by the (CLP) Program Administration Manager. A detailed response will then be forwarded to you via email usually within 20 business days of receipt for general support queries and 30 business days for the evaluation and assessment of project studies. This does not include weekends or public holidays. Your tutorial support request, together with the corresponding TSU reply, will then be saved and stored within your electronic TSU file at Appleton Greene for future reference.
Subject line of your email
Please insert: Appleton Greene (CLP) Tutorial Support Request: (Your Full Name) (Date), within the subject line of your email.
Main body of your email
Please insert:
1. Appleton Greene Certified Learning Provider (CLP) Tutorial Support Request
2. Your Full Name
3. Date of TS request
4. Preferred email address
5. Backup email address
6. Course manual page name or number (reference)
7. Project study page name or number (reference)
Subject of enquiry
Please insert a maximum of 50 words (please be succinct)
Briefly outline the subject matter of your inquiry, or what your questions relate to.
Question 1
Maximum of 50 words (please be succinct)
Maximum of 50 words (please be succinct)
Question 3
Maximum of 50 words (please be succinct)
Question 4
Maximum of 50 words (please be succinct)
Question 5
Maximum of 50 words (please be succinct)
Please note that a maximum of 5 questions is permitted with each individual tutorial support request email.
Procedure
* List the questions that you want to ask first, then re-arrange them in order of priority. Make sure that you reference them, where necessary, to the course manuals or project studies.
* Make sure that you are specific about your questions and number them. Try to plan the content within your emails to make sure that it is relevant.
* Make sure that your tutorial support emails are set out correctly, using the Tutorial Support Email Format provided here.
* Save a copy of your email and incorporate the date sent after the subject title. Keep your tutorial support emails within the same file and in date order for easy reference.
* Allow up to 20 business days for a response to general tutorial support emails and up to 30 business days for the evaluation and assessment of project studies, because detailed individual responses will be made in all cases and tutorial support emails are answered strictly within the order in which they are received.
* Emails can and do get lost. So if you have not received a reply within the appropriate time, forward another copy or a reminder to the tutorial support unit to be sure that it has been received but do not forward reminders unless the appropriate time has elapsed.
* When you receive a reply, save it immediately featuring the date of receipt after the subject heading for easy reference. In most cases the tutorial support unit replies to your questions individually, so you will have a record of the questions that you asked as well as the answers offered. With project studies however, separate emails are usually forwarded by the tutorial support unit, so do keep a record of your own original emails as well.
* Remember to be positive and friendly in your emails. You are dealing with real people who will respond to the same things that you respond to.
* Try not to repeat questions that have already been asked in previous emails. If this happens the tutorial support unit will probably just refer you to the appropriate answers that have already been provided within previous emails.
* If you lose your tutorial support email records you can write to Appleton Greene to receive a copy of your tutorial support file, but a separate administration charge may be levied for this service.
How To Study

Your Certified Learning Provider (CLP) and Accredited Consultant can help you to plan a task list for getting started so that you can be clear about your direction and your priorities in relation to your training program. It is also a good way to introduce yourself to the tutorial support team.
Planning your study environment
Your study conditions are of great importance and will have a direct effect on how much you enjoy your training program. Consider how much space you will have, whether it is comfortable and private and whether you are likely to be disturbed. The study tools and facilities at your disposal are also important to the success of your distance-learning experience. Your tutorial support unit can help with useful tips and guidance, regardless of your starting position. It is important to get this right before you start working on your training program.
Planning your program objectives
It is important that you have a clear list of study objectives, in order of priority, before you start working on your training program. Your tutorial support unit can offer assistance here to ensure that your study objectives have been afforded due consideration and priority.
Planning how and when to study
Distance-learners are freed from the necessity of attending regular classes, since they can study in their own way, at their own pace and for their own purposes. This approach is designed to let you study efficiently away from the traditional classroom environment. It is important however, that you plan how and when to study, so that you are making the most of your natural attributes, strengths and opportunities. Your tutorial support unit can offer assistance and useful tips to ensure that you are playing to your strengths.
Planning your study tasks
You should have a clear understanding of the study tasks that you should be undertaking and the priority associated with each task. These tasks should also be integrated with your program objectives. The distance learning guide and the guide to tutorial support for students should help you here, but if you need any clarification or assistance, please contact your tutorial support unit.
Planning your time
You will need to allocate specific times during your calendar when you intend to study if you are to have a realistic chance of completing your program on time. You are responsible for planning and managing your own study time, so it is important that you are successful with this. Your tutorial support unit can help you with this if your time plan is not working.
Keeping in touch
Consistency is the key here. If you communicate too frequently in short bursts, or too infrequently with no pattern, then your management ability with your studies will be questioned, both by you and by your tutorial support unit. It is obvious when a student is in control and when one is not and this will depend how able you are at sticking with your study plan. Inconsistency invariably leads to in-completion.
Charting your progress
Your tutorial support team can help you to chart your own study progress. Refer to your distance learning guide for further details.
Making it work
To succeed, all that you will need to do is apply yourself to undertaking your training program and interpreting it correctly. Success or failure lies in your hands and your hands alone, so be sure that you have a strategy for making it work. Your Certified Learning Provider (CLP) and Accredited Consultant can guide you through the process of program planning, development and implementation.
Reading methods
Interpretation is often unique to the individual but it can be improved and even quantified by implementing consistent interpretation methods. Interpretation can be affected by outside interference such as family members, TV, or the Internet, or simply by other thoughts which are demanding priority in our minds. One thing that can improve our productivity is using recognized reading methods. This helps us to focus and to be more structured when reading information for reasons of importance, rather than relaxation.
Speed reading
When reading through course manuals for the first time, subconsciously set your reading speed to be just fast enough that you cannot dwell on individual words or tables. With practice, you should be able to read an A4 sheet of paper in one minute. You will not achieve much in the way of a detailed understanding, but your brain will retain a useful overview. This overview will be important later on and will enable you to keep individual issues in perspective with a more generic picture because speed reading appeals to the memory part of the brain. Do not worry about what you do or do not remember at this stage.
Content reading
Once you have speed read everything, you can then start work in earnest. You now need to read a particular section of your course manual thoroughly, by making detailed notes while you read. This process is called Content Reading and it will help to consolidate your understanding and interpretation of the information that has been provided.
Making structured notes on the course manuals
When you are content reading, you should be making detailed notes, which are both structured and informative. Make these notes in a MS Word document on your computer, because you can then amend and update these as and when you deem it to be necessary. List your notes under three headings: 1. Interpretation – 2. Questions – 3. Tasks. The purpose of the 1st section is to clarify your interpretation by writing it down. The purpose of the 2nd section is to list any questions that the issue raises for you. The purpose of the 3rd section is to list any tasks that you should undertake as a result. Anyone who has graduated with a business-related degree should already be familiar with this process.
Organizing structured notes separately
You should then transfer your notes to a separate study notebook, preferably one that enables easy referencing, such as a MS Word Document, a MS Excel Spreadsheet, a MS Access Database, or a personal organizer on your cell phone. Transferring your notes allows you to have the opportunity of cross-checking and verifying them, which assists considerably with understanding and interpretation. You will also find that the better you are at doing this, the more chance you will have of ensuring that you achieve your study objectives.
Question your understanding
Do challenge your understanding. Explain things to yourself in your own words by writing things down.
Clarifying your understanding
If you are at all unsure, forward an email to your tutorial support unit and they will help to clarify your understanding.
Question your interpretation
Do challenge your interpretation. Qualify your interpretation by writing it down.
Clarifying your interpretation
If you are at all unsure, forward an email to your tutorial support unit and they will help to clarify your interpretation.
Qualification Requirements
The student will need to successfully complete the project study and all of the exercises relating to the Actualizing NetZero corporate training program, achieving a pass with merit or distinction in each case, in order to qualify as an Accredited Actualizing NetZero Specialist (AANZS). All monthly workshops need to be tried and tested within your company. These project studies can be completed in your own time and at your own pace and in the comfort of your own home or office. There are no formal examinations, assessment is based upon the successful completion of the project studies. They are called project studies because, unlike case studies, these projects are not theoretical, they incorporate real program processes that need to be properly researched and developed. The project studies assist us in measuring your understanding and interpretation of the training program and enable us to assess qualification merits. All of the project studies are based entirely upon the content within the training program and they enable you to integrate what you have learnt into your corporate training practice.
Actualizing NetZero – Grading Contribution
Project Study – Grading Contribution
Customer Service – 10%
E-business – 05%
Finance – 10%
Globalization – 10%
Human Resources – 10%
Information Technology – 10%
Legal – 05%
Management – 10%
Marketing – 10%
Production – 10%
Education – 05%
Logistics – 05%
TOTAL GRADING – 100%
Qualification grades
A mark of 90% = Pass with Distinction.
A mark of 75% = Pass with Merit.
A mark of less than 75% = Fail.
If you fail to achieve a mark of 75% with a project study, you will receive detailed feedback from the Certified Learning Provider (CLP) and/or Accredited Consultant, together with a list of tasks which you will need to complete, in order to ensure that your project study meets with the minimum quality standard that is required by Appleton Greene. You can then re-submit your project study for further evaluation and assessment. Indeed you can re-submit as many drafts of your project studies as you need to, until such a time as they eventually meet with the required standard by Appleton Greene, so you need not worry about this, it is all part of the learning process.
When marking project studies, Appleton Greene is looking for sufficient evidence of the following:
Pass with merit
A satisfactory level of program understanding
A satisfactory level of program interpretation
A satisfactory level of project study content presentation
A satisfactory level of Unique Program Proposition (UPP) quality
A satisfactory level of the practical integration of academic theory
Pass with distinction
An exceptional level of program understanding
An exceptional level of program interpretation
An exceptional level of project study content presentation
An exceptional level of Unique Program Proposition (UPP) quality
An exceptional level of the practical integration of academic theory
Preliminary Analysis

In order to prepare for the second workshop in the Actualizing Net Zero Program, participants should:
Energy Costs
Have the energy invoices for the past 12 months (electricity, natural gas, others)
Have the energy contracts from your energy providers
Systems
Have a high level understanding of your energy systems for heating, cooling and power requirements. Which systems are “critical” for continued business operations and which systems can be curtailed in an emergency
Have a high level understanding of your building management system, the data it collects and how this data is used for automation or reporting
Have an understanding of the data that is NOT being collected but is required to better understand the efficiency of your energy systems
Previous Work
Have an understanding of the current condition of your energy consumers (HVAC, building systems)
Have an understanding of your building management system (BMS), its capabilities and limitations
Materials for Review
Review some short videos on the Actualizing Net Zero program at our YouTube channel https://www.youtube.com/@markchidwick1329
Review the spectrum of technologies that are available on the market at https://www.enermetrics.ca/technologies
Understanding the Importance of an Investment Grade Energy Audit https://www.enermetrics.ca/post/understanding-the-importance-of-investment-grade-energy-audits
Course Manuals 1-12

Course Manual 1: Units of Measure
For the exercises in this workshop, a convenient excel workbook can be downloaded here
In the fields of sustainability and energy management, energy is a basic idea. Measuring it is essential for keeping an eye on consumption, assessing effectiveness, and putting sustainable strategies into action. There are several ways to measure energy, and each has its own use and context. The definitions, uses, and conversion factors of the most widely used energy units of measurement are all covered in detail in this workshop.
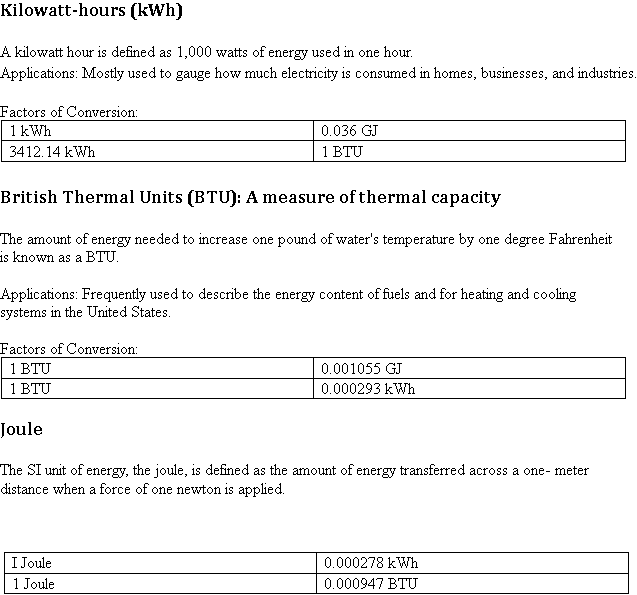
Applications: Often used to measure all types of energy and in scientific contexts. Factors of Conversion:
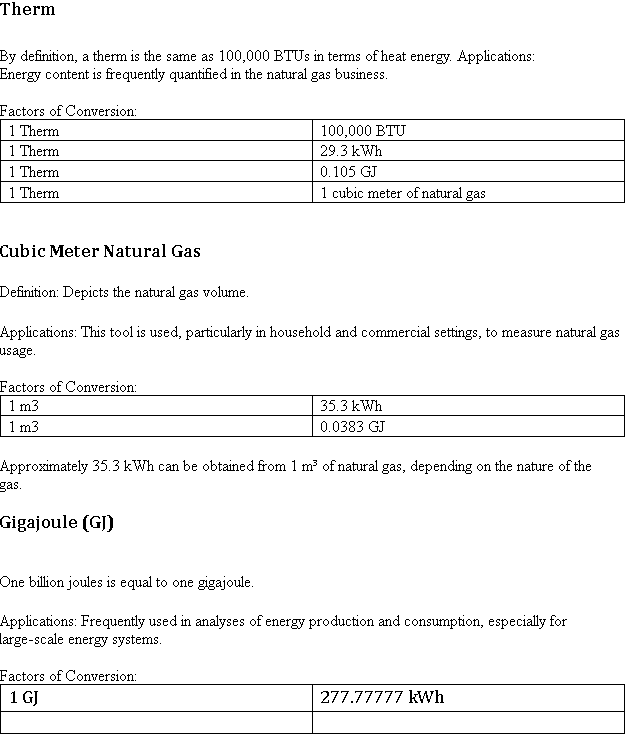
Quad
Definition: A quadrillion (10^15) BTUs is known as a quad.
![]()
Applications: Measures large-scale energy production and consumption in the United States. Factors of Conversion:
Relationships and Conversion
Energy management requires an understanding of how these components relate to one another. For instance, converting between kWh and BTU is frequently done while assessing the effectiveness of heating and cooling systems. The conversion factor from kWh to BTU is
3,412.14. In contrast, you must divide BTU by 3,412.14 in order to convert BTU to kWh. Similar to this, joules can be divided by 3.6 million to convert to kWh, which reflects the huge amount of joules used in regular energy measurements.
Uses in Diverse Industries
Certain units are preferred by different sectors according to their operational environment and local norms:
Residential and Commercial Structures:
Units of preference: kWh and Therms
Usage: The unit of measurement for natural gas usage is either GJ, cubic meters, whereas electricity bills usually use kWh.
Industrial:
Preferred Measures: BTU, kWh, and GJ
Usage: Depending on the energy source and process requirements, industrial facilities frequently utilize a combination of units.
Scientific Investigations:
Joules, Kilojoules (kJ), and Megajoules (MJ) are the preferred units.
Use: The SI units are used in scientific computations and experiments to ensure uniformity and accuracy.
Production of Energy:
Preferred Measures: TWh, GJ, and Quads
Usage: These units are frequently used in large-scale energy production processes, such as national energy statistics.
Sustainability and Energy Management: The Significance
For energy management and sustainability, precise measurement and comprehension of energy units are essential. Organizations can compare and convert units to:
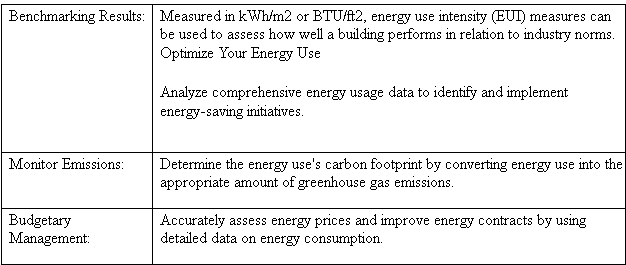
Conclusion:
Measurement units for energy are crucial instruments in the field of energy management. Accurate energy consumption monitoring, reporting, and optimization are made possible by an understanding of these units, their uses, and conversion factors. Organizations can improve their energy efficiency, cut expenses, and advance sustainability goals by utilizing this knowledge.

Exercise 1:

Course Manual 2: Value of Interval Data
Introduction
A basic feature of modern living is electricity consumption; so, the change to a more energy- efficient and environmentally sustainable future mostly hinges on our understanding and control of this use. Interval electricity data – that is, the comprehensive, time-sequenced data gathered by smart meters or other measurement systems—is one effective instrument for controlling energy use. Interval data tracks electricity use at regular intervals, frequently in increments as small as 15 minutes, unlike conventional monthly or annual meter readings, so offering extensive insights into consumption trends.
Improving energy efficiency, lowering prices, minimizing greenhouse gas emissions, and guaranteeing energy security depend on this detailed data. The significance of interval electricity data, its benefits, its part in energy management, and its collecting and management practices are discussed in this paper. We also look at the difficulties gathering interval data and offer actual case studies of its use.
Definition and Compilation:
Interval Data: Electricity consumption measurements taken at regular intervals (e.g., 15-minute, 30-minute, hourly).
Methods of Collection:
Interval data is usually collected via smart meters, sub-meters, and advanced metering infrastructure (AMI).
Resolution:
High-Resolution Data: Enables more accurate energy management by offering comprehensive insights into usage trends.
Frequency:
Data can be gathered anywhere from once every few seconds to once every hour, depending on the infrastructure.
Benefits of interval electricity data
Targeted Understanding of Energy Consumption
Interval power data offers a very detailed view of daily energy consumption and helps one understand consumption patterns at several times. This lets users and utilities spot trends in power consumption that would not be apparent from conventional monthly billing statistics. Users can see low-consumption hours and peak usage periods, for instance, which helps to more efficiently manage electrical demand. When it comes to energy-saving techniques, this level of detail helps to make decisions more wise.
Cost Reduction
The possibility to lower energy expenses is among the most important advantages of interval electricity data. Residential and commercial users can adjust their energy consumption practices to benefit from reduced rates during off-peak times by knowing almost real-time data on
electricity use. With interval data, dynamic pricing models—such as time-of- usage (TOU) rates—become more feasible so that customers may move high-demand activities (e.g., running heavy machinery or charging electric vehicles) to periods when electricity is cheaper.
Interval data also helps utilities maximize grid operations and lower the demand for costly infrastructure expenditures. More precisely knowing consumption patterns can help utilities manage supply and demand, hence lowering the necessity for expensive peak-time power generation.
Reducing Emissions
Reducing carbon emissions connected with power usage is a crucial component in switching to a greener energy system. By providing insights into when energy consumption is highest, interval electricity data encourages customers to adjust their use to times when the grid is run on greener energy sources, such wind or solar. Moreover, smart networks depending on interval data can maximize energy use to lower dependency on power plants derived from fossil fuels during periods of maximum demand, thereby helping to reduce the total carbon emissions.
Improved Energy Security
Given growing demand and a growing reliance on intermittent renewable energy sources like wind and solar, energy security—the dependable supply of electricity—is ever more vital.
Through enabling utilities to forecast and control demand surges, interval data is essential in enhancing energy security. This lowers the risk of blackouts or brownouts and helps to run more effectively the grid. Moreover, interval data helps to integrate distributed energy resources (DERs) such as batteries and solar panels into the grid, therefore strengthening system stability and resilience.
Demand Response
Demand response programs—in which consumers are urged to cut or change their energy consumption during periods of great demand—rely on interval electricity data to be successful. Monitoring real-time usage allows utilities to notify consumers to lower demand when the grid is stressed, therefore helping to avert the necessity for further, usually less efficient power plants to come on line. In return, customers might get financial incentives, therefore lowering consumer and utility expenses as well as enhancing grid dependability.
Managing Interval Electricity Data
Managing interval power data calls for a complete infrastructure involving analytical tools, smart meters, data storage systems, and communication networks. Usually used to gather interval data, smart meters send real-time information to the utility across safe communication channels. But the sheer volume of data produced—often millions of data points daily for big utilities—requests strong data storage and management solutions.
Data Collection
Usually every 15 minutes or half an hour, smart meters—the foundation of interval data collecting—continuously record electrical consumption at predefined intervals. These meters provide almost real-time data to consumers and utilities by means of wireless, cellular, or
powerline communication networks, therefore interacting with central systems. In regions with advanced metering infrastructure (AMI), meters can additionally track more metrics including voltage levels and power quality, therefore providing more information on grid condition.
Data Processing and Storage
Smart meters produce enormous amounts of data that need for strong computing systems for processing and enough storage space. Because of their dependability and scalability, cloud-based solutions are increasingly applied for this aim. After that, data processing technologies arrange and examine the information to generate insightful analysis ready for use. By automatically spotting trends, anomalies, and patterns, these instruments help utilities decide how to manage their grids and consumers will be better aware of their usage.
Visualisation and Analytics
The usefulness of interval data comes from its capacity for analysis and visualization as much as from its gathering. Using this data, advanced analytics systems can estimate energy consumption, spot equipment breakdowns before they cause outages, and find inefficiencies.
Heat maps, dashboards, and simple-to-understand graphs made possible by visualization technologies let utilities and consumers view real-time energy consumption and react.
Difficulties gathering and organizing interval data
Although interval power data has many benefits, its collecting and handling present difficulties.
Infrastructure Costs
Install smart meters and the required communication systems, and you pay big upfront expenses. Utilities have to make investments in metering devices, communication infrastructure, and data storage systems needed to manage the enormous number of created data. Especially for smaller utilities or in areas with antiquated infrastructure, these expenses can be prohibitive.
Privacy and Security of Data
Tight data privacy and security policies follow from the gathering of comprehensive electricity use data. If handled improperly, interval data could expose private details about household activities including when people are away, asleep, or home. Privacy advocates have expressed worries about this, which led to the creation of rules meant to safeguard customer data.
Another important problem is security since data communication networks and smart meters might be targets for cyberattacks. Strong cybersecurity is absolutely necessary since illegal access to interval data or control over smart meters could cause grid interruptions or other harmful actions.
Data Management Complexity
The huge number of data interval meters provide is a major obstacle. Utilities have to be able to process, save, and examine terabytes of daily produced data. Dealing with this data calls for sophisticated algorithms and analytics tools able to sort large volumes of data in search of pertinent information. Smaller utilities may find this especially difficult since the tools required for efficient data management could be absent.
Consumer Engagement
Consumers might not always interact with detailed interval data meaningfully even with that availability. Many customers are not sure how to understand energy statistics or change their behavior to cut expenses and consumption. Effective teaching and simple tools help to fully realize the possible advantages of interval data.
Interval Data Examples
Demand Response Systems
Programs like the Demand Response Auction Mechanism (CAISO) in the United States use interval electricity data to control grid dependability during times of great demand. Under these schemes, depending on real-time grid conditions, residential and commercial consumers lower their electricity usage as alerted. Compliance and performance are tracked using interval data, which guarantees consumer incentive for their involvement.
Dynamic Pricing Models
Time-of- usage (TOU) pricing plans have been put in place by utilities including Ontario Power Generation whereby consumers pay various rates for power based on the time of day. Interval electricity data lets consumers move their consumption to off-peak times when power is less expensive, therefore lowering their energy bills. By flattening demand peaks, this also benefits the utility by lessening the demand on the grid and so the need for costly, carbon-intensive peak power plants is decreased.
Energy Efficiency in Commercial Buildings
Big commercial structures like New York City’s Empire State Building have tracked and cut their energy use using interval data. Through data analysis, the building’s energy management staff found inefficiencies and instituted fixes including switching to more effective HVAC systems and modifying heating and cooling schedules to fit occupancy patterns. Significant cost savings and pollution reductions have come from these developments.
Integrating Renewable Energy
In areas like Germany’s Energiewende where renewable energy is starting to take front stage on the grid, interval data is essential in balancing supply and demand. Real-time information on electricity demand helps utilities better control the fluctuation of renewable energy sources as solar and wind. Interval data lets grid operators forecast when demand is likely to increase and decrease and modify the supply of renewable energy.
Reducing Energy Costs and Emissions with Interval Data
Real-time Consumption Monitoring
Interval data lets consumers track their energy consumption in real-time, therefore enabling quick changes to lower consumption during peak hours or when electricity is more costly. Real- time input of this kind can inspire behavioral changes include turning off appliances in moments of high demand or modifying thermostat settings.
Load shifting
Load shifting—moving energy-intensive activities to times of less demand—is one of the best
ways to cut energy expenses. Interval data helps consumers and companies to see when these low-demand times arise, therefore enabling them to maximize their energy use. Industrial establishments, for instance, can change production plans to off-peak times, therefore lowering the general demand on the grid and energy costs.
Linking with Renewable Energy
Integrated renewable energy sources make interval data even more important. It helps utilities more effectively control the intermittent character of renewable energy sources such solar and wind. For example, by studying interval data could help a utility decide whether to release extra renewable energy produced during low demand periods during peak times, therefore lessening dependency on fossil fuels.
Emissions Reduction
Finding times when renewable energy is plentiful allows customers to modify their use to cut dependency on fossil fuels, therefore minimizing their carbon footprint. For instance, users might modify their plans to run appliances or charge electric vehicles during the early afternoon if interval data indicates that solar energy is producing an excess. This strategy can help to maximize the usage of renewable energy, hence lowering greenhouse gas emissions.
Conclusion
Improving energy management, lowering expenses, and advancing environmental sustainability all depend on interval electricity data—a priceless instrument. Its thorough understanding enables consumers and utilities both to decide when and how best to use electricity. Interval data has the potential to propel notable improvements in energy efficiency, emissions reductions, and energy security by allowing one to lower peak demand, change consumption patterns, and more efficiently integrate renewable energy.
But only until these issues of infrastructure costs, data privacy, security, and customer involvement are resolved will interval electricity data fully realize its promise. Overcoming these challenges allows us to use interval data to create a more robust and sustainable energy future.
The collection of electricity interval data, which records energy use at brief but regular intervals (every 15 minutes, hour, or second), is an essential part of managing and optimizing energy use. When compared to standard monthly or bi-monthly billing data, this fine-grained data offers insights that are far more insightful. The importance of power interval data is tremendous as the globe shifts to more sustainable energy sources. The many advantages of interval data are examined in this essay, including increased demand responsiveness, cost savings, increased energy efficiency, greater forecasting, and its contribution to the advancement of smart grid technology and the integration of renewable energy sources.
Case Study
Ski Resort
A ski resort in Alberta Canada was interested in lowering their energy costs which were primarily driven by peak demand charges. In the winter months, the ski resort utilized large pumps for snow making, driving their peak demand to 5MW as shown in the charts below.
The electricity consumption charts on the left show the total monthly electricity consumption which does not take into account the hourly interval data. This suggests the peak demand is less than 2500 kW. However, when we use the hourly interval data, we can see that the peak power is actually 5000 kW.
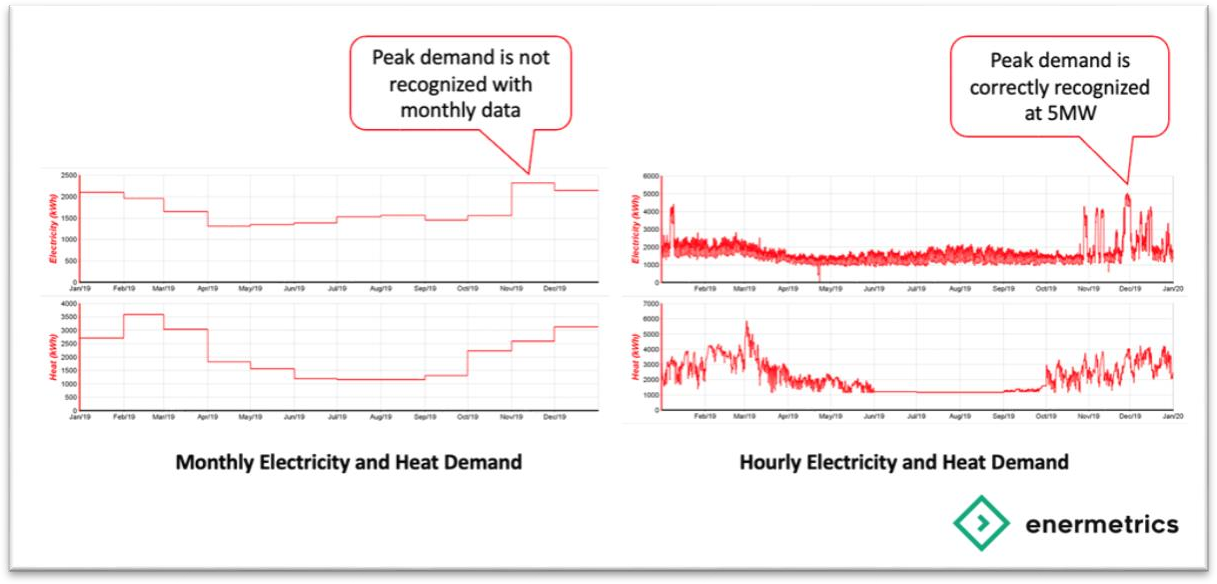
An engineering firm used the monthly data to forecast the financial value of three CHP’s to generate onsite
power – but this showed very poor financial performance.
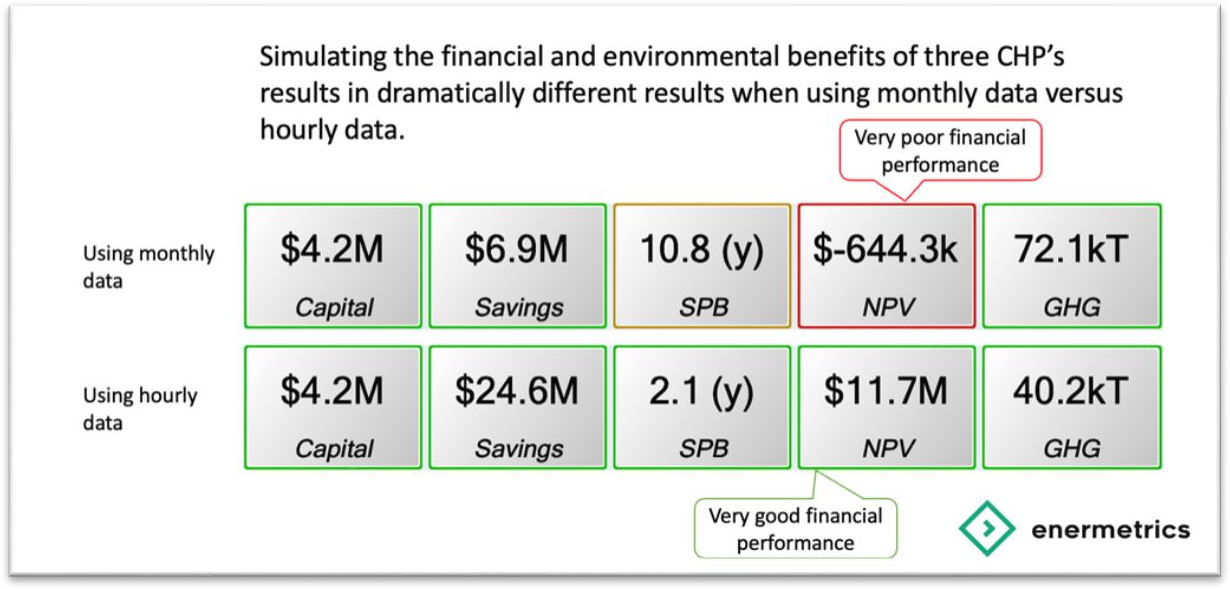
However, when the interval data was used with the same CHP model, we can see a substantial improvement in the financial metrics. This demonstrates the importance of using detailed interval data when modelling the financial value of energy technologies.
Further, when looking at the risk profile, we can see that using monthly data also suggests that the CHP project has a high risk for the forecasted electricity rates. But when using the hourly data, we see that the risk profile is actually quite a bit lower.
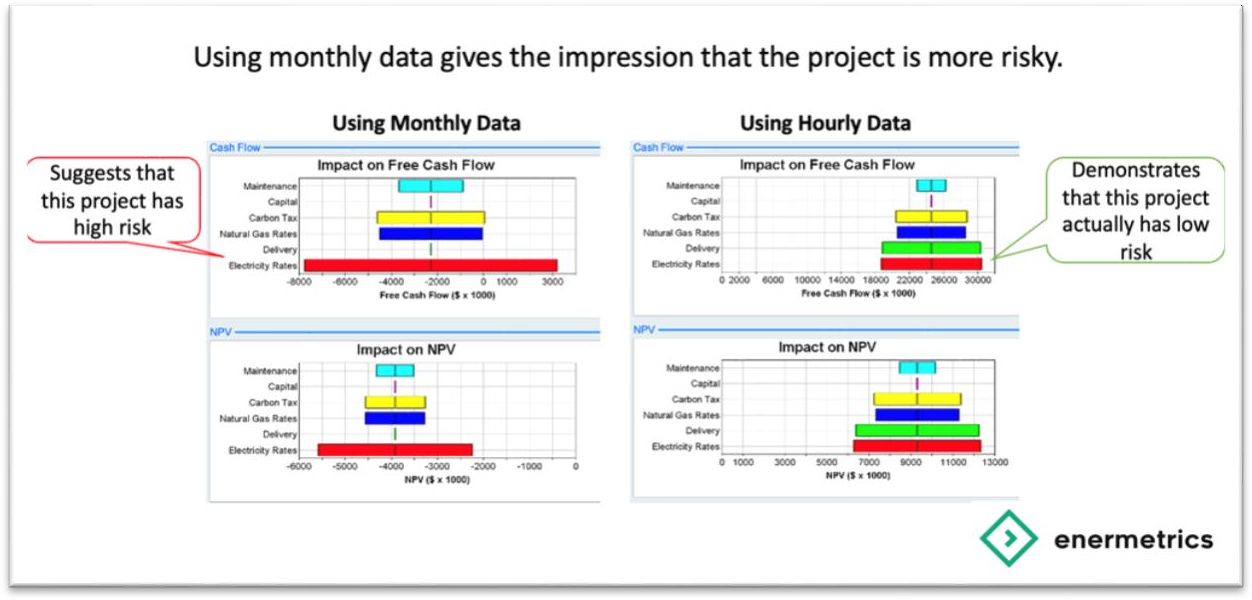
Case Study: Demand Response Programs
A large number of commercial facilities take part in demand response programs, using interval data to lower consumption during peak hours and receive rewards.
In this case study, we will provide you with an overview of the Operating Reserve Market in Alberta. We’ll cover who can participate in the market, how it works, the frequency and duration of curtailment periods, current rates, the benefits of using an aggregator, and who should consider participating in the Operating Reserve Market.
What is the Operating Reserve Market for Alberta’s electricity grid?
The Operating Reserve Market serves as a crucial mechanism to ensure the reliability and stability of Alberta’s electricity grid. It functions as a safety net by maintaining a pool of resources that can be called upon when unexpected events or emergencies affect the balance of supply and demand.
Who can participate in the Operating Reserve Market?
Various entities have the opportunity to participate in the Operating Reserve Market in Alberta. This includes power generators, energy consumers, and aggregators. Industrial facilities, institutional facilities, and commercial facilities that have onsite energy generation capabilities can actively contribute to the market. Additionally, anyone who can curtail electricity with short notice or has a backup generator can also participate.
How does the Operating Reserve Market work?
When there is an unforeseen increase in electricity demand or a sudden decrease in supply, the grid operator relies on the Operating Reserve Market to swiftly balance the system. Participants in the market may receive a call to curtail their electricity
consumption or increase their generation to meet the demand. This real-time response helps maintain stability and reliability in the grid.
How many times will I get a call to curtail electricity?
The frequency of curtailment calls can vary depending on grid conditions and individual participant capacity. On average, participants in the Operating Reserve Market receive around 23 curtailment calls per year.
How long do curtailment periods last?
Curtailment periods can vary in duration based on the specific circumstances and grid conditions. Historical data from 2019 to 2022 shows that each curtailment period lasted between 1 and 71 minutes on average. It’s essential for participants to be prepared to respond promptly during these periods.
Current rates for market participants
The rates for participants in the Operating Reserve Market vary and are subject to market conditions. It is recommended to review the official website of the Alberta Electric System Operator (AESO) or consult with experts in the field for up-to-date information regarding the rates (link)
What is a typical simple payback for an onsite generator?
The simple payback period for an onsite generator, considering participation in the Operating Reserve Market, can vary based on factors such as generator size, facility electricity consumption, and market conditions. On average, a typical simple payback period ranges from 3 to 7 years. This payback period takes into account the revenue generated from market participation and the savings gained through reduced energy consumption.
Aggregators for the Operating Reserves Market
Aggregators play a vital role in the Operating Reserve Market by facilitating the participation of multiple smaller resources. Utilizing an aggregator offers several benefits for participants. One significant advantage of using an aggregator is the reduced risk for market participants. Aggregators provide guarantees to the AESO, streamlining the participation process and minimizing individual participant exposure. Additionally, aggregators offer market insights, analytics, and expertise that can optimize participant performance.
Cost of using an aggregator
The cost of using an aggregator can vary depending on the specific services provided and the size of the participant’s operation. Participants should consider evaluating the benefits and value-add provided by the aggregator against the associated costs to make an informed decision.
Who should consider participating in the Operating Reserves Market?
Industrial facilities, institutional facilities, commercial facilities, and anyone with the ability to curtail electricity with short notice or possessing backup generators should
strongly consider participating in the Operating Reserve Market. Participation offers financial benefits, contributes to grid stability, and enhances the overall energy management of Alberta.
In conclusion, the Operating Reserve Market in Alberta plays a critical role in ensuring the reliability and stability of the electricity grid. By participating in the market, entities can contribute to grid stability, optimize their energy management, and potentially generate additional revenue. Industrial, institutional, and commercial facilities, as well as those with the ability to curtail electricity or utilize onsite energy generation, should seriously consider taking part in this market.
Exercise 2: Interval Data
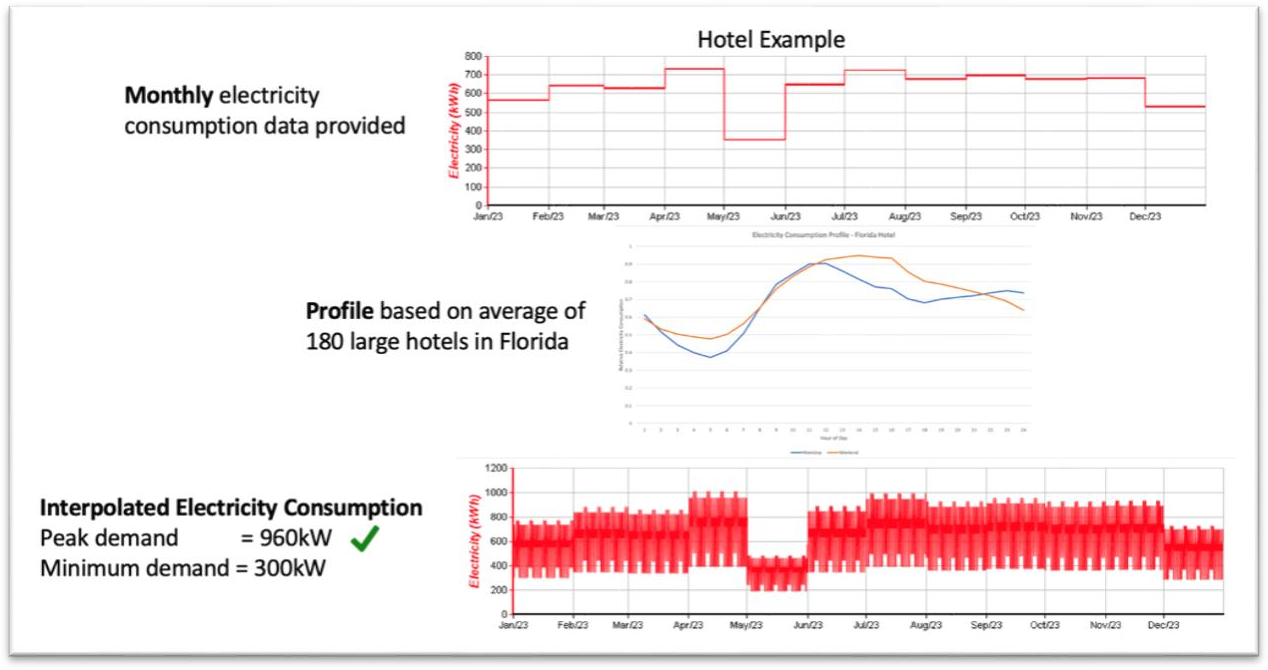

Course Manual 3: Understanding Electricity Costs
In this module, we will develop an understanding of the scope of the energy and carbon problem. We will investigate the current energy costs and develop and understanding of the key issues that impact energy costs.
We will review the current energy costs and identify those areas that have the highest potential for improvement. The first step in reducing costs and emissions is to improve energy cost efficiency. Changing operational processes to operate the facility more efficiently is often the easiest first step.
We will identify the risks and constraints for energy systems. Each location has energy advantages as well as constraints that will limit solution options. We will develop an understanding of the regional energy advantages and explore case studies where these advantages have been successful.
Introduction
For consumers in the residential, commercial, and industrial sectors, electricity expenditures make up a sizeable portion of operating costs. Comprehending the complexities associated with power expenses is imperative for proficient energy management and cost minimization. The several components that make up an electricity bill each represent a distinct facet of the production, transmission, distribution, and consumption of power. This essay seeks to give readers a thorough grasp of energy prices, including information on the primary billing components, factors that affect these costs, and practical management and reduction techniques.
Components of Electricity Costs
The three primary components of electricity expenses are consumption charges, demand charges, and fixed charges.
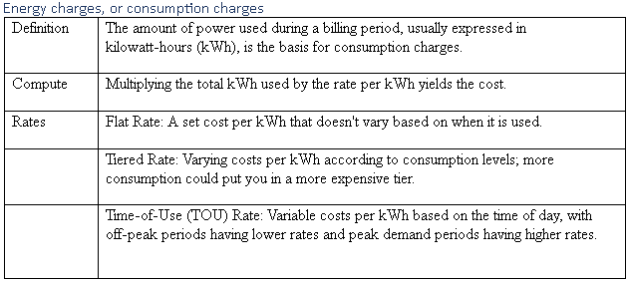
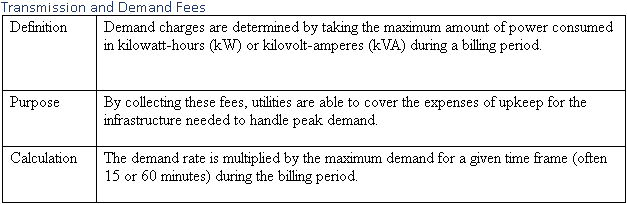
Consumer electricity expenses are determined not only by the energy utilized but also by other levies including demand and transmission fees. Essential elements of utility pricing systems, these charges support the consistent delivery of electricity from power plants to end consumers. Although both fees pertain to the infrastructure supporting the distribution of power, their goals, computation, and impact vary. Knowing these prices will enable customers and companies to decide how much electricity they use wisely and help to lower general expenses.
Transmission Fees
From generation facilities to substations, where the electricity is subsequently delivered to homes and businesses, transmission fees are the costs related with the cost of moving electricity across high-voltage power lines. Covering the building, running, and maintenance of the transmission grid—a vast and expensive infrastructure—these tolls pay for
Even during times of high demand, utilities have to create and keep this infrastructure to guarantee a consistent and dependable supply of electricity. Though they are usually listed on the electricity bill, transmission fees are often included into total prices.
Transmission of power can cost different depending on numerous factors, including
Transmission costs rise as the distance the electricity must travel increases from generation facilities.
In places where high demand or inadequate transmission facilities cause grid congestion, utilities could have to reroute power, therefore raising costs.
As the grid ages or demand rises, utilities have to make additional infrastructure investments; the expenses of which are passed on to consumers via transmission fees.
Many areas have regulatory bodies such public utility commissions approve these fees, making sure they represent the required expenses and guard against too high rates safeguarding customers. Whether they be residential, business, or industrial, all consumers of energy pay transmission fees.
Demand Fees
Usually expressed in kilowatts (kW), demand fees are charges targeted mostly at commercial and industrial consumers depending on their peak electricity consumption during a given period.
Demand costs show the maximum level of electricity consumed at any one moment during a billing cycle—measured in kilowatt-hours or kWh—than ordinary consumption charges, which are based on the total energy used throughout that period.
Demand for big structures like factories, offices, or data centers could change greatly during the day. Even if total energy consumption is somewhat moderate, a surge in electricity use—such as that which results from turning on heavy machinery or during cooling system operation on hot days—may cause substantial demand costs.
Though they happen seldom, utilities levy demand fees since they must keep the infrastructure and generating capacity to satisfy these peak demand. Demand charges assist balance the expensive expenditures in power plants, transformers, and other equipment needed to ensure the grid can manage such increases.
Reducing Transmission and Demand Fees
Reducing total electricity costs for companies mostly depends on controlling demand. This can entail tactics including:
– Shifting energy-intensive activities to periods when demand is lower helps load.
– Using more efficient machinery or HVAC systems will help to lower peak loads.
– Participating in utility-run programs that provide financial incentives to lower power use during peak hours helps one demand response.
By using energy-efficient technology and behaviors that cut total demand, consumers can also lessen their influence on transmission fees, therefore enabling utilities to better control their running expenses.
Conclusion
Maintaining the dependability and functionality of the electrical grid depends on demand fees as well as transmission ones. Demand fees inspire big consumers to control their peak loads while transmission fees pay for the long-term expenses of moving electricity. Both are crucial in making sure the energy system can satisfy everyone’s requirements and maintain reasonable rates for all.
Many times when consumers get their power bills, they find a component marked as a fixed fee
or basic charge. Unlike prices depending on consumption of electricity, fixed rates are constant independent of usage. These payments are meant to cover expenses related to maintaining the energy grid and granting access to power, therefore enabling utilities to consistently supply electricity to homes and businesses. This overview will go over fixed fees’ goals, usual elements, and effects on consumers.
Purpose of Fixed Fees
For electricity, fixed fees have various useful functions. Power lines, transformers, meters, and substations are among the several expenses utilities pay to keep the infrastructure delivering electricity to consumers intact. Even with modest use, these infrastructure projects are crucial to guarantee constant availability of electricity. Fixed fees enable utilities pay for infrastructure- related expenses, which do not vary depending on changes in energy use.
Fixed fees also assist utilities cover administrative expenses including customer service, billing, meter reading, and customer support that arise independent of power consumption. Since they have no direct bearing on the creation or consumption of electricity, these are sometimes referred to as “non-energy costs.” Charging a fixed price helps utilities guarantee continuous income to pay these expenses, which is essential for preserving financial stability especially in low-power use times.
Components of Fixed Fees
The components of fixed fees will vary depending on the utility and area of application. Common elements include:
Utilities have to keep the physical infrastructure delivering electricity—including power lines, transformers, substations, and meters—in good shape. Whether a consumer consumes a lot or a little of electricity, these expenses are incurred. The set charge guarantees that the utility may preserve and fix this infrastructure so as to keep the grid dependable and operational.
Utilities have to offer services including customer support, billing, and account management even if electricity use is modest. Usually, predetermined fees pay these overhead expenses to guarantee continuous functioning of necessary administrative tasks.
For households and companies with conventional meters, there are expenses related to dispatching staff members to personally read meters. While some of these expenses have been lowered with the arrival of smart meters, utilities still pay for maintaining and tracking meters and related communication systems.
Often included in fixed rates are an access charge reflecting the cost of just being connected to the grid. This guarantees, independent of energy consumption, customers always have access to electricity. Many times, these charges are used to guarantee that the company can manage peak loads or guarantee availability of emergency power.
Impact on Consumers
Depending on the pricing structure of the company, fixed fees might have a somewhat different effect on power bills. Usually paying a small fixed price ranging from $5 to $20 per month,
residential consumers pay depending on the utility and area a more or less. Because the more infrastructure is needed to satisfy their larger power needs, commercial and industrial consumers typically pay higher fixed fees.
Fixed fees can be divisive among consumers even if they give utilities consistency. For those who use relatively little electricity—such as energy-efficient homes or vacation homes unoccupied year-round—fixed fees can account for a bigger share of their whole cost.
Sometimes these penalties deter consumers from cutting energy use since, even if they cut their electricity use, a good amount of the bill stays the same.
Reducing Fixed Fees
Fixed fees are more difficult for consumers to affect than variable rates that change with energy consumption. Even if set fees stay the same, energy-efficient homes and businesses still gain from lower variable consumption costs. Some customers have urged utilities to rethink how these costs are set, supporting reduced fixed rates and more focus on usage-based pricing to encourage energy saving.
Conclusion
Maintaining the infrastructure for consistent power supply depends critically on fixed fees for electricity. They guarantee that, independent of energy use, utilities can meet basic needs including system maintenance, administrative services, and customer access to electricity. These fees might disproportionately burden low-use consumers even while they give utilities financial stability. Knowing fixed fees enables customers to better understand their energy bills and identify the infrastructure and services these costs fund.
Factors Affecting the Price of Power
The cost of generation, the cost of transmission and distribution, market dynamics, and regulatory laws all have an impact on the total cost of energy.
Production Expenses
Fuel Prices: The price of fuel, such as coal, oil, or natural gas, is a major factor in the price of electricity generated by power plants. Variations in fuel prices have the potential to impact generation costs.
Type of Generation: The expenses of various power plant types vary. For example, although fossil fuel facilities have continuous fuel expenses, renewable energy sources like wind and solar have minimal operating costs but substantial initial investment.
Plant Efficiency: Lower energy costs are produced by more efficient power plants, which has an impact on the price of electricity as a whole.
Transmission and Distribution
System Upkeep: Consumers bear the expense of preserving and modernizing the transmission and distribution system.
Line Losses: As electricity moves through the distribution and transmission networks, energy is lost. The cost of power takes these losses into account.
Geographical Factors: Transmission prices can be impacted by the distance between customers and generating facilities, with remote locations often paying more.
Rules and Regulations
Tariffs and Taxes: The pricing of electricity is directly impacted by government policies, which include taxes and tariffs on the production and consumption of energy.
Subsidies & Incentives: The total cost of power can be impacted by subsidies for energy efficiency or renewable energy initiatives.
Environmental Rules: Adherence to environmental rules, like those governing emissions, may result in higher generation expenses, which may have an impact on pricing.
Market Situation
Supply and Demand: The equilibrium between supply and demand affects the price of electricity. Prices can increase during times of high demand, like the sweltering summer months.
Market Structure: Whether regulated or not, the structure of the electrical market affects pricing. More fluctuating prices may result from supplier rivalry in deregulated marketplaces.
Weather: Severe weather events have the potential to cause distribution and generation disruptions, which could result in brief price increases.
Reducing the Cost of Electricity
Combining tactics aimed at increasing overall energy efficiency, lowering peak demand, and optimizing consumption results in effective management and cost reduction of electricity.
Energy Efficiency
Upgrades to lights: Using LED lights instead of incandescent bulbs can drastically cut down on electricity use.
HVAC Optimization: You can cut down on energy use by switching to more energy- efficient heating, ventilation, and air conditioning systems and by putting in place smart controls.
Building Insulation: By decreasing the demand for heating and cooling, better insulation in buildings uses less energy.
Control of Demand
Demand Response Programs: In exchange for financial rewards, customers that take part in demand response programs are able to use less electricity during peak hours.
Load Shifting: You can cut demand costs by moving energy-intensive operations to off- peak hours, when electricity prices are lower.
Energy Storage: By storing energy during off-peak hours and discharging it during peak hours, energy storage devices, such as batteries, can assist in controlling peak demand.
Renewable Energy
Solar Photovoltaic (PV) Systems: By installing solar panels, you can cut down on your consumption of electricity from the grid and your overall energy bills.
Wind Turbines: In the right places, wind turbines may supply a sizable amount of the energy required.
Through the use of net metering, customers who install renewable energy systems can balance their electricity expenses by selling excess power back to the grid.
Impact of Wind and Solar on the Cost of Electricity
The growth of renewable energy sources, particularly wind and solar, has had a transformative impact on electricity markets worldwide. These technologies offer significant benefits, including reducing greenhouse gas emissions and promoting energy independence, but they also influence the cost of electricity in complex ways. In general, the introduction of wind and solar into the energy mix tends to drive down wholesale electricity prices due to their low operating costs, though their intermittency presents challenges for grid management and infrastructure investment.
This dynamic is particularly evident in regions like Alberta, Canada, where wind and solar energy are playing an increasing role in the province’s energy landscape. In this discussion, we will explore the overall impact of wind and solar on electricity costs and examine Alberta as a specific case study.
Lower Operating Costs and Market Competition
Wind and solar power plants have lower operational costs compared to traditional fossil fuel- based power plants like coal or natural gas. Once the initial investment in infrastructure is made, wind turbines and solar panels require little fuel, and their maintenance costs are relatively low. As a result, when these renewable sources are available, they tend to generate electricity at a marginal cost that is close to zero. This phenomenon is often referred to as the “merit order effect,” where wind and solar enter the energy market at lower prices, displacing more expensive forms of generation.
When wind or solar generation is high, especially during sunny or windy periods, these renewables can flood the market with electricity, leading to lower wholesale electricity prices. This is because, in competitive electricity markets, the lowest-cost sources are dispatched first, and wind and solar, with their near-zero fuel costs, frequently take precedence over more expensive fossil fuel plants.
Impact on Grid Management and Infrastructure Costs
Despite the price-lowering effect of wind and solar, their intermittency creates challenges for grid operators. Since the output from wind turbines and solar panels depends on weather conditions, there are times when these resources generate very little or no electricity. To ensure reliable power supply, grid operators must maintain backup generation sources, typically from
natural gas or hydroelectric plants, which can be ramped up quickly when renewable generation drops.
This need for backup generation adds complexity and cost to the overall electricity system. Utilities and grid operators may also need to invest in grid infrastructure, such as energy storage systems or transmission lines, to accommodate variable renewable energy sources. These additional costs can counterbalance the price reductions that wind and solar provide during periods of high generation.
Example from Alberta: Wind Power and Electricity Prices
Alberta provides a compelling example of how wind energy can influence electricity prices. The province is unique in Canada due to its deregulated electricity market, where prices are largely determined by supply and demand rather than being set by government authorities. Alberta has significant wind resources, particularly in the southern part of the province, which has led to a rapid increase in wind power installations.
According to recent data, Alberta’s wind generation has grown substantially, contributing approximately 10% of the province’s total electricity supply in recent years. This growth has had a tangible impact on electricity prices, particularly during windy periods when wind farms produce a large amount of electricity. In some cases, high wind generation has led to a significant drop in wholesale electricity prices, as wind power displaces more expensive natural gas plants in the merit order.
For instance, on days with strong wind conditions, wholesale prices in Alberta’s power pool can drop dramatically, with some periods even seeing negative pricing, meaning generators pay to produce power due to oversupply. This reflects the impact of wind’s low marginal cost on the overall market. However, these price fluctuations also create volatility, which can be a challenge for market participants who rely on more stable pricing.
In the charts below, we can see that the electricity price has dropped to zero on September 13.
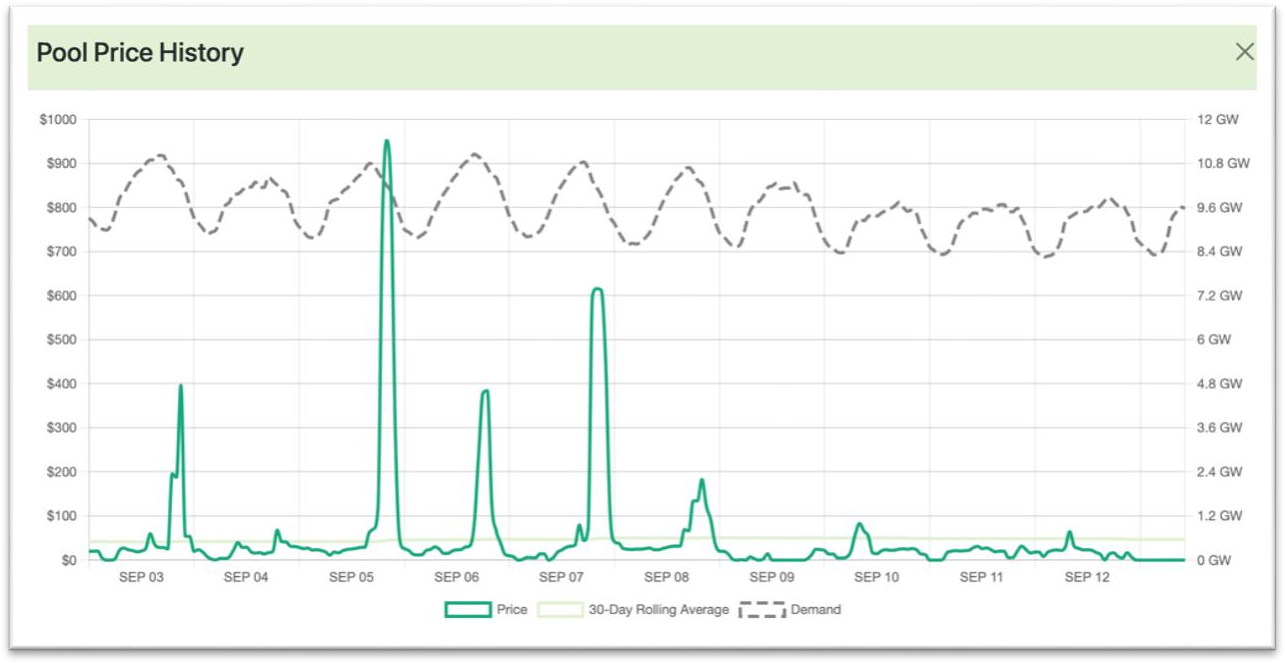
This is because there was a great deal of wind energy providing electricity during those hours.
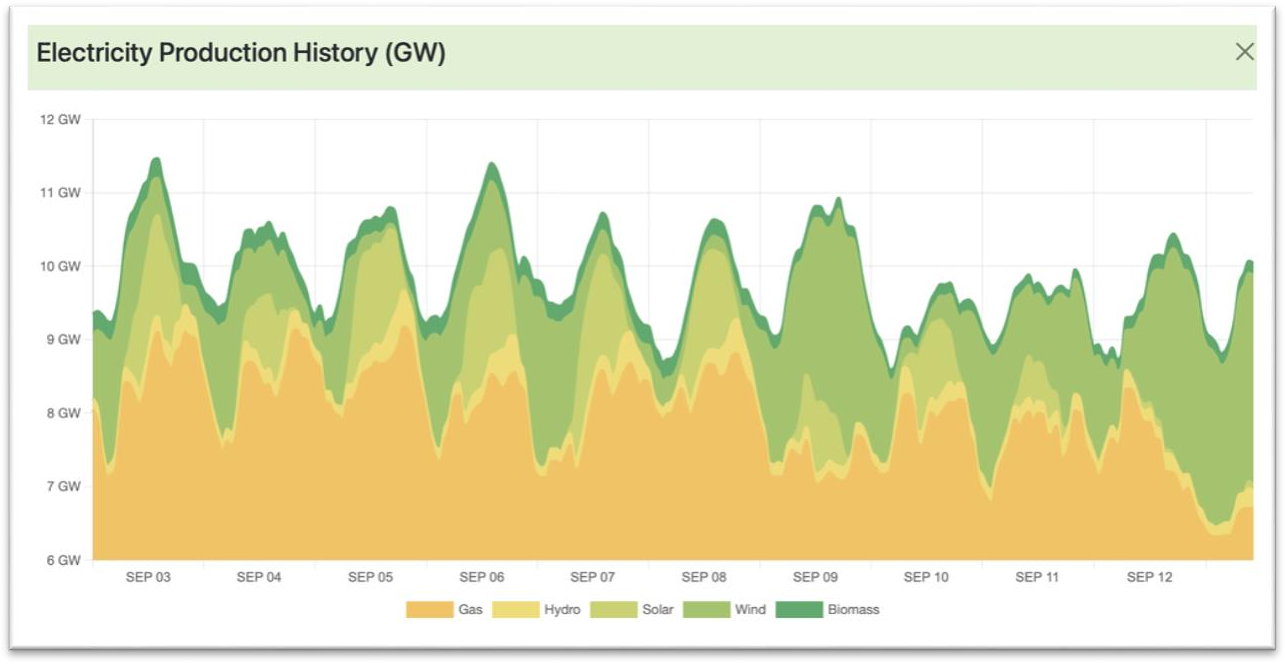
Conclusion
The expansion of wind and solar energy has a clear impact on the cost of electricity, generally pushing prices lower due to their low operating costs and the merit order effect. However, the intermittent nature of these resources requires careful management of the grid and additional investment in infrastructure, which can offset some of the direct cost savings. In Alberta, the growing share of wind power has led to lower electricity prices during windy periods,
showcasing how renewable energy can reshape electricity markets while introducing new challenges for grid stability and price volatility.
Energy Contacts
Retail Energy Providers: In markets that have been deregulated, customers are free to compare prices from several energy suppliers.
Long-Term Contracts: You can lock in cheaper rates and ensure cost stability by negotiating long-term contracts with energy suppliers.
Aggregation: By pooling your buying power as a group, you may be able to negotiate better pricing through collective action.
Hedging
Building owners and operators utilize hedging electricity contracts as a tactical tool to control the risk and volatility of energy prices. By using different contract formats to lock in electricity rates, this technique offers budget stability and pricing predictability. An extensive summary of electricity contract hedging is provided below:
Understanding Hedging
In the context of electricity contracts, hedging is similar to having insurance against changes in energy costs. Establishing fixed-rate agreements or utilizing alternative methods of price stabilization allows facilities to reduce the possibility of price fluctuations and guarantee more consistent energy costs.
Advantages of Hedging
Power Contract Cost Unpredictability: Fixed-rate contracts offer a precise and steady cost structure that helps businesses budget for energy costs and prevent unanticipated financial shocks from fluctuating prices.
Risk mitigation: By fixing prices, businesses can guard against abrupt spikes in energy costs brought on by changes in the market, international occurrences, or natural disasters.
Better financial planning and forecasting are made possible by predictable energy prices, which is essential for companies that have strict budgetary constraints or that work in energy-intensive industries.
Incentives for Energy Efficiency: Organizations are encouraged to implement energy-saving measures and operational improvements in order to further reduce expenses. Tiered and TOU rate contracts provide incentives for energy efficiency and load shifting.
Challenges
Although hedging has numerous advantages, it also calls for skill and cautious thought:
Market Analysis: Choosing the best hedging strategy requires an understanding of market trends
and projections. Using cutting-edge energy management tools or speaking with energy consultants can yield insightful information.
Contract Terms: Electricity contracts come with a variety of terms and conditions, so it’s important to be aware of them all. Termination clauses, penalties, and possibilities for renewal are just a few examples.
Regulatory Environment: Regulations pertaining to energy markets are susceptible to change. It’s critical to stay up to date on regulatory changes and policy changes in order to maximize contract benefits and assure compliance.
Implementation
To put into practice a successful hedging plan:
Evaluate Current Energy Usage: Recognize the energy consumption trends, periods of peak demand, and total energy requirements of the facility.
Analyze Contract Options: Examine various contract arrangements and their possible effects on energy expenses. Think about utilizing energy purchase platforms or speaking with specialists in the field.
Watch and Modify: Keep a close eye on market conditions and energy consumption. Be ready to modify plans or renegotiate agreements as needed to conform to evolving circumstances and corporate objectives.
To summarize, the strategic method of hedging power contracts has the potential to greatly improve energy cost management and financial stability. Organizations can enhance their financial results, safeguard against market fluctuations, and promote energy efficiency by meticulously choosing and overseeing these agreements.
Conclusion
Knowing the many parts of an electrical bill, what drives up these expenses, and how to control and lower them are all necessary for understanding electricity costs. Customers may save a lot of money and help ensure a more sustainable energy future by concentrating on energy efficiency measures, managing demand, integrating renewable energy, and utilizing sophisticated energy management systems. All consumers will need to stay up to date on the newest energy management techniques and power prices as the energy landscape changes more.
Case Study
Hotel / Resort:
Problem: A hotel/resort in the Caribbean struggled with exorbitant electricity bills, exceeding
$500,000 per month. An analysis of their energy bills showed that before February 2023, the demand charges were the major contributor to electricity costs resulting in an average rate of over $0.55/kWh.
After February 2023, the demand charges were better managed which dropped the average rate to $0.35/kWh. The major source of costs was the fuel charge levied to the consumer base.
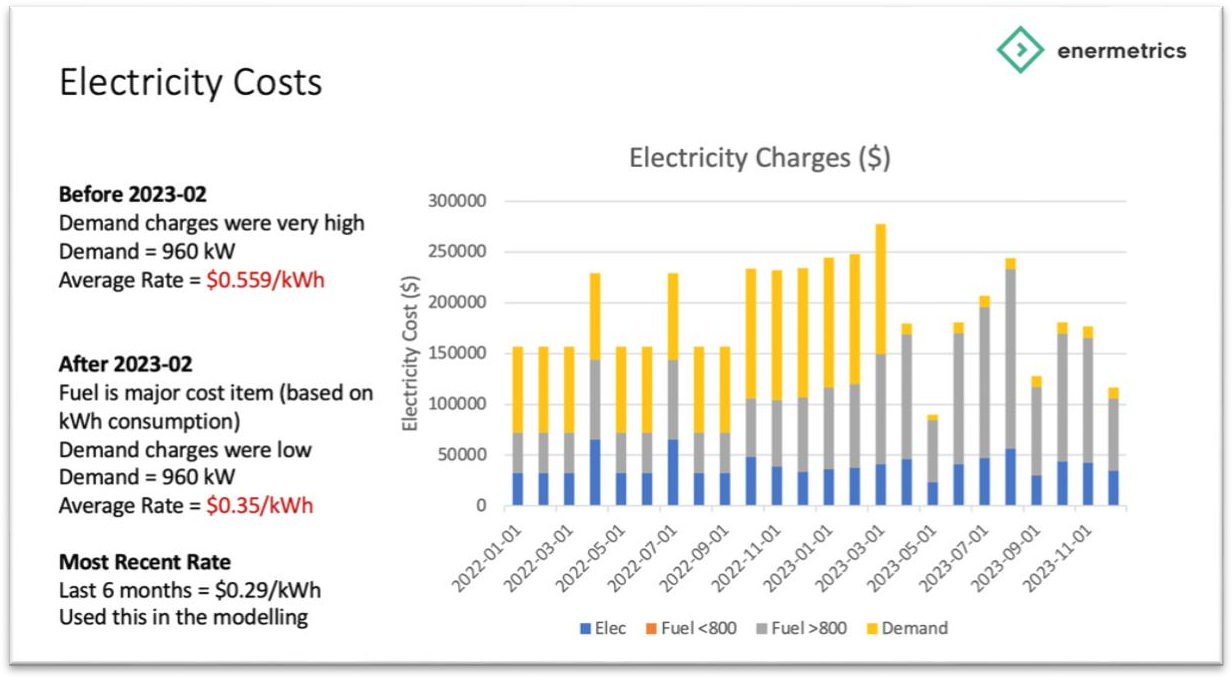
This demonstrates that value of continuous monitoring of your energy bills, understanding the factors that contribute to the costs and addressing those factors.
Project Study 3: Understanding Your Energy Costs
Electricity cost ($ / kWh)
Demand cost ($ / kVA)
Fixed costs
Energy charges
Distribution charges / Delivery charges / Wires charges
Fixed charges
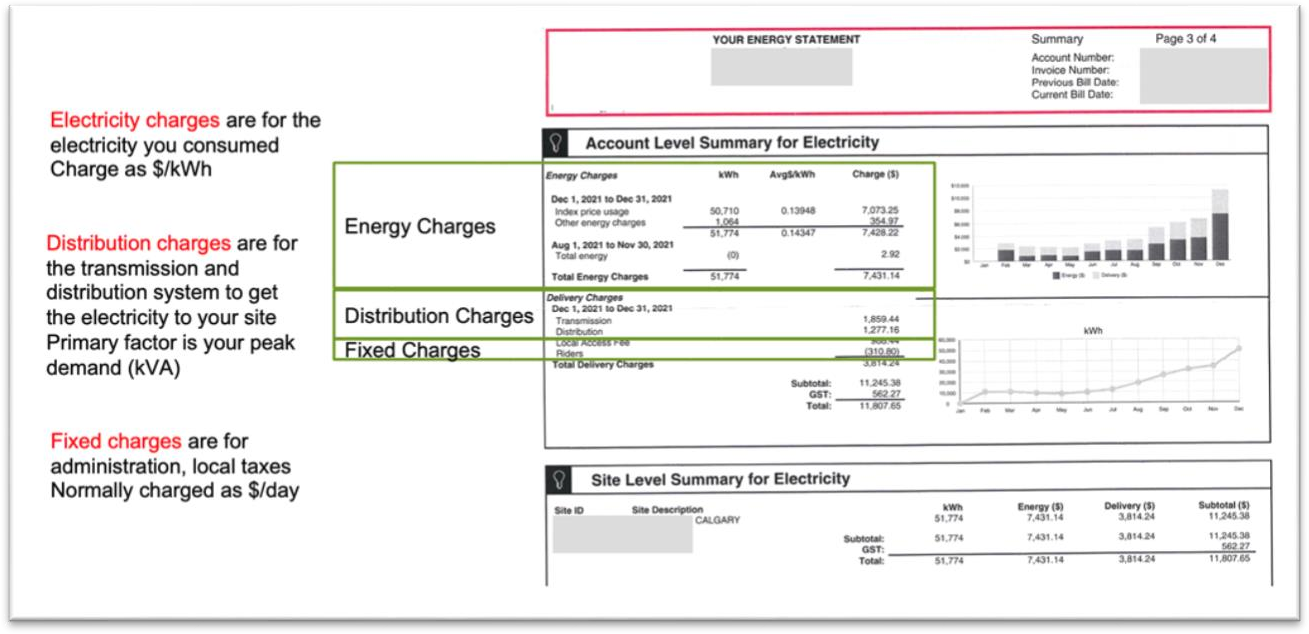

Course Manual 4: Electricity Rates and Tariffs
The structure of electricity rates and tariffs takes into account the expenses associated with producing, transporting, and distributing electricity. Additionally, they provide incentives for specific consumer behaviours that guarantee the integrity and effectiveness of the electrical grid. It is essential for customers to comprehend the many kinds of power rate contracts in order to make well-informed judgments that will maximize their energy use and minimize expenses.
The four primary forms of electricity rate contracts that will be discussed in this workshop are time of use (TOU) contracts, block contracts, fixed rate contracts, and the dynamics of deregulated markets.
Fixed Rate Contracts
Historically, many regions have a flat rate for electricity measured as $/kWh. However, with the dramatic increase in demand for electricity, utilities need to significantly upgrade their infrastructure (distribution, transmission, transformers, etc.). In order to delay investments in infrastructure upgrades, some utilities are moving away from fixed rate structures to time of use structures in an attempt to encourage electricity consumers to shift their consumption patterns and balance the grid demand profile.
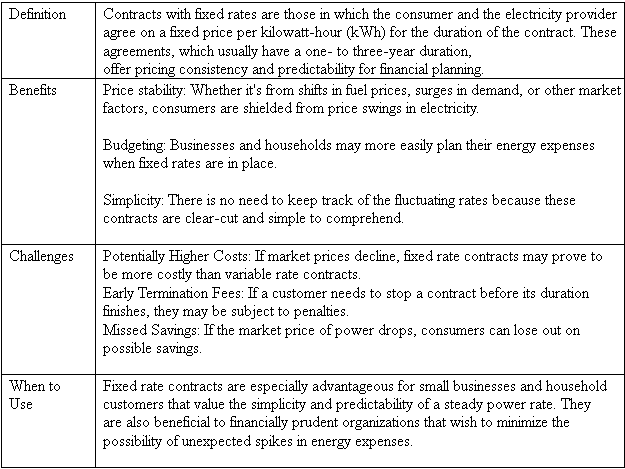
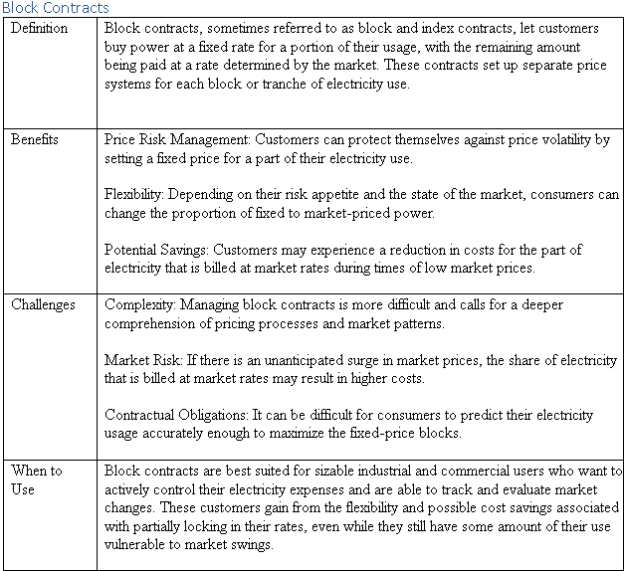
Time of Use (TOU) Contracts
In a time of used model, the electricity rates depend on when you consumed the electricity. The idea is that when there is high demand on the electricity grid, the rates are higher. When there is lower demand on the grid, the rates are lower in an attempt to encourage consumers to shift the time of their electricity demand.
Rates are often broken down into
On Peak rates – periods where the demand on the electricity grid is the highest
Mid Peak rates – shoulder periods between on peak and off peak
Off Peak rates – periods where the demand on the electricity grid is the lowest
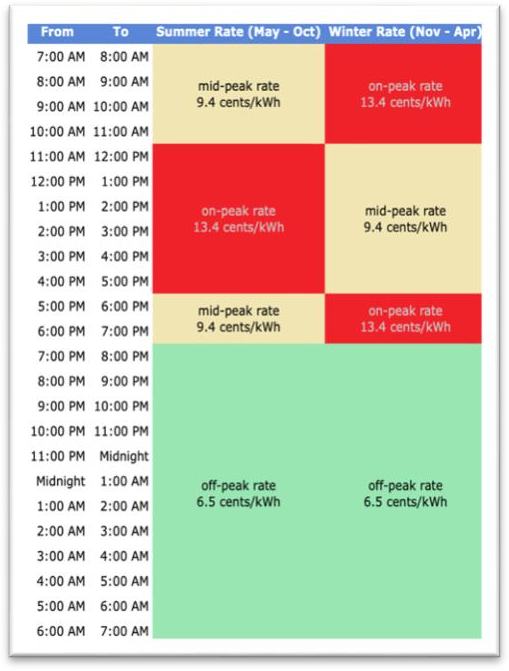
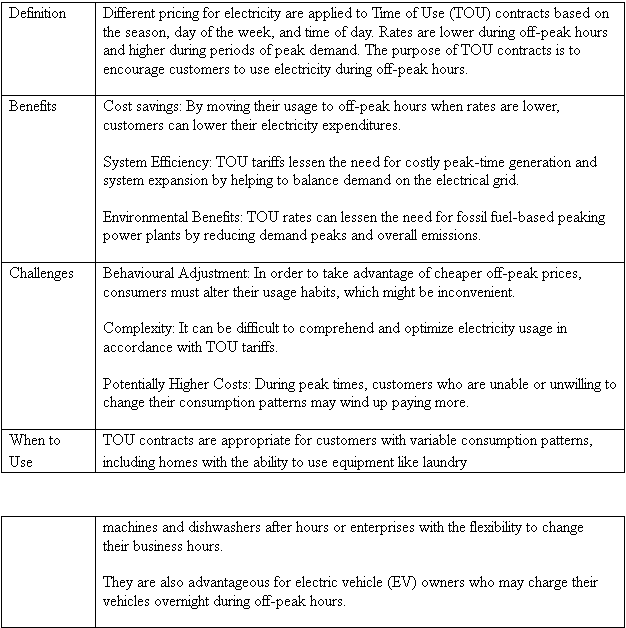
Deregulated Markets
There are a number of examples of deregulated electricity markets, such as Alberta Canada and Texas USA. In these markets, electricity producers are able to bid into a regulated market. The electricity grid operator will accept the lowest bids ($/kWh) first and continue to accept bids until the demand for the region is met. The idea is that this ensures the lowest cost electricity for the consumers.
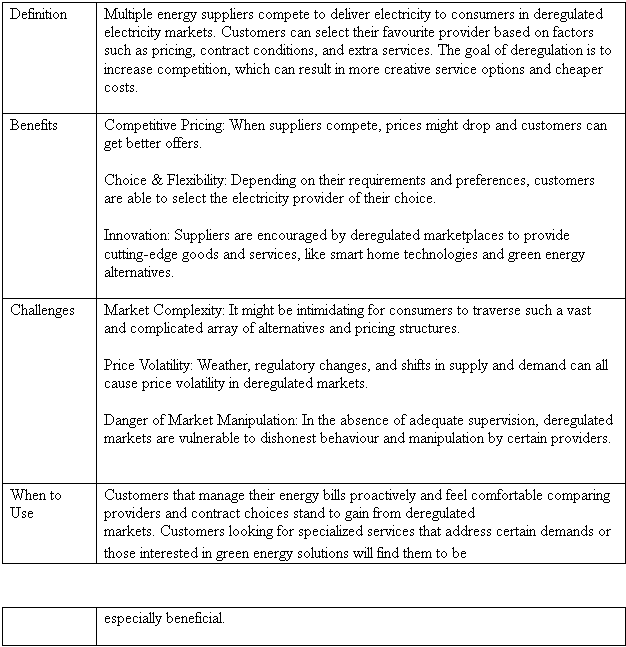
Texas: The state’s deregulated market is overseen by the Electric Reliability Council of Texas (ERCOT), giving customers a selection of Retail Electric Providers (REPs).
California: Despite obstacles like the state’s electrical crisis in the early 2000s, deregulation initiatives have produced a competitive market.
Britain: The deregulated electricity market in the UK is well-established, offering a wide selection of energy suppliers to consumers. The Office of Gas and Electricity Markets, or Ofgem, regulates the market to guarantee honest competition and customer safety.
Australia: With deregulated electricity markets, states like South Australia, Victoria, and New South Wales offer competitive prices and a variety of options to their customers.
Conclusion
Tariffs and prices for electricity are essential components in the administration and use of power. Fixed rate contracts are the best option for customers who want a simple way to manage their energy expenses since they provide consistency and predictability. Large consumers who are adept at navigating complex markets can benefit from block contracts’ flexibility and possible cost reductions. Time of Use contracts encourage users to change their consumption habits, which improves environmental and grid efficiency. Competitive marketplaces give customers more options and maybe lower prices, but they also bring complexity and the possibility of price volatility.
Comprehending the various pricing structures enables consumers to make well-informed choices that correspond with their energy consumption habits, financial aspirations, and sustainability aims. Understanding electricity rates and tariffs will continue to be crucial for maximizing energy management and cutting costs as the energy landscape changes with the integration of renewable energy sources and smart technology.
Case Study: Alberta’s Deregulated Market
In this example from the deregulated market in Alberta Canada, we are showing the fixed electricity rate (orange line) and the hourly pool price (blue line). Clearly the pool price fluctuates significantly making it challenging to prepare for monthly budgets. The fixed electricity rate provides a degree of cost certainty which makes it easier to budget. However, this is not the lowest cost solution.
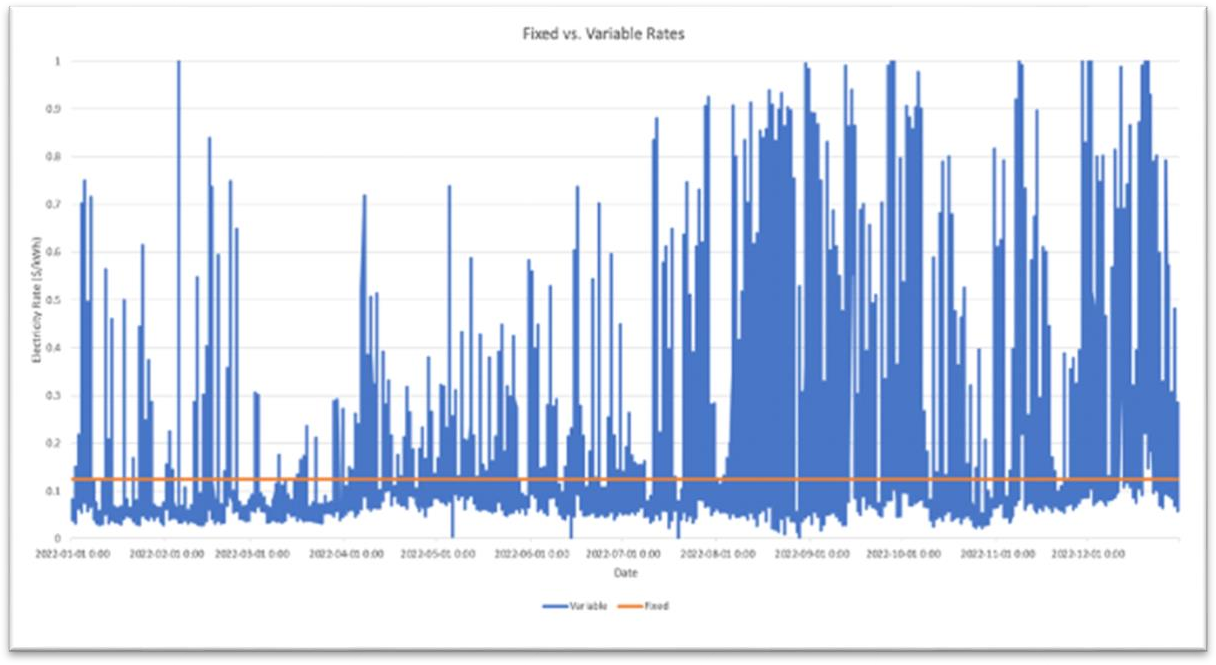
The chart above shows the hourly electricity grid rates for 2022. Forecasting the grid rates is challenging, but in general we see spikes in the electricity rates when it is very hot (June to October) or very cold (November to January).
Those that have capabilities to generate power onsite (solar PV, CHP, etc.) can take advantage of these spikes in grid rates and sell power back to the grid for a significant profit. Solar PV has an operating cost of nearly zero, while CHP’s can generate power at $0.08/kWh (taking into account the cost of natural gas and maintenance), and then sell that power back to the grid at up to $0.999/kWh.
However, there are risks as shown with the grid rates in 2024 which have been historically low as shown below. In this case, it has not been profitable to self-generate using CHP at $0.08/kWh. Rather with grid rates often below $0.04/kWh, it is cheaper to purchase power from the grid.
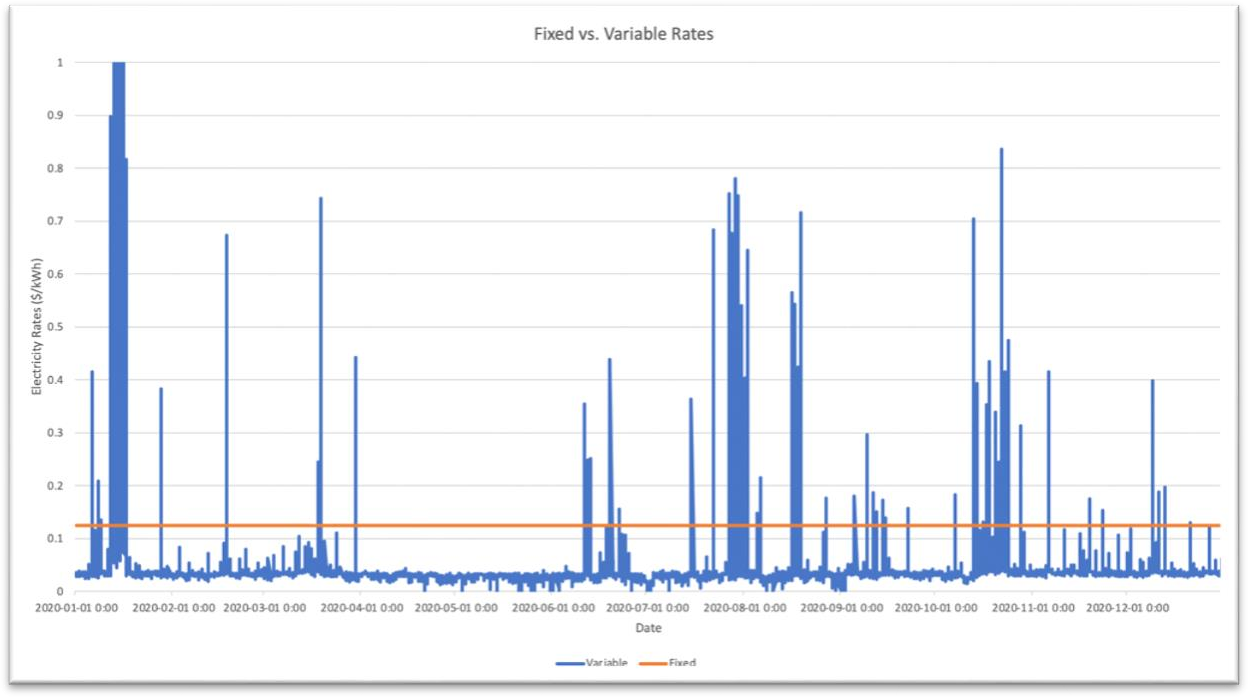
Case Study: Alberta’s Operating Reserves Market
Energy users use equipment, processes or emergency generation to load shed off the grid with 10 minutes notification. The program is ideal for customers who spend $20,000/month on electricity or have an average site load of 200kW or more.
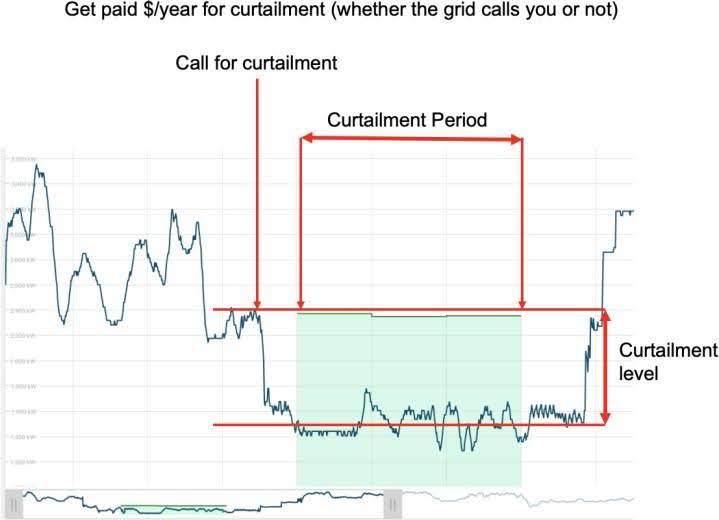
When there is an unforeseen increase in electricity demand or a sudden decrease in supply, the grid operator relies on the Operating Reserve Market to swiftly balance the system. Participants in the market may receive a call to curtail their electricity consumption or increase their
generation to meet the demand. This real-time response helps maintain stability and reliability in the grid.
The Alberta Electricity Services Organization (AESO) submits a call to Operation Reserve (OR) participants to curtail their consumption at a specific time. Participants are given 10 minutes notice and their current consumption at the time of the call is noted.
The participants then curtail their operations by either turning on internal generation or shutting down electricity equipment for the duration of the curtailment call. The “curtailment level” is measured over the curtailment period.
Participants are paid quarterly for the privilege of AESO to call for curtailment – whether they actually submitted a call or not.
Exercise 4: Structuring your electricity contract
Fixed rate contracts
Block rate contracts
Variable rate contracts (for regions with a de-regulated market)
Hedging (when to hedge, when not to hedge, factors to consider
Fixed rate
Have the variable rates been consistently higher / lower?
Block contracts
Do you consistently use electricity between specific hours of operation?
Will your utility sell you a block of electricity during these hours at a lower rate?
Hedging
Can you get a better rate with a longer term hedge?
What do you think the future electricity rates will be (higher or lower)?
Factors to consider
Duration of the contract
Rate
Forecast for future rates
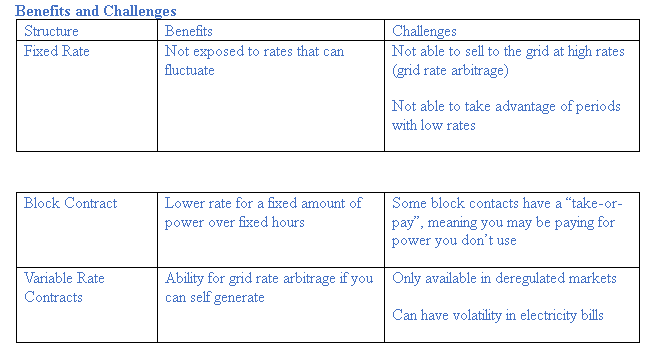

Course Manual 5: Energy Use Intensity
One of the most important metrics for evaluating a building’s energy efficiency is Energy Use Intensity (EUI). It calculates a building’s energy use per unit area over a given time frame, usually a year. Building owners and managers that want to minimize their environmental effect, cut operating expenses, and reduce energy consumption must comprehend and manage EUI. This thorough review looks at the importance of EUI, how to measure and evaluate it, what influences EUI, and how to make it better.
The lower the EUI, the more efficient the facility. This provides a metrics by which you can compare the efficiency of your facility with other similar facilities in the same climate conditions.
The Significance of Energy Intensity
Benchmarking and Performance Comparison: EUI enables the energy performance of a building to be compared against industry norms or other comparable structures. Building owners can determine how their structures compare to others and discover areas that require improvement by comparing the EUI values.
Energy Management: One essential instrument for energy management is EUI. Determining a building’s energy consumption in relation to its size is helpful in making judgments about energy-saving measures and investments in energy-efficient technologies.
Sustainability and Environmental Impact: By lowering building energy use and carbon footprints, lowering EUI helps promote sustainability. Lower EUI values suggest more energy- efficient use, which is necessary to meet sustainability targets and follow laws meant to cut greenhouse gas emissions.
Building Rating Systems: ENERGY STAR and LEED (Leadership in Energy and Environmental Design) are two examples of building rating systems that employ EUI as a critical parameter. These certifications increase a building’s marketability and draw in environmentally conscientious investors and renters.
Determining the Intensity of Energy Use
EUI is computed by dividing a building’s annual gross floor area by the total amount of energy it uses. The equation is:

While the EUI can be computed using non-metric units of energy, we find it easier to convert your energy consumption to standard metric units (GJ) and the gross floor area measured in square meters. This results in an EUI with units of GJ/m2.
For instance, a structure with a 50,000 square foot floor area and yearly energy use of 500,000 kWh of electricity and 2,000,000 BTU of heating energy would have the following EUI:
50,000 ft2 = 4645.152 m2 (conversion factor of 1 ft2 = 0.092903 m2) 500,000 kWh = 1800 GJ (conversion factor of 1kWh = 0.0036 GJ)
2,000,000 BTU = 2.11 GJ (conversion factor of 1,000,000 BTU = 1.055055 GJ)
EUI = (1800 + 2.11) / 4645.152 = 0.3879 GJ/m2
Note: The units of electricity and heating must be the same.
Energy Star Portfolio manager publishes the EUI for many common building types here. However, they publish in units of kBTU/ft2 and they are only the median values for each building type across the USA.
For Canadian buildings, the EUI is published in GJ/m2 here.
Factors Influencing the Intensity of Energy Use
A fundamental indicator of a building’s energy efficiency is energy use intensity. Usually stated in kilowatt-hours per square meter or British thermal units (BTUs) per square foot annually, it is the energy spent per unit area of a structure. Whereas a higher EUI signifies that a building consumes more energy for its size, a lower EUI indicates better energy efficiency. From its design and construction materials to its operation and maintenance, several elements affect the EUI of a structure. The main elements influencing a building’s energy use intensity are those below.
Architectural and Building Design
The EUI of a building is significantly influenced by its design; buildings built with energy economy in mind—that is, those with appropriate insulation, efficient windows, and careful orientation—usually have lower EUIs. Important elements of construction include:
Energy performance is much influenced by the building envelope—walls, windows, roof, and insulation. High-performance windows in a well-insulated building help to lower heating and cooling loads, therefore directly influencing the total energy consumption of the construction.
The form and position of a structure affect the amount of sunlight it gets as well as how it interacts with dominant winds. Energy performance of buildings meant to optimize passive solar heating in colder areas or lower solar heat gain in warmer climates usually reflects their design. In frigid areas, for instance, buildings with lots of windows facing the sun can maximize natural light and heat, therefore lessening dependency on artificial lighting and heating systems.
Using high thermal mass materials, such concrete or brick, helps a structure store heat during the day and release it at night, therefore lowering the demand for mechanical heating and cooling.
HVAC Systems and Equipment Efficiency
Particularly in commercial and industrial buildings, heating, ventilation, and air conditioning (HVAC) systems account for a significant share of the energy consumption in a structure. EUI
directly relates to the efficiency of HVAC systems. Older or poorly maintained systems can result in increased energy consumption and often worse energy-efficiency. Among the considerations are:
High-efficiency boilers, chillers, air conditioning systems, and heat pumps can drastically cut the energy use of a building. Energy Star-rated or high-efficiency HVAC systems will usually result in a lower EUI for the buildings they equip.
Smart building management systems and thermostats that control temperatures and ventilation based on occupancy patterns help to maximize energy use by means of which wasteful heating, cooling, and ventilation during unoccupied times is avoided.
Occupancy and Use
The energy consumption of a building is largely influenced by its intended usage. Important elements are:
Occupancy Levels: A structure with many occupants or longer running hours will often use more energy. A hospital or data center, for instance, runs around-the-clock and will have a far greater EUI than a school or office building only used during specific daily hours.
The EUI of a building can be much influenced by the kinds and amounts of equipment applied in it. Compared to residential buildings, where usage is more sporadic, office buildings with more computers, printers, and other gadgets often have greater energy consumption. Energy-intensive machinery including data servers or commercial kitchen appliances also makes a big impact on EUI.
Location and Climate
The energy needs of a structure are largely influenced by its geographic location and local climate. While buildings in warmer climates will demand more energy for cooling, those in colder climes may need major heating energy consumption. Furthermore, buildings in humid environments could have to use dehumidification equipment to keep indoor comfort. Climate zones also affect the availability of natural resources like sunlight, which can be used for passive heating or to create electricity using solar panels, so affecting the whole energy profile of the construction.
Maintenance and Operation Strategies
Keeping low energy usage depends on effective operation of building systems and proper repair of them. Leaky windows, poorly kept HVAC systems, and faulty insulation can cause energy waste and increased EUIs. Furthermore contributing to increased energy consumption are running lights or equipment on needlessly based on operating policies.
Regular maintenance of building controls, lighting, and HVAC systems guarantees best performance, therefore helping to lower energy use.
Advanced energy management systems (EMS) enable buildings to monitor, evaluate, and maximize energy use in real-time, hence drastically lowering EUI.
Lighting
Another main energy user, especially in commercial buildings, are lighting systems. Effective lighting—LED technology included—as well as the use of natural daylight serve to reduce the energy intensity of a structure. Further energy economy can be achieved with automated lighting systems that change depending on occupancy and daylight availability.
Conclusion
A building’s energy usage intensity is shaped by a complicated mix of elements including design, HVAC efficiency, occupancy patterns, location, and operating procedures. Energy-efficient buildings with contemporary HVAC systems running under best practices for energy management often have lower EUIs, which makes them over time more sustainable and less expensive. On the other hand, older buildings or those with ineffective systems and inadequate maintenance may consume much more energy.
Reducing the EUI
Improving energy efficiency, lowering running costs, and therefore limiting environmental effect depend critically on a building’s energy usage intensity (EUI) being lowered. Usually expressed in British Thermal Units (BTUs) per square foot per year (or GJ per square meter per yerr), EUI shows the building’s energy use in relation to its size. Reducing the EUI of a building calls for a combination of tactics including improved systems, better building design, and altered tenant behavior. With real-world examples and quantifiable EUI reductions, this tutorial will walk over many major ways for lowering EUI.
Enhanced Building Envelope
Walls, roof, windows, and doors comprise the building envelope. A well-designed envelope greatly lowers the energy needs of heating, ventilation, and air conditioning (HVAC) systems by minimizing heat loss in winter and lowering heat gain in summer.
Golden, CO’s NREL Research Support Facility
Triple-pane windows, highly insulated walls (R-30), and a reflective cool roof were among the high-performance building envelope concepts used in construction of the National Renewable Energy Laboratory (NREL) Research Support Facility. With an EUI of 32 kBtu/sq ft/year instead of the typical office building EUI of about 67 kBtu/sq ft/year, these steps allowed the construction achieve a reduction of nearly 50%.
Optimizing HVAC Systems
Particularly in climates with high temperatures, HVAC systems often account for a large share of the energy use in a structure. Using smart thermostats and zoning systems and upgrading to more energy-efficient equipment can help to greatly lower EUI.
Pittsburgh, Pennsylvania’s PNC Tower
One of the greenest buildings in the world, PNC Tower uses a sophisticated energy recovery ventilation system, radiant heating and cooling, and an extremely efficient HVAC system including natural ventilation. Comparatively to conventional high-rise office buildings usually with an EUI between 50-60 kBtu/sq ft/year, the building achieves an EUI of 24 kBtu/sq ft/year, a 50% reduction.
Lightning Optimization
Another main energy usage in buildings is lighting, especially in businesses and offices. Buildings may dramatically reduce energy use by using daylighting techniques and energy- efficient lighting like LED lights.
New York, NY’s Empire State Building
Along with a larger refit, the Empire State Building replaced its current lighting with high- efficiency LED bulbs and installed daylight sensors to automatically change illumination according on natural light levels. These upgrades helped the building to consume 40% less energy overall, therefore lowering its EUI from 105 kBtu/sq ft/year to 60 kBtu/sq ft/year.
Automating Building Controls
Building automation systems (BAS) let one better control the energy use of a building. Through occupancy, time of day, or outside circumstances, smart controls can maximize HVAC, lighting, and other energy-consuming systems. Additionally enabling surveillance and optimization of energy consumption is advanced metering infrastructure (AMI).
Bryant Park in New York, NY
Based on real-time occupancy data and weather, one Bryant Park uses an advanced BAS to manage the HVAC system, lighting, and energy use. Comparatively to the typical high-rise office building, which has an EUI of roughly 90 kBtu/sq ft/year, the building achieves an EUI of 55 kBtu/sq ft/year, therefore reflecting a 40% reduction.
Water Heating and Energy Recovery
Water heating can be a significant energy loss in some buildings, particularly those used for hospitality or residence. Energy recovery systems, solar water heating, and high-efficiency water heaters can help to reduce heating water demand.
Seattle, WA’s Bullitt Center
Combining heat recovery from its greywater system with a solar hot water system, the net-zero energy building The Bullitt Center Together with additional energy-saving strategies, these elements help the building keep an incredibly low EUI of just 9 kBtu/sq ft/year, compared to the usual office building EUI of 67 kBtu/sq ft/year. This shows a quite amazing drop of more than 85%.
On-Site Renewable Energy Generation
On-site generation of renewable energy, including solar panels or wind turbines, can help balance the energy use of a structure, hence lowering its EUI. Although this does not always reduce the gross energy usage, it lets a building depend less on grid power—often produced from fossil fuels.
Tesla Gigafactory, Sparks, NV
Plans for wind power generation and a massive solar photovoltaic (PV) array drive the Tesla Gigafactory mostly from renewable energy. This lets the facility to net-zero energy status, hence lowering its effective EUI to 0 kBtu/sq ft/year. Although the structure still uses energy, its reliance on renewable energy balances its use to the extent of having no net effect.
Occupant Involvement and Behavioral Changes
Although mechanical improvements receive much of the attention paid to lowering EUI, occupant behavior is rather important. Buildings may drastically cut energy usage by involving building users in energy-saving activities include turning off lights, regulating temperatures, and running energy-efficient equipment.
Oberlin College, Oberlin, Ohio
To inspire staff and students to cut their energy consumption in dorms, Oberlin College created a program including energy monitoring and feedback. Real-time energy dashboards showed consumption data, therefore motivating behavioral adjustments such turning off lights, cutting back on hot water use, and disconnecting appliances. With an average EUI drop from 42 kBtu/sq ft/year to 28 kBtu/sq ft/year, this program resulted in a 32% decrease in energy use across the participating buildings.
Deep Energy Renovations and Retrofits
Older buildings might have better EUIs because of obsolete systems and inadequate insulation. Retrofitting buildings with energy-efficient technologies, better insulation, and contemporary HVAC systems will drastically cut their energy use, though.
For instance, the San Francisco Ferry Building in San Francisco, California
New windows, a more effective HVAC system, and contemporary lighting controls were among the substantial renovation the San Francisco Ferry Building undertook. These upgrades resulted in a 41% drop in the EUI of the building from 110 kBtu/sq ft/year to 65 kBtu/sq ft/year.
Passive Design Techniques
Passive design aims to maximize the orientation, window location, and natural ventilation of the building therefore lowering the demand for mechanical heating and cooling. These techniques can drastically lower the energy usage of a building.
Example of the Passive House Standard
Designed to run on little energy for heating and cooling, passive house constructions have shockingly low EUIs. For instance, the Passive House-compliant House at Cornell Tech in New York City has an EUI of roughly 38 kBtu/sq ft/year, which is 60% less than a similar dorm built to conventional standards, maybe with an EUI around 100 kBtu/sq ft/year.
Energy Modeling and Commissioning
Energy modeling is the use of software to replicate the energy performance of a building, therefore guiding designers in material, system, and layout decisions. Commissioning guarantees that the systems of a building are operating as expected, so offering a chance to spot and fix inefficiencies.
Office of DOE Building Technologies
Using energy modeling and thorough commissioning, the Building Technologies Office of the U.S. Department of Energy guaranteed that its buildings ran at maximum efficiency. This resulted in a 30% drop in EUI across numerous sites, therefore bringing the EUI from 120
kBtu/sq ft/year to 84 kBtu/sq ft/year.
Conclusion
Combining building envelope, HVAC systems, lighting, automation, occupant behavior, and renewable energy will help to lower the energy consumption intensity of buildings. Successful examples show that major EUI reductions of 30% to 85% or more are feasible across many building types, from high-performance new constructions like the NREL Research Support Facility to extensive retrofits of famous structures like the Empire State Building. Reducing EUI will always be essential in ensuring that buildings be more environmentally responsible and energy-efficient as sustainability takes front stage and technology develops.
Case Study – Caribbean Resort:
To lower its EUI, a Caribbean resort installed a micro-grid equipped with solar PV and smart air conditioning controls and a small CHP using biogas from restaurant waste. The resort was facing high electricity expenditures. Significant energy savings and a decrease in carbon emissions were achieved by this project.
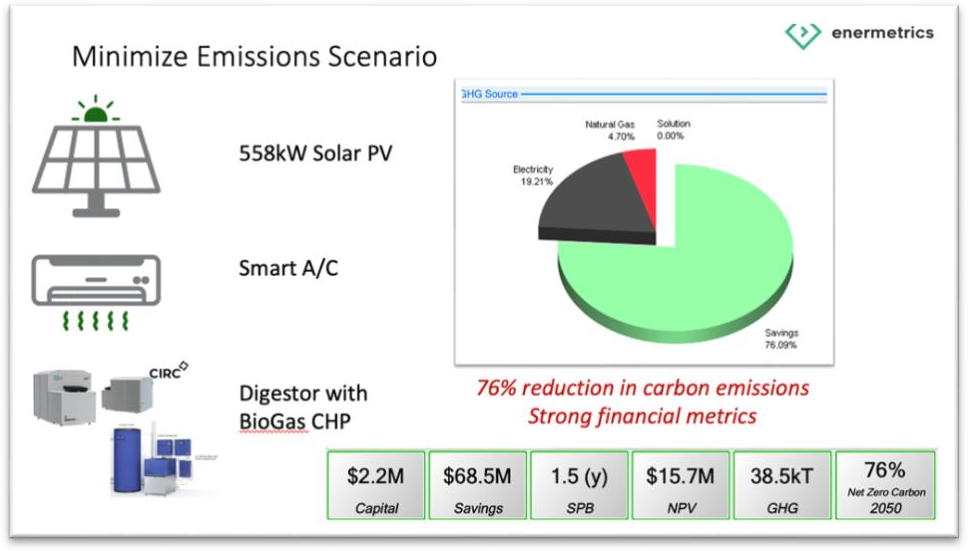
This project reduced the energy consumption by over 50% and heating by over 80%. This dramatically reduced the EUI.
Case Study – Hotel Consortium in the USA:
To lower energy expenses and emissions, a group of hotel owners in the USA carried out a study. They were able to significantly improve EUI and save money by evaluating data on energy use and putting energy-efficient technology, such as combined heat and power (CHP) systems, into practice.
Enermetrics completed a study of 2101 hotels across all 50 states to identify energy solutions that focus specifically on cost reduction while also addressing carbon reduction.
Using our proprietary energy simulation platform, we examined the financial and environmental value of a range of technologies. Technologies considered in this study include:
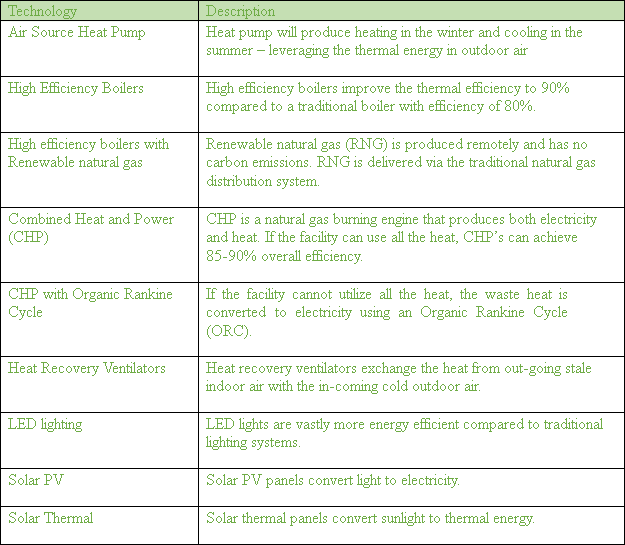
The simulation results are shown in these bubble charts. Each bubble represents a project recommendation (technology for a specific hotel). The colour represents the technology, the size represents the capital cost of the project.
These bubble charts allow us to quickly compare various technologies at specific facilities to each other and identify those that have the best financial and environmental performance.
Financial Performance
The charts shows the simple payback (affordability) on the X-axis and the lifetime savings (materiality) on the Y-axis.
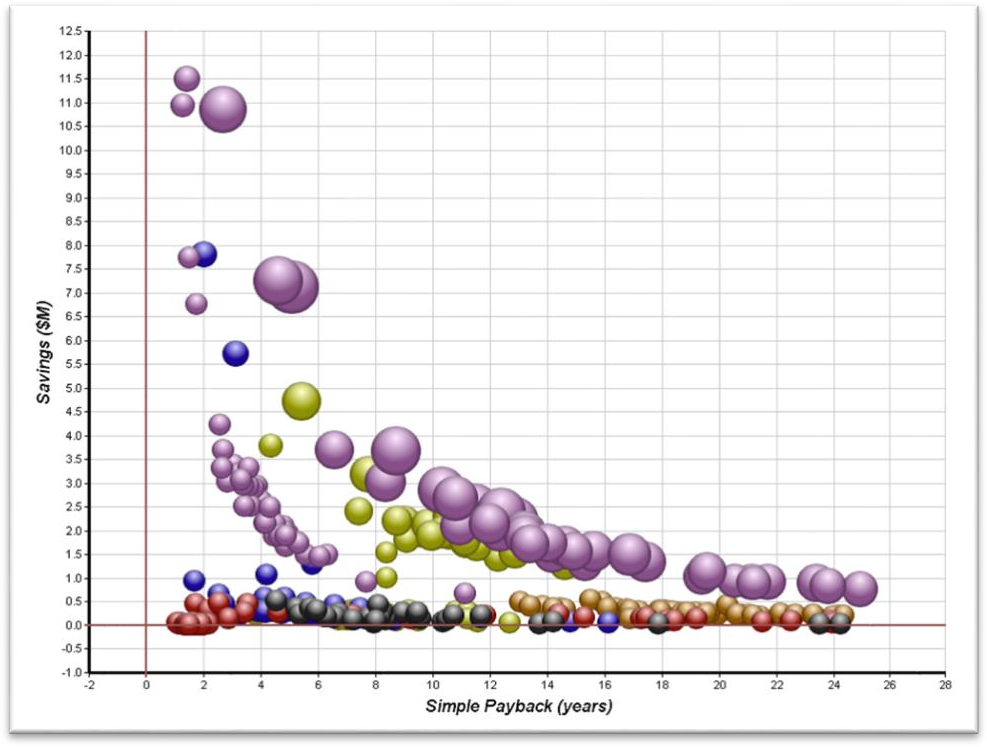
The biggest savings (bubbles at the top) are available at hotels in Hawaii where the energy rates are very high.
Hotels with pools have a much higher thermal demand that best align with onsite combined heat and power (CHP) solutions or fuel cells. These are shown with the smaller purple bubbles.
The larger purple bubbles represent the CHP with ORC. In these cases, the capital costs (size) are much higher resulting in a longer simple payback.
Solar PV (yellow bubbles) do not perform as well as base load generating technologies (small purple bubbles). This is due to the additional high demand charges which solar PV does not address.
Air source heat pumps (grey bubbles) have a mixed performance – they tend to do well in warmer climates. However, since heat pumps increase your electricity demand, base load generation technologies (CHPs for example) tend to have much better financial returns and are usually a better investment.
Fuel cells (blue) show some interesting performance both financially and environmentally, but will be challenged with the availability of hydrogen – at least in the short term.
Upgrading to high efficiency boilers (red) can have relatively short paybacks: they are not very expensive to install and can provide immediate savings. On the long term though the savings are minimal compared to what one can achieve with other technologies.
Financial and Environmental Performance
Changing the metrics, we can examine the financial and environmental performance. This analysis shows the financial performance (NPV on the Y-axis) against the environmental performance (GHG savings on X-axis).
Image too small.
We can see that the three project recommendations that have the best NPV are hotels in Hawaii with onsite baseload generation (red circle).
The fuel cells (blue bubbles) also show good financial and environmental performance.
The solar projects (yellow bubbles) certainly provide GHG savings but the financial performance is not as good as they do not address the peak demand as well as baseload technologies.
It is also interesting to note that there are many project recommendations that have positive emissions savings, but poor financial performance (negative NPV – bubbles below the red line).
Similarly, there are project recommendations that have positive NPV (above the red line) but have poor environmental performance (negative GHG emissions savings).
Exercise 5: EUI for your Facility
Electricity (kWh) and convert to GJ by multiplying by 0.0036
Natural Gas (GJ)

Course Manual 6: Energy Scores
Rating the energy efficiency of a building is a complex process that involves ranking a building’s energy consumption patterns alongside a peer group, normalizing for factors such as local climate and occupancy.
An energy performance score does not by itself explain why a building performs a certain way, or how to change the building’s performance. A score is an indicator as to the efficiency of the building… but not what to do about it.
Energy Star Portfolio Manager is a free service offered by the Department of Energy (USA and Canada) to simplify the normalization of data for weather and location.
Energy Star Portfolio Manager
The U.S. Environmental Protection Agency (EPA) created the online tool ENERGY STAR Portfolio Manager to help building owners and managers monitor and evaluate water and energy use throughout their whole portfolio of properties. The tool was introduced in 1999 and is a key component of the ENERGY STAR initiative, which promotes energy efficiency in commercial and residential buildings. A standardized platform for monitoring, tracking, and benchmarking greenhouse gas emissions, water and energy use, and other sustainability metrics is offered by Portfolio Manager.
Key Features
Data Management and Input: To monitor water and energy consumption, users can manually enter utility data or use automated solutions.
Benchmarking: Portfolio Manager enables customers to assess how their building performs in relation to comparable structures around the country.
Certification and Scoring: Based on their energy efficiency, buildings can receive an ENERGY STAR score between one and one hundred. To be eligible for ENERGY STAR certification, a person must score 75 or higher.
Reports and Analytics: To assist customers in understanding their patterns of energy and water consumption and locating areas for improvement, the program offers a variety of reports and analytical tools.
Customizable Metrics: Users have the option to monitor extra metrics like waste, indoor environmental quality, and greenhouse gas emissions.
Why Use ESPM
Comparing performance and benchmarking
The ENERGY STAR Portfolio Manager’s benchmarking feature is one of its main advantages. Owners and managers can assess a building’s energy efficiency by comparing its performance to that of comparable structures across the nation. When determining whether a structure is operating efficiently or needs to be improved, benchmarking is essential. Stakeholders can convey performance using an easy-to-understand metric, the ENERGY STAR standard score.
Data Driven Decisions
The capacity of Portfolio Manager to gather and evaluate energy data gives users the ability to make wise decisions. Users are able to spot trends, abnormalities, and inefficiencies by monitoring costs and usage patterns. Building managers can effectively allocate resources, prioritize energy-saving initiatives, and defend expenditures in energy efficiency upgrades using this data-driven strategy.
Reporting
Buildings are required by many local governments and jurisdictions to benchmark their energy performance and publish the data. Through the provision of a standardized platform for data collection and reporting, Portfolio Manager streamlines this procedure. In addition to guaranteeing legal compliance, this observance of local energy benchmarking legislation encourages accountability and openness in energy management procedures.
Improving the Marketability and Value of the Property
Buildings that use less energy are typically more valuable and easier to sell. A building’s ability to satisfy strict energy efficiency standards can be demonstrated to prospective tenants, investors, and buyers with the help of an ENERGY STAR certification, which can be an effective marketing tool. Higher occupancy rates, more rental income, and an overall improvement in asset value can result from this accreditation.
Benefits:
Cost Savings
Enhancements in Energy Efficiency: Building owners can drastically cut energy use and thus minimize utility bills by identifying energy inefficiencies and putting targeted upgrades in place. Modernizing HVAC systems, enhancing insulation, and adding energy-efficient lighting are examples of common upgrades.
Operational Efficiency: Further cost savings can be achieved by streamlining operations based on Portfolio Manager data insights. For instance, energy consumption during off-peak hours can be reduced by modifying building schedules to correspond with actual occupancy patterns.
Effect on the Environment
Lowering Greenhouse Gas Emissions: Buildings can drastically cut down on their greenhouse gas emissions by enhancing energy efficiency. This supports sustainability objectives and adds to larger initiatives to mitigate climate change.
Resource Conservation: Portfolio Manager not only helps users save energy but also tracks water usage, allowing them to take action to conserve water. Sustainable resource usage is encouraged by this combined emphasis on water and energy conservation.
Adherence to Regulations
Fulfilling State and Local Requirements: Energy benchmarking and transparency regulations have been passed by numerous states and localities. Building owners can easily comply with these laws by using Portfolio Manager. Because the tool’s standardized reporting formats are
frequently in line with regional regulations, managing compliance is made easier administratively.
Future Regulation Preparation: Buildings with a history of upgrades and historical performance data may be better positioned to meet future compliance requirements as energy efficiency laws become more strict.
Better Building Management
Improved Maintenance Scheduling: Monitoring energy efficiency over time assists in determining maintenance requirements and setting priorities for improvements. It is possible to arrange preventative maintenance more effectively, which lowers the possibility of unplanned equipment breakdowns.
Optimized Building Systems: Building systems, including HVAC, lighting, and water heating, can be optimized to run as efficiently as possible thanks to insights gathered from energy data.
Involvement of Stakeholders
Clear and transparent communication of building performance to stakeholders, such as renters, investors, and regulators, is made possible by the ENERGY STAR score and other performance parameters.
Tenant Satisfaction and Retention: Living or working in an energy-efficient building is frequently more comfortable and healthful. Higher rates of tenant satisfaction and retention are a potential outcome, and these factors are essential for long-term financial stability.
Challenges:
Accurate and comprehensive data
Difficulties with Data Collection: Complete and accurate data is necessary for proper benchmarking. It can be difficult to gather this data, especially in buildings with several occupants and different energy sources. Errors can occur with manual data entry, and initial setup for automated systems might be substantial.
Data Gaps: Inaccurate benchmarking results may arise from incomplete data. Reliable performance assessment depends on accurate capture and entry of all pertinent energy and water data.
Intricacy in Buildings with Multiple Tenants
Sub-Metering Problems: Accurately allocating energy use can be challenging in buildings housing several tenants. Submetering systems might be beneficial, but their installation and upkeep can be costly. Building owners could find it difficult to obtain a detailed picture of each tenant’s energy use without submetering.
Cooperation from Tenants: It can be difficult to get tenants to cooperate in providing energy statistics. Tenants might not have the essential information easily accessible or they might be reluctant to submit data because of privacy concerns.
The Learning Curve and Initial Setup
Complexity for New Users: For users who are unfamiliar with energy benchmarking in particular, setting up Portfolio Manager can be challenging. It takes time and effort to understand the numerous features and enter data accurately.
Training and Support: Building owners and managers may still need to make an investment in staff training in order for them to use the tool efficiently, even though the EPA offers resources and support. For certain organizations, this initial time and resource commitment may be prohibitive.
Constant Upkeep and Modifications
Frequent Data Input: Energy and water use data must be updated on a regular basis in order to preserve accurate and valuable benchmarking. It might take a lot of time to perform this ongoing upkeep, particularly for large portfolios.
Updates and Modifications to the Software: Users of Portfolio Manager must keep up with any new features and updates. This may mean continual training and adjustment, which some organizations may find difficult.
Understanding the Outcomes and Taking Initiative
Comprehending Benchmarks: Determining how to proceed and interpreting the outcomes can be difficult. Owners of buildings must have a well-defined plan in place for utilizing the data to make wise choices regarding energy-saving upgrades.
Putting gains into Practice: Energy efficiency gains need to be put into practice, even with clear data. This takes money and dedication. Owners of buildings need to be prepared to finance renovations and handle any resulting interruptions.
Conclusion
In conclusion, Energy Star Portfolio Manager is an effective tool for monitoring and enhancing building energy performance. Through data-driven decision-making, regulatory compliance, benchmarking, and increased property value, it provides a great deal of value. Reduction of environmental impact, financial savings, enhanced building operations, regulatory compliance, and stakeholder involvement are some of the advantages of adopting Portfolio Manager.
Nevertheless, there are drawbacks to the instrument as well. Users frequently face challenges with data completeness and correctness, multi-tenant building complexity, initial setup and learning curve, continuing maintenance, and result interpretation. Notwithstanding these difficulties, Portfolio Manager’s benefits make it a vital tool for any company looking to increase sustainability and energy efficiency.
Building owners and managers can utilize ENERGY STAR Portfolio Manager to significantly reduce energy usage, minimize operating costs, and contribute to a more sustainable future by tackling the difficulties and maximizing the advantages.
Useful metrics and reports from ESPM
Compares energy use and carbon footprint with similar facilities
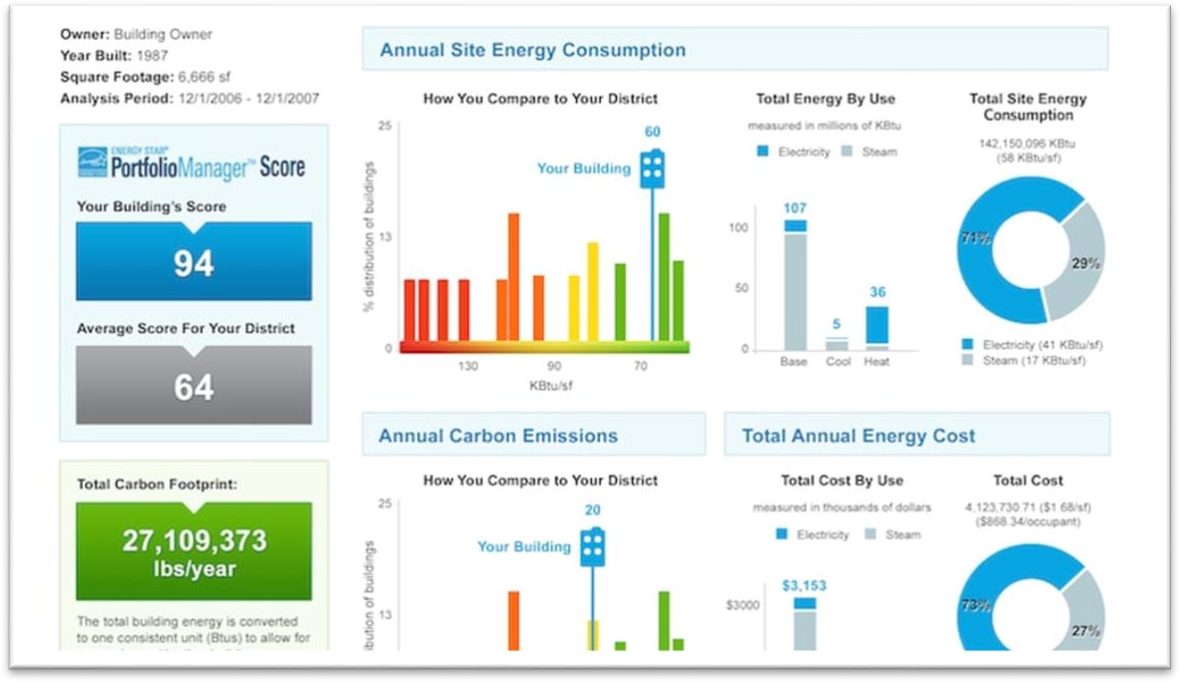
Project Study 6: Energy Star Portfolio Manager
Create an account
Create a facility
Upload your facility energy data from the Energy Workbook
Create energy meters for electricity and gas
Use the web spreadsheet rather than attempting to upload the data in a spreadsheet

Course Manual 7: Energy Consumers
The energy consumption requirements of large structures, such as hotels, commercial real estate, and institutional buildings, are significant and varied. To find ways to increase energy efficiency, cut expenses, and minimize greenhouse gas emissions, it is crucial to comprehend the main energy users in these structures. This thorough review examines the main energy users in these kinds of buildings, with an emphasis on important energy systems including heating, cooling, and electricity.
HVAC Systems (heating, ventilation, and air conditioning)
Among the biggest energy users in large buildings are HVAC systems, which are in charge of preserving healthy interior air quality and temperatures. There are various components that make up HVAC systems’ energy demand:
Particularly in colder climates, office buildings’ comfortable internal environment depends critically on heating systems. Various heating technologies provide differing degrees of cost, efficiency, and environmental impact. The following is a summary of the typical heating systems found in office buildings together with a relative efficiency comparison.
Furnaces
In office buildings particularly in North America, furnaces are a common heating source. These systems heat air, which is then dispersed via ductwork to warm various areas of the construction. Although furnaces run on natural gas, electricity, or oil, natural gas furnaces are the most often used because of their less fuel cost.
Modern high-efficiency gas furnaces can produce Annual Fuel Utilization Efficiency (AFUE) ratings of up to 98%, therefore converting 98% of the fuel into heat. Although they convert energy somewhat more efficiently, electric furnaces are sometimes more costly to run as electricity typically costs more than natural gas. Because of its more emissions, oil furnaces are less environmentally friendly and have less efficiency.
Relative Efficiency:
High (90–98% AFUE) gas furnace
Moderate (95–100% energy efficiency) yet higher running cost electric furnace
Lower (70-85% AFUE) oil furnace
Boiler
Underfloor systems, radiators, or fan coil units, boilers heat water then circulates it to heat rooms. Though gas-fired boilers are the most often used in commercial environments, boilers can be run on gas, oil, or electricity just as furnaces can.
High-efficiency condensing boilers recover heat from the exhaust gases that would otherwise be lost, therefore attaining efficiency ratings of up to 95%. Between 70% and 85% are the efficiency of non-condensing boilers. Although electric boilers can be 100% efficient, in places with high electricity prices they are usually less affordable.
Relative Efficiency:
High (90–95%) for the condensing gas boiler
Moderate (70–85%) non-condensing gas/oil boiler efficiency
High (100% efficiency but costly to run) electric boiler
Heat Pumps
Because they transport heat rather than create it, heat pumps are among the most energy-efficient heating systems available. Ground-source heat pumps (GSHPs) sometimes referred to as geothermal heat pumps and air-source heat pumps (ASHPs) are the two basic varieties.
Because they move heat rather than create it, heat pumps are far more efficient than furnaces or boilers. Usually having a coefficient of performance (COP) of 3-4, air-source heat pumps produce 3-4 units of heat for every unit of electricity consumed. With COPs as high as 4-5, ground-source heat pumps—which use the consistent subterranean temperature—are even more efficient.
Relative Efficiency:
Extreme high (300–400% efficiency) air-source heat pump
Extremely high (400–500% efficiency), although more expensive initially, ground-source heat pumps
Radiant Heating
Radiant heating systems run hot water tubing under the floor or via panels in the walls, floor or ceiling. These technologies directly warm items and people by means of the heat transfer mediated by infrared radiation.
Radiant heating reduces heat loss through ducts and offers even heating, thus it is more efficient than forced-air systems. Coupled with high-efficiency boilers or heat pumps, hydronic radiant floor heating—which runs hot water—is especially effective.
Relative Efficiency:
High (90–95%) relative efficiency radiant floor heating with a high-efficiency boiler
Moderate (100% energy efficiency but greater running cost) electric radiant heating
VRF, Variable Refrigerant Flow Systems
Advanced HVAC systems based on refrigerant as the heat transfer medium are VRF systems. Different areas of a building can be heated and cooled concurrently using them. Modern office buildings are getting VRF systems, which are quite efficient and rather common.
By adjusting refrigerant levels to instantly meet the heating or cooling demand of the building, VRF systems attain great energy efficiency. With Seasonal Energy Efficiency Ratio (SEER) ratings of 20 or more, they can attain efficiency levels akin to those of high-efficiency heat pumps.
Relative Efficiency:
Very high (300–400% efficiency) VRF systems, same like heat pumps
Hybrid Systems
Combining two or more heating technologies, hybrid systems maximize efficiency. For primary heating, a building might utilize a heat pump, for instance, plus a gas furnace as backup during really cold temperatures. Using the efficiency of the heat pump, this method guarantees consistent warmth under all circumstances.
Particularly in climates with fluctuating temperatures, hybrid systems exploit the characteristics of every technology and can save a lot of energy.
Relative Efficiency:
High (dependent on the combination but can maximize efficiency and costs) relative efficiency from a hybrid heat pump/furnace system.
Conclusion
Depending on the technology and fuel source, heating systems for office buildings have somewhat different relative efficiency. The most efficient are heat pumps—especially ground- source systems—then VRF systems, high-efficiency boilers, and furnaces. When combined with contemporary boilers or heat pumps, radiant heating also is quite efficient. System choice will rely on elements including climate, fuel availability, upfront cost, and running expenses. Office buildings can greatly lower their energy use and environmental impact by choosing the suitable heating system.
Lighting
Large buildings use a lot of energy for lighting, particularly for institutional and commercial structures. Energy usage is highly influenced by the kind of lighting and how it is operated.
Lighting Types:Incandescent Lighting: Incandescent lightbulbs are still used in certain buildings, despite their gradual replacement. They only transform a tiny portion of energy into light, which makes them incredibly inefficient.
Fluorescent Lighting: Although fluorescent lights, such as linear fluorescents and compact fluorescent lamps (CFLs), use less energy than incandescent bulbs, they contain mercury, which raises disposal concerns for the environment.
LED Lighting: When it comes to lighting, Light Emitting Diodes (LEDs) are the most energy- efficient choice. They produce excellent light, last a long time, and use less energy.
Light Switches: Occupancy sensors reduce energy waste in unoccupied areas by turning lights on and off based on room occupancy.
Daylight harvesting: This energy-saving technology maintains a constant illumination level by modifying artificial lighting in response to the amount of available natural daylight.
Water Heaters
Another major energy user in large buildings is water heating, especially in hotels and establishments like hospitals and colleges that have high hot water demands.
Water Heaters:
Storage Water Heaters: Usually running on natural gas, electricity, or oil, these heaters hold hot water in a tank.
Tankless Water Heaters: Often referred to as on-demand water heaters, these devices heat water instantly rather than storing it in a tank, which may result in energy savings.
Heat pump water heaters are more efficient than conventional electric water heaters because they use energy to transfer heat from the ground or the air to the water.
Hot Water Boilers: Boilers are sometimes used in large buildings, particularly those with central heating systems, to supply hot water for household use. When compared to standalone water heaters, these systems may be more energy-efficient.
Escalators & Elevators
Large buildings must include escalators and elevators to make moving people and things between floors easier. Electricity consumption for these systems is substantial.
Elevators: Regenerative drives, which store and repurpose energy, and LED lighting are examples of energy-efficient technology found in modern elevators. However, because of their antiquated motors and control systems, older elevators can be energy-intensive.
Escalators: When in use, escalators use energy continuously. Energy consumption can be decreased by putting energy-saving measures in place such motion sensors, which slow or stop the escalator when not in use.
Appliances and Office Supplies
The appliances and office equipment in commercial real estate and institutional buildings account for a significant amount of the energy load.
Servers and Computers: In business settings, desktop, laptop, and monitor computers are typical. Their energy consumption can be decreased by using power management settings and energy-efficient models. Data centres and server rooms use a lot of energy since they need both power and cooling to stay at ideal temperatures.
Appliances for the kitchen and break room:Freezers and refrigerators: These appliances use a lot of energy because they are always running, especially the older, less efficient types.
Coffee makers, microwaves, and other small appliances: Although they might not use a lot of energy individually, a group of them together can have an impact.
Printers and copiers: These appliances frequently utilize constant energy consumption when in standby mode. This consumption can be decreased with the use of power management tools and energy-efficient models.
Building Envelope
A building’s insulation, walls, windows, and roof all contribute significantly to its overall energy usage. The need for heating and cooling is decreased in a well-insulated structure because it keeps cool in the summer and retains heat in the winter.
Insulation: An effective insulation system for floors, walls, and roofs minimizes heat transfer, which lowers the amount of energy needed for heating and cooling. Commonly used materials for insulation are cellulose, foam, and fibreglass.
Doors and Windows: Double-glazed windows insulate better than single-pane windows because they have two layers of glass separated by a gas or air void.
Low-E Coatings: By reflecting heat and letting light through, low-emissivity coatings on windows enhance thermal performance.
Weather stripping: By caulking cracks around windows and doors, you can improve energy efficiency by preventing air leaks.
Equipment for Industry and Specialization
Specialized equipment can use a significant amount of energy in institutional buildings like hospitals and labs.
Medical Supplies: CT scanners and MRI machines: These devices require a lot of electricity to run and cool.
Equipment for Sterilization: The operation of autoclaves and other sterilization devices consumes a substantial amount of energy.
Tools for the Lab: Fume Hoods: Constantly exhausting air, fume hoods in laboratories use HVAC and power consumption.
Refrigeration Units: To retain chemicals and samples, laboratories frequently employ specialized refrigeration units, which can consume a lot of electricity.
Renewable Energy
Large structures have related energy needs, however some of their energy consumption can be mitigated by using renewable energy technologies.
Solar Photovoltaic (PV) Systems: By harnessing the power of the sun, solar PV systems may produce electricity and lessen their dependency on the grid. The energy produced can be utilized for HVAC systems and lights, among other building necessities.
Solar Thermal Systems: These systems lower the energy needed to heat water by heating it with sunshine. These devices are especially useful in areas with lots of sunshine.
Wind Turbines: Wind turbines can be built to generate electricity in certain large structures, particularly those located in windy places. Other power sources can be supplemented by the energy generated.
Battery Storage Systems: These devices store energy produced during off-peak hours or from renewable sources to be used during periods of high demand. They assist in controlling energy use, but they also need energy for upkeep and charging.
Conclusion
Numerous equipment and systems add to the overall energy consumption of major buildings, including hotels, office space, and institutional buildings. Significant energy users include office equipment, building envelope components, HVAC systems, lighting, water heating, escalators and elevators, industrial and specialized equipment, and renewable energy systems. Building owners and managers can find opportunities to increase energy efficiency, save operating costs, and support environmental sustainability by having a better awareness of these key energy consumers. Energy-saving upgrades to all of these systems have the potential to yield significant economic and environmental gains.
Case Study: Hotels in the Caribbean
Hotel / Resorts in the Caribbean consume most of their energy in air conditioning and hot water heating. An example of the energy consumption for a hotel in the Caribbean that had sub- metering demonstrates that 37% of the electricity is used for air conditioning. Other hotels report over 50% of the electricity is used for cooling.
Building equipment includes pumps for moving water and fans for moving air. This accounts for 10-20% of the electricity for many hotels.
Combined, air conditioning, hot water heating and building equipment accounts for 73% of the electricity consumed. Clearly these are areas on which to focus for energy savings.
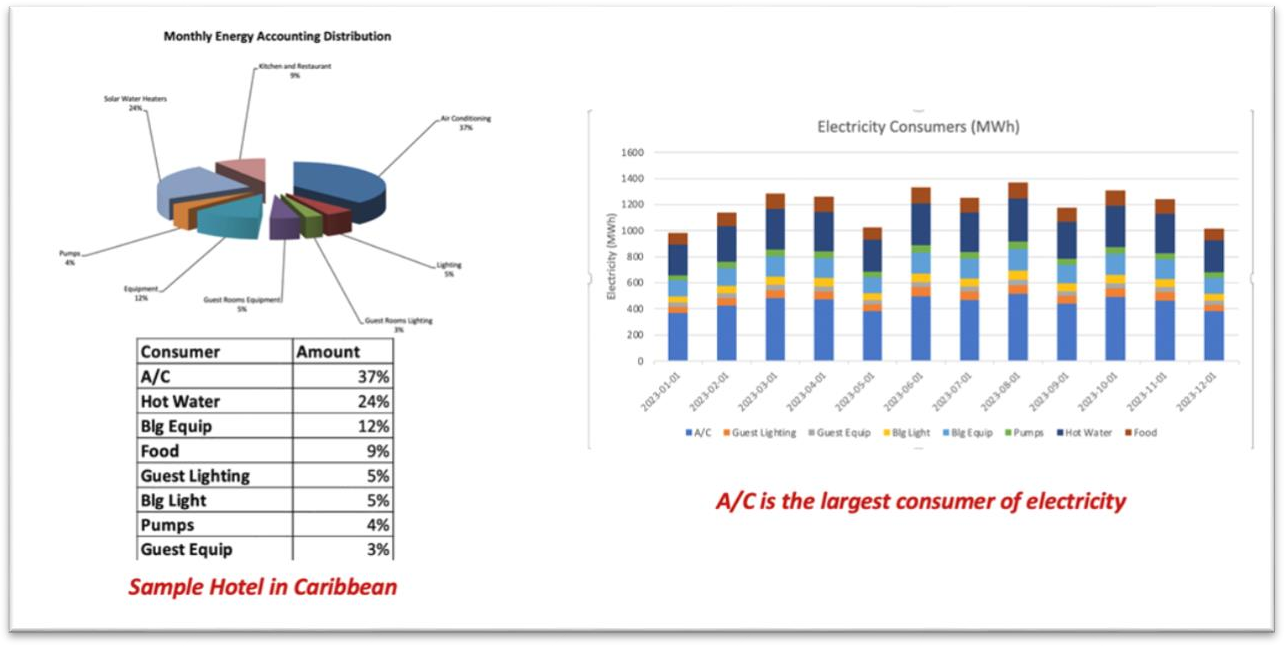
To achieve energy reduction for air conditioning, the resort implemented smart air conditioning sensors. Given that guests are in the room only 40% of the time, there is an opportunity to reduce A/C when the room is not occupied. Infrared sensors identify a person is in the room and releases the thermostat for guest control. A minimum set point enabled by BMS to prevent guests from setting the temperature too low. When the guest leaves the room, the system waits for N minutes, at which time the system updates the set point to unoccupied setting. The can result in a 40% reduction in A/C energy depending on the temperature delta between the outside air and the internal comfort settings.
In the energy modelling, the room is assumed to be occupied from 10pm to 9am on average. If the outdoor air temperature is over 27C, then we assume we can achieve a 40% reduction in energy. But if the outdoor air temperature is between 24 and 27, then we drop the energy savings to 25%. And if the outdoor air temperature is below 24, then we assume no reduction in AC energy.
The resulting savings in energy are shown below. The grey line shows the electricity consumption without smart air conditioning. The red line shows the energy consumption with smart air conditioning.
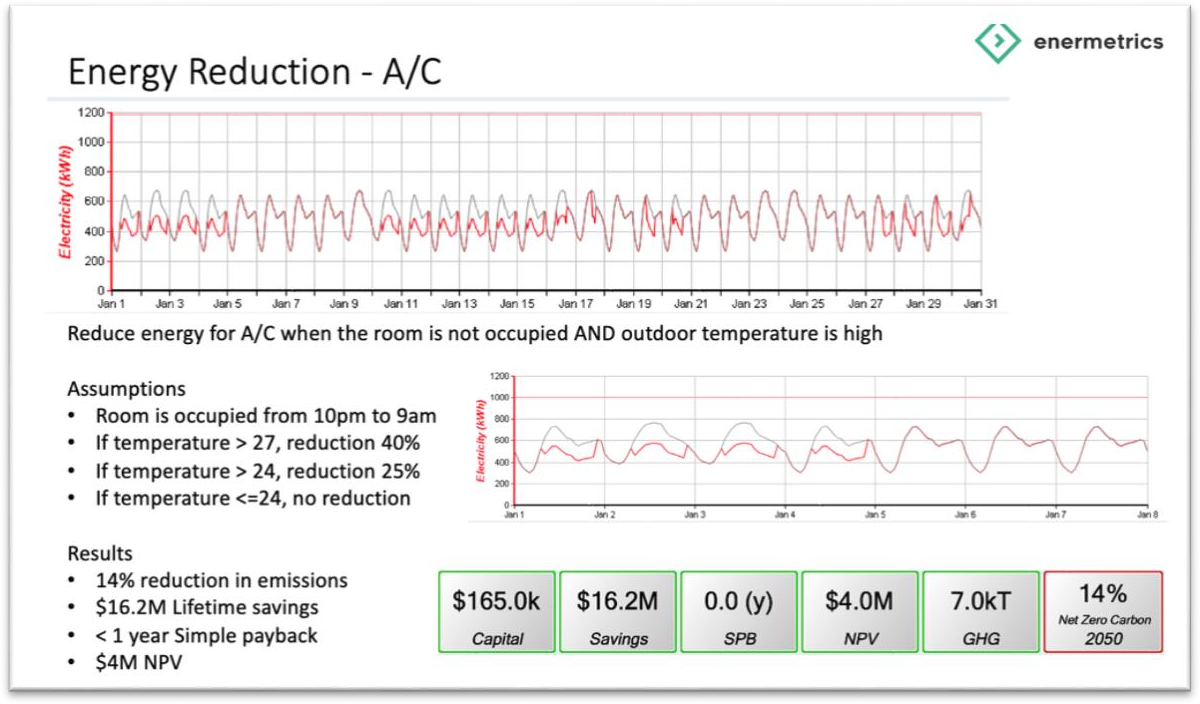
This resulted in energy reduction of 30% on average over a 12 month period. With a modest investment of $165,000 for 240 room resort, this resulted in a lifetime savings of over $16M (25 years) and a very strong NPV of $4M.
Project Study 7: Identify Your Major Energy Consumers
Equipment name
Power required (kW)
Operating schedule (weekdays, weekends, months, seasons)
If based on outdoor temperature, this can be modelled with weather data
If based on guest/tenant count, this can be modelled with occupancy data
Equipment name
Power required
Total monthly energy consumption

Course Manual 8: Sub-Meter Design
Need for submeters
You cannot improve what you don’t measure. Most facilities either don’t have submeters or they don’t utilize the data that they collect to make informed decisions. Without an understanding of where energy is being consumed, it is very challenging to decide where to make improvements.
Understanding Energy Use
Understanding energy use in commercial facilities is essential for spotting inefficiencies and potential cost-saving measures. Conventional utility meters give information on the overall amount of energy used in a building, but they are not precise enough to identify the systems or parts of the structure that use a lot of energy. Sub meters, on the other hand, make it possible to keep a closer eye on energy usage at a more particular level, like by department, floor, or individual piece of equipment.
Regulatory Compliance and Sustainability
Rules requiring thorough reporting of energy use and efficiency gains apply to many business buildings. Submeters aid in adhering to these rules by offering the information required to prove compliance. Furthermore, as more businesses set high standards for sustainability, submeters offer the precise information required to monitor these targets’ advancement and pinpoint opportunities for development.
Billing and Cost Distribution for Tenants
Submeters are necessary in commercial buildings with multiple tenants in order to precisely charge each renter for their specific energy use. This practice not only promotes equity but also motivates tenants to exercise greater awareness over their energy usage, which could ultimately result in a decrease in the building’s overall energy consumption.
Value of Submeters
Savings on Costs
The ability to save money is one of the main benefits of submeters. Building managers can put targeted energy-saving measures in place, including updating lighting systems, streamlining HVAC operations, or enhancing insulation, by pinpointing specific locations of excessive energy usage. Energy bills can be significantly reduced by taking these steps.
Enhanced Energy Economy
Submeter meters offer the information required to fully comprehend a building’s energy profile. This knowledge makes it possible to optimize building systems, which raises energy efficiency. Understanding the precise energy consumption of various HVAC zones, for instance, helps improve scheduling and temperature control, resulting in less energy being used than is necessary.
Better Facilities Administration
Facility managers can track the operation of different building systems in real time with submeter data. This makes it possible to quickly identify failing equipment and perform preventative maintenance. For instance, if a submeter displays an unusual rise in energy use in a particular location, it may be a sign that the equipment there needs to be replaced or maintained.
Data-Informed Decision Making
Submeters offer the comprehensive information required to make well-informed choices about energy consumption and energy-saving techniques. By illustrating the possible return on investment, this data can be used to support investments in energy-saving technology or retrofits. A submeter, for instance, would reveal that a specific section of the building constantly uses a lot of energy, which would support the construction of more energy-efficient HVAC or lighting systems.
Applications for Sub Meters
Energy Audits
Submeters are a crucial tool for performing thorough energy audits. They offer the information required to determine where energy is being used and where savings are possible. Submeter data from an energy audit can be used to pinpoint inefficient systems or locations and suggest focused fixes.
Billing of Tenants
Submeters provide accurate tenant billing in multi-tenant buildings based on real energy usage. Tenants are encouraged to consume less energy as a result of this, which also guarantees that they are paying their fair amount. Tenants, for instance, may be more inclined to spend money on energy-saving devices like LED lighting or programmable thermostats if they are aware of their energy usage and expenses.
Monitoring Performance
Sub meters make it possible to follow building systems in real time and to monitor them continuously. This can assist in spotting patterns and irregularities in energy consumption, which may point to problems like equipment failures or inefficiencies. For instance, if a submeter displays an abrupt increase in energy consumption in a particular region, it may be an indication that the equipment there requires maintenance or is malfunctioning.
Validation of Energy-Savings
Sub meters can be used to confirm the real savings made when energy-saving measures are put in place. Ensuring that investments in energy efficiency are yielding the anticipated benefits is contingent upon this. Sub meters can supply the information required to confirm that, in the event that new HVAC controls are installed to lower energy consumption, the controls are operating as intended and producing the anticipated savings.
Reports on Compliance
Comprehensive reporting of energy use and efficiency gains is mandated by numerous legislation. The information required to meet these reporting standards is provided by submeters. Submeter data, for instance, can be used by buildings subject to energy benchmarking legislation to give the comprehensive reporting mandated by these standards.
Enhancement of Construction Systems
Submeters supply the information required to maximize the performance of building systems, including lighting, plug loads, and HVAC. Significant energy savings and increased occupant
comfort may result from this. One way to reduce energy use during unoccupied hours is by timing HVAC and lighting systems to match occupancy patterns, which can be achieved by understanding the energy use patterns of different regions of the building.
Challenges
Cost
Submeter installations can be costly, particularly in older structures where retrofitting could be necessary. The installation and integration of the meters with the current building management systems are included in the price, in addition to the meters themselves. For instance, it can be expensive to install submeters in a sizable commercial building with several tenants and intricate electrical systems.
Information Management
Submeters produce a lot of data, which needs to be gathered, archived, and examined. Strong data management systems and the know-how to analyze the data and draw conclusions from it are needed for this. To handle and analyze thousands of data points every day, for instance, a building with several dozen submeters may need advanced data management systems.
Integration with Existing Systems
It can be difficult to integrate submeters with current building management systems, especially in older structures with antiquated infrastructure. To get the most out of the sub meters, you need to make sure they can communicate well and work with the current systems. To properly incorporate sub meters, for instance, a building with an outdated building management system might need major improvements.
Maintenance and Calibration
Submeters necessitate routine calibration and maintenance in order to guarantee precise data gathering. This necessitates specialized resources and raises continuous operating costs. For instance, it can be expensive and time-consuming to calibrate sub meters on a regular basis to make sure they are giving accurate readings.
Security and Privacy
There may be security and privacy issues due to the more detailed data that submeters are able to gather. It is essential to make sure that the data is securely transferred, preserved, and that only authorized individuals may access it. Submeter data, for instance, can provide comprehensive details on a building’s activities, some of which may be sensitive and need to be kept private.
Interpretation of Data
Sub meters offer a multitude of data, but it can be difficult to evaluate this data in order to find useful insights. Proficiency in data analysis and in-depth knowledge of building systems and operations are prerequisites for this. For instance, a thorough understanding of building systems and operations together with proficiency in data analysis are necessary to spot trends and abnormalities in submeter data.
Resistance to Change
The modifications needed to install and operate sub meters efficiently may encounter resistance
from building managers and inhabitants. This may entail modifications to the monitoring and management of energy use as well as installation-related disturbances. In a multi-tenant building, for instance, tenants may object to submeter installation if it interferes with their daily activities.
Conclusion
Submeters are a useful instrument for cutting expenses and increasing energy efficiency in business buildings. They offer the comprehensive data required to comprehend energy consumption, spot inefficiencies, and put specific energy-saving strategies into action. Submeter installation and use do present certain difficulties, though, namely with regard to cost, data management, and system integration. It will need careful planning, the correct technology investment, and the know-how to analyze and act upon the submeter data to overcome these obstacles. Building managers can fully utilize submeter meters to boost energy efficiency, cut expenses, and meet sustainability objectives by resolving these issues.
Case Study: High Density Residential
A high density residential complex in Calgary Alberta provides affordable housing for 375 tenants. In order to reduce costs for tenants, the complex provides water, heat and electricity as part of their rent. The complex implemented onsite electricity generation with combined heat and power (CHP) as well as solar PV arrays.
Since electricity was now a cost for the complex, the owners implemented a comprehensive sub- metering system where the hot and cold water, heat and electricity were all metered for all suites. The data was collected and managed in a data management system “Skyspark” from SkyFoundry.
This comprehensive sub-metering provided the complex with the ability to rank each of the suites and encourage energy conservation through a tiered service pack. Those suites that used less energy (heat and power) were provided a discount on their service pack. Those suites that used more energy had more expensive service packs.
Since the heat and power were generated onsite, the cost of energy for each suite was reduced by more than 40% compared to the costs using the local grid provider.
Project Study 8: Design Your Submeter Needs
Equipment Name
Type (pump, fan, compressor, air conditioner, heat pump, etc.)
Age
Condition
Power rating (kW)
Voltage rating (V)
Equipment Name
Type (boiler, hot water, etc.)
Age
Condition

Course Manual 9: Energy Data Management
Overview
Energy data management is the process of gathering, storing, analyzing, and using energy-related data in an organized manner in order to maximize energy use, improve energy efficiency, and assist with sustainability projects. This procedure entails keeping an eye on a variety of energy measures, including the use of steam, gas, water, electricity, and building portfolios. Reaching regulatory compliance, cutting expenses, finding inefficiencies, and achieving sustainability objectives all depend on effective energy data management.
Components of an Energy Data Management System
Energy data management consists of a number of elements, such as:
Data collection: Compiling information from multiple sources, including sensors, building management systems (BMS), utility meters, and submeters.
Data Storage: Providing scalable and safe storage options for substantial amounts of data.
Data analysis is the process of interpreting data, spotting trends, and identifying areas that need improvement using analytical tools and procedures.
Reporting and Visualization: Producing reports and data visualizations to aid with comprehension and decision-making.
Actionable Insights: Making decisions and putting energy-saving strategies into practice based on the data analysis.
Features of an Energy Data Management System
Monitoring in Real Time
Facilities managers may watch usage trends and identify irregularities as soon as they arise with the help of energy data management systems, which offer real-time monitoring of energy consumption. This capability is essential for responding quickly to problems like equipment failures or unforeseen spikes in energy consumption.
Integration of Data
These systems combine information from various sources, such as building management systems, sensors, utility meters, and submeters. This all-encompassing strategy guarantees that all pertinent data is taken into account during the research, offering a thorough understanding of energy consumption.
Automated Information Gathering
By eliminating the need for human data entry, automated data collection lowers the possibility of mistakes and guarantees reliable and consistent data collecting. This functionality is especially crucial for big facilities that have a lot of data points.
Higher Level Analytics
Energy data is analyzed by energy data management systems using advanced analytics, such as artificial intelligence and machine learning. These instruments are able to recognize trends, project future energy requirements, and provide optimization techniques. Machine learning algorithms, for instance, can forecast times of high demand and suggest cost-saving load- shedding techniques.
Adaptable Dashboards
With customizable dashboards, users can see data in a way that best suits their requirements. It is possible for users to develop dashboards that show comparisons, trends, and key performance indicators (KPIs), which facilitates understanding energy use and pinpointing areas for improvement.
Compliance and Reporting
Systems for managing energy data produce comprehensive reports that are useful for reporting on sustainability, internal audits, and regulatory compliance. These reports assist firms in fulfilling their reporting requirements by providing information on emissions, cost analysis, and energy usage statistics.
Notifications and Alarms
When specific thresholds are surpassed or abnormalities are found, these systems can be set up to send alerts and messages. This function guarantees that problems are resolved quickly, cutting expenses and energy waste.
Benchmarking Energy Use
Through energy benchmarking, a building’s energy performance is evaluated in relation to other comparable structures or industry norms. This function identifies areas for improvement and assists companies in gauging their performance in comparison to their counterparts.
Value of Energy Data Management
Cost Reduction
Managing energy data well results in huge cost savings. Organizations can save their energy costs by finding inefficiencies and optimizing energy use. For instance, significant savings can result from locating and fixing an inefficient HVAC system.
Improved Energy Efficiency
Energy data management makes it possible to analyze and monitor energy use continuously, which boosts energy efficiency. This lowers a building’s environmental effect while also lowering costs. One way to cut energy use is to optimize lighting schedules based on occupancy data.
Regulatory Compliance
Strict laws governing energy consumption and emissions are in place in many areas. Energy data management systems provide precise and comprehensive data on energy usage, which assists enterprises in adhering to these standards. By doing this, businesses are protected from fines and other consequences related to non-compliance.
Sustainability Objectives
More and more companies are establishing challenging sustainability objectives, such reaching net-zero emissions. Effective management of energy data is essential for monitoring the advancement of these objectives and pinpointing further actions to enhance sustainability.
Information on energy consumption, for instance, can help with investment decisions for renewable energy sources.
Efficiency of Operations
These solutions make it possible for building systems to operate more efficiently by offering comprehensive insights into energy use. This may result in increased equipment longevity, less maintenance requirements, and better occupant comfort. Predictive maintenance, for instance, can lower downtime and avoid equipment breakdowns by using energy data.
Improving Decision-Making
Energy data management offers the information required to make well-informed decisions. This data can be used by executives and facility managers to set priorities for energy-saving projects, manage resources wisely, and defend spending on energy-efficient equipment. For example, a thorough energy audit may show that switching to LED lighting provides a significant return on investment.
Challenges in Implementing Energy Data Management
Costs
Setting up an energy data management system can be expensive at first. This covers the price of installation, software, and hardware (such as sensors and meters). Moreover, there can be expenses involved in connecting the system with the current infrastructure.
Privacy and Data Security
Handling massive energy data sets raises serious privacy and data security issues. Ensuring the security of data management systems is crucial for organizations to safeguard confidential information against cyber threats. Data on energy consumption, for instance, may show patterns of occupancy that, if improperly guarded, could be exploited.
Integration with Current Systems
It can be difficult to integrate energy data management systems with the infrastructure and building management systems that are already in place, particularly in older structures. Careful preparation and maybe large changes to current systems are needed to ensure compatibility and smooth data flow.
Quality and Accuracy of Data
The quality and accuracy of the data gathered determine how effective energy data management is. It is essential to make sure that sensors and meters are calibrated appropriately and that data is regularly gathered. Inaccurate judgments and ineffectual energy management techniques might result from poor data quality.
Implementation Complexity
An energy data management system’s implementation might be difficult and time-consuming. In order to properly manage the implementation process, organizations must make sure they have the requisite resources and expertise. This could entail educating current employees or bringing in outside consultants.
Resistance to Change
It is possible that facility managers and building occupants won’t agree to the adjustments needed to properly install and operate an energy data management system. Effective communication and system benefits demonstration are necessary to overcome this opposition. To win over stakeholders, for instance, show them how possible cost savings and sustainability benefits might be achieved.
Using Building Management Systems for Managing Data
Integrating with Building Management Systems
Building management systems, or BMSs, are essential to energy data management because they offer a unified platform for monitoring and managing a variety of building systems, such as security, lighting, and HVAC. Real-time monitoring and easy data gathering are made possible by the integration of energy data management with a BMS.
Holistic View of Building Operations
Facility managers may gain a comprehensive understanding of building operations by using a BMS that is connected with energy data management. This allows them to see how various systems work together and influence total energy consumption. Finding inefficiencies and improving building performance require this all-encompassing perspective.
Automated Control
Based on the gathered data, BMS can automate the control of building systems. For instance, a BMS can optimize comfort while reducing energy consumption by modifying HVAC settings in response to occupancy patterns identified by means of energy data. High levels of automation like this can save a lot of energy.
Predictive Maintenance
Predictive maintenance can be performed using energy data obtained from a BMS to find any problems before they result in equipment failure. This proactive strategy prolongs the life of building systems and lowers maintenance expenses and downtime.
Enhanced Reporting
Comprehensive reports on energy performance and usage can be produced by a BMS that has integrated energy data management features. These reports offer important insights into building operations and can be utilized for internal audits, regulatory compliance, and decision-making.
Cloud-Based Energy Management Systems
Portfolio Manager for Energy Star
An extensively utilized cloud-based energy management solution called Energy Star Portfolio Manager assists businesses in monitoring and controlling their water and energy usage. It has benchmarking features that let users assess how well their buildings perform in comparison to other structures of a similar kind. The system provides capabilities for tracking and establishing energy-saving targets in addition to generating comprehensive data.
EnergyHub
In order to provide real-time monitoring and control, EnergyHub offers a cloud-based platform
that interfaces with a variety of energy systems and devices. It optimizes energy use by identifying opportunities for energy savings through advanced analytics. Demand response programs are supported by EnergyHub’s technology, which enables businesses to lower their energy usage during peak hours.
Enertiv
Enertiv offers an energy management platform that is cloud-based and concentrates on real-time data collection and analysis. It finds inefficiencies and suggests energy-saving actions using machine learning algorithms. Predictive maintenance, tenant billing, and thorough reporting are just a few of the capabilities that Enertiv’s platform offers, making it a complete commercial building solution.
Lucid BuildingOS
Lucid BuildingOS is a cloud-based platform for energy management called BuildingOS collects data from multiple sources, such as sensors, utility meters, and submeters. It provides comprehensive analytics, configurable dashboards, and real-time monitoring. BuildingOS facilitates automated building system control, sustainability reporting, and energy benchmarking.
GridPoint
GridPoint offers an energy management system that is cloud-based and integrates advanced analytics, real-time monitoring, and data collection. It provides automated control, demand response, and energy benchmarking technologies. The platform from GridPoint offers comprehensive reporting, predictive maintenance, and integration with several building systems.
SkySpark
A robust cloud-based energy analytics tool called SkySpark gathers and examines data from several building systems. It makes recommendations for energy-saving actions based on pattern recognition, anomaly detection, and machine learning. The platform from SkySpark enables thorough reporting, predictive maintenance, and real-time monitoring.
Conclusion
In order to optimize energy use, cut expenses, and meet sustainability targets in commercial buildings, efficient energy data management is essential. Energy data management systems offer considerable benefits in terms of lower costs, increased energy efficiency, regulatory compliance, and better decision-making. capabilities like real-time monitoring, automatic data collecting, advanced analytics, and configurable dashboards are just a few of the capabilities available. Nevertheless, there are difficulties in putting these systems into practice, such as large upfront expenditures, worries about data security, difficult integration, and resistance to change. Building management systems (BMS) and energy data management integration can offer a comprehensive understanding of building operations as well as automated control, predictive maintenance, and improved reporting. Energy Star Portfolio Manager, EnergyHub, Enertiv, Lucid BuildingOS, GridPoint, and SkySpark are a few examples of cloud-based energy management systems that provide complete solutions for organizing energy data and enhancing building performance.
Case Study: Building Management System for Hotel / Resort
A hotel / resort struggled with very high energy costs. The resort implemented a number of systems to reduce their electricity consumption
Solar PV
Smart A/C
Sea water chillers
Bio-digester and small CHP
Since the major electricity consumption was due to air conditioning, the resort focused on reducing electricity consumption in this area. This included the smart A/C system described earlier as well as sea-water chillers to pre-chill the return water before entering into the main chillers. The result was that the main chillers didn’t have to work as hard as the water was already cooled down. However, the resort needed to understand if the cost of running the pumps for the cold sea water was less than the cost of running the chillers.
In order to track the performance of these investments, the resort implemented a number of sub- meters which captured the energy consumption in the existing building management system (BMS). This included:
Solar PV output
Air conditioner fans and pumps
Sea water chiller pumps
Electricity and heat generated by the CHP
The data was captured in their BMS and then used to generate analyses and reports for management demonstrating the performance of the investments.
Exercise 9: Determine the Features you need in Your Energy Data Management System

Course Manual 10: Emissions Data
Emissions for your facility will break down into three categories, scope 1, 2 and 3.
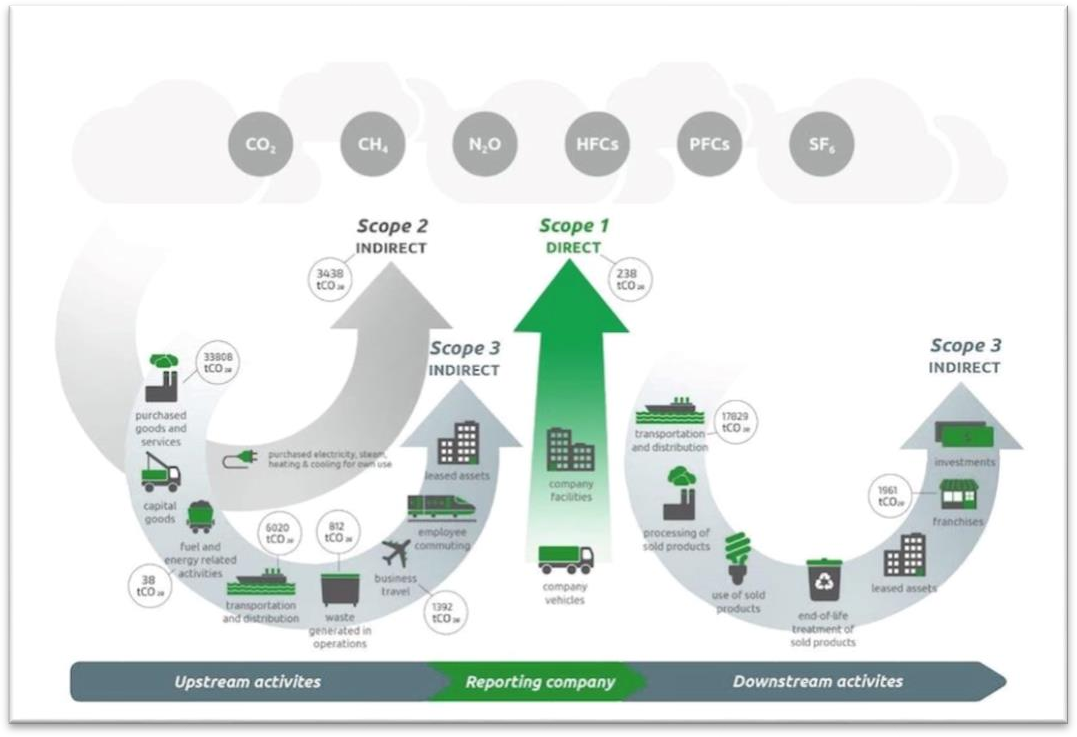
NEED CLEARER IMAGE
Scope 1 Emissions
Direct greenhouse gas (GHG) emissions from sources under an organization’s ownership or control are referred to as scope 1 emissions. This covers emissions from burning in automobiles, boilers, furnaces, and other sources that are owned or under control. As examples, consider:
• burning of fuel on-site to produce energy or heat.
• emissions from cars owned by the firm.
• emissions fugitive due to equipment malfunctions.
Scope 2 Emissions
Indirect greenhouse gas emissions resulting from the use of energy, steam, heat, or cooling that has been purchased fall under scope 2. Although these emissions are attributable to the entity using the energy, they happen at the plant where the electricity is created. As examples, consider:
• emissions from the production of power that was purchased.
• emissions from heating, cooling, or purchased steam.
Scope 3 Emissions
All indirect emissions that happen along the reporting company’s value chain but are not covered by Scope 2 are referred to as Scope 3 emissions. Although these emissions are a result of the organization’s operations, the sources of these emissions are not within the organization’s direct control or ownership. As examples, consider:
• emissions resulting from the manufacturing of products and services acquired.
• emissions from staff commuting and business travel.
• emissions from the removal of rubbish.
• emissions from using goods that have been sold.
Value of Managing Emissions Data
Adherence to Regulations
Adherence to local, national, and international environmental norms and standards necessitates the efficient administration of emissions data. Penalties, legal action, and reputational harm may arise from noncompliance. For example, under frameworks like the United States Environmental Protection Agency (EPA) laws or the European Union Emissions Trading System (EU ETS), several countries compel enterprises to declare their GHG emissions.
Customer Reporting
Consumers are calling for more information on how the goods and services they buy are affecting the environment. Businesses may show their clients how committed they are to sustainability and lowering carbon footprints by providing them with comprehensive reports that are made possible by accurate emissions data. Customer loyalty and brand reputation can both be improved by this transparency.
Owners and Management
For internal stakeholders, such as management and owners, to make well-informed decisions about investments, operational modifications, and sustainability programs, accurate emissions data is essential. Emissions data is useful for tracking advancement, establishing reasonable objectives, and proving corporate accountability. Additionally, it aids in the creation of plans to lower emissions and enhance environmental performance in general.
Sustainability Objectives
Achieving business sustainability objectives, such as lowering carbon footprints, reaching net- zero emissions, and increasing energy efficiency, depends critically on managing emissions data. Emissions data provide a starting point for tracking advancement and pinpointing areas in need of improvement. For instance, information on Scope 1 and 2 emissions can help with decisions regarding upgrading to more energy-efficient equipment or making investments in renewable energy.
Financial Performance
Better energy efficiency and less waste can result in cost savings through effective emissions management. Additionally, since more investors are taking environmental, social, and governance (ESG) factors into account when making decisions, businesses with strong sustainability policies may find it simpler to obtain investment. For instance, cutting back on energy use can save operating expenses, and adopting sustainable business practices can make a company more appealing to investors who care about the environment.
Challenges for Computing and Managing Emissions Data
Data Gathering
Accurate and thorough emissions data collection can be difficult, especially for large enterprises
with numerous sites and varied operations. It is necessary to collect data from a variety of sources, such as supplier information, fuel use statistics, and utility bills. Robust data gathering procedures and systems are necessary to guarantee the precision and comprehensiveness of this data.
Integration of Data
It is difficult to combine emissions data from several sources into a coherent management system. This procedure may become more difficult due to disparate data formats, measuring units, and reporting standards. Precise emissions reporting depends on capturing and correctly integrating all pertinent data. It is necessary to standardize and combine data from many sources, such as energy meters, car fuel logs, and trash disposal records.
Computing Scope 3 Emissions
Calculating scope 3 emissions can be particularly difficult because of the wide range of activities and outside parties involved. Businesses must rely on data from third parties, including suppliers and service providers, whose quality and dependability may vary. It takes a lot of work to have a thorough grasp of the value chain and to collect reliable data from all pertinent sources.
Consistency and Quality of Data
For emissions reporting to be dependable, high-quality and consistent data must be ensured. Erroneous emissions computations might result from different measurement standards, inconsistent data collection techniques, and data input mistakes. To ensure data integrity, defined procedures for data collection and validation must be put in place.
Regulatory Challenges
Reporting requirements and environmental restrictions are always changing. It takes constant work and resources to stay on top of these changes and guarantee compliance. Businesses need to keep up with changing rules and modify their emissions control procedures accordingly. For instance, extra reporting mechanisms or adjustments to data gathering procedures may be required in order to comply with new reporting standards.
Resource and Technological Limitations
Both technological advancements and qualified staff are needed for the implementation and upkeep of an efficient emissions data management system. Investing in the requisite technology and experience may provide a challenge for smaller firms or those with restricted resources. For example, proficient data scientists and sophisticated data analytics technologies are frequently needed to properly evaluate and understand emissions data.
Data Security
Similar to other company data, emissions data might raise security issues. It is essential to guarantee the security and privacy of emissions data in order to guard against data breaches and illegal access. To protect sensitive data, strong cybersecurity procedures must be put in place.
Sensitive emissions data, for instance, might be protected by utilizing secure data transport protocols and encrypted data storage.
Tools Available for Managing Emissions Information
Carbon Trust Footprint Manager
A sophisticated software program called Carbon Trust Footprint Manager was created to assist businesses in measuring, controlling, and lowering their carbon footprints. It offers thorough reporting on emissions, spots chances to cut emissions, and monitors development over time. The platform facilitates adherence to several regulatory requirements and reporting standards.
Corporate Sustainability Software from Sphera
A comprehensive business sustainability software suite from Sphera includes modules for data management on emissions. Through the platform’s data collecting, analysis, and reporting tools, businesses may monitor their environmental performance and meet sustainability objectives. It assists in locating opportunities for emissions reduction and supports Scope 1, 2, and 3 emissions reporting.
Emissions Management via Enablon
Organizations can track and report their greenhouse gas emissions with the use of Enablon’s emissions management software. The platform provides automatic reporting, sophisticated analytics, and real-time data capture. It facilitates compliance with international standards like ISO 14064 and the GHG Protocol and connects with multiple data sources.
IBM Environmental Intelligence Suite
Tools for managing emissions data, tracking environmental impact, and improving sustainability practices are all included in IBM’s Environmental Intelligence Suite. The suite uses artificial intelligence (AI) and sophisticated analytics to deliver insights into emissions data, assisting businesses in seeing patterns and areas for development. Both regulatory compliance and thorough emissions reporting are supported.
SAP Safety, Health, and Environment Management
Features for managing emissions data are included in SAP’s EHS Management solution. Through the platform’s data collecting, analysis, and reporting tools, businesses can monitor and control their environmental effect. With its flexibility to interface with other enterprise systems, SAP’s solution offers a comprehensive picture of sustainability performance.
Ecova Energy and Sustainability
Comprehensive energy and sustainability management solutions, such as emissions data management, are available on the Ecova platform. The program offers comprehensive reporting features, sophisticated analytics, and real-time data tracking. Ecova assists businesses in achieving their sustainability objectives and promotes adherence to a range of environmental standards.
The Resource Advisor at Schneider Electric
Schneider Electric’s Resource Advisor is a cloud-based tool for data management related to energy and sustainability. It offers resources for monitoring energy use, greenhouse gas emissions, and other sustainability indicators. Organizations may find and take advantage of possibilities for emissions reduction by using the platform’s comprehensive analytics and reporting features.
CarbonetiX
A set of tools for controlling and lowering carbon emissions is provided by CarbonetiX. Their program offers insights into energy use and carbon footprint and assists enterprises in measuring, managing, and reporting emissions data. The platform facilitates compliance with several environmental regulations as well as the reporting of emissions under Scope 1, 2, and 3.
Gensuite Environmental Management
Data management modules are included in the environmental management suite from Gensuite. The platform helps firms monitor their environmental performance by offering tools for data gathering, analysis, and reporting. Gensuite facilitates adherence to global norms and aids in locating chances for lowering emissions.
VelocityEHS
An environmental management platform with features for controlling emissions data is provided by VelocityEHS. The program offers automated reporting, sophisticated analytics, and real-time data tracking. VelocityEHS assists businesses in achieving their sustainability objectives and facilitates compliance with a range of environmental standards.
Conclusion
A crucial component of contemporary corporate operations is the calculation and management of emissions data, which is motivated by legal constraints, consumer demands, and environmental objectives. Understanding and reporting Scope 1, 2, and 3 emissions—each with its own set of difficulties—is essential to the effective management of emissions data. Although controlling emissions data is beneficial for customer satisfaction, regulatory compliance, and corporate decision-making, it also comes with difficulties for data integration, collection, quality, and security. There are a number of commercial programs that offer strong capabilities for data collecting, analysis, and reporting to help enterprises manage their emissions data. Through the utilization of these instruments, entities can augment their overall operational efficacy, accomplish sustainability objectives, and improve their ecological performance.
Case Study: Manufacturing
Case Study: XYZ Manufacturing Facility’s Emissions Data Management Overview
Leading manufacturer of industrial components XYZ Manufacturing understood how important it was to control and lower their greenhouse gas (GHG) emissions. In response to mounting regulatory demands and a company commitment to sustainability, XYZ started an extensive program for managing emissions data. This case study examines the actions made, obstacles encountered, and results obtained in their quest for improved emissions data management.
Context
XYZ Manufacturing has multiple locations across the globe, all of which have different energy usage and emissions profiles. One of the company’s environmental objectives, in line with the Paris Agreement, was to reduce greenhouse gas emissions by 30% by 2030. XYZ required a precise and thorough understanding of their emissions across all operations in order to achieve
these targets.
Challenges
Data Fragmentation: It was challenging to compile and analyze emissions data since it was dispersed over several systems and formats.
Absence of Real-Time Data: XYZ mostly relied on sporadic manual data collection, which was error-prone and time-consuming.
Regulatory Compliance: The data management process was made more difficult by the disparate reporting requirements across different areas.
Resource Restrictions: Limited internal knowledge of cutting-edge analytics and data management tools.
Actions Made
Establishing Objectives:
Carried out a preliminary evaluation of the methods used to collect emissions data at the moment
Establish precise goals for the emissions data management program, emphasizing regulatory compliance, accuracy, and real-time monitoring.
Choosing an Information Management System:
assessed several emissions data management systems (EDMS) for usability, scalability, and compatibility with current infrastructure.
To enable real-time data collection, integration, and analysis across all facilities, a cloud- based EDMS was selected.
Integration of Data:
Created a framework for data integration to combine emissions information from several sources, such as energy use, manufacturing procedures, and transportation.
Standardized data formats and made sure the selected EDMS was compatible.
Analytics and Real-Time Monitoring:
Installed IoT devices and sensors across the facilities to collect emissions data in real time.
EDMS data integration allowed for real-time analytics and monitoring.
Used machine learning and advanced analytics to find trends, patterns, and areas that needed improvement.
Regulatory Disclosure:
Configured the EDMS to produce reports that complied with several jurisdictions’ regulatory standards.
automated the reporting process to guarantee accuracy and save down on manual labour.
Education and Training:
Held training sessions for the personnel to make sure they knew how to use the new systems.
constituted a specialized group to oversee the emissions data and promote further development.
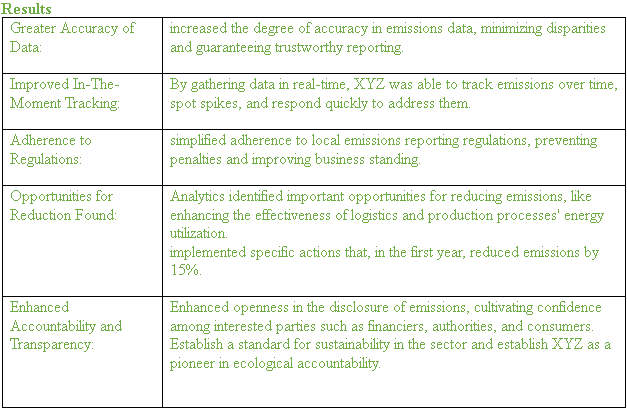
Conclusion
Achieving sustainability objectives requires precise, up-to-date data, as demonstrated by XYZ Manufacturing’s deployment of a successful emissions data management system. XYZ enhanced their emissions tracking and reporting and made major progress toward lowering their carbon footprint by overcoming early obstacles and utilizing cutting-edge technologies. Other firms looking to improve their emissions data management and support global sustainability initiatives can use this case study as a model.
Exercise 10: Determine the Features that are Important for your Emissions Data Management System

Course Manual 11: EV Chargers
Many facilities feel the need to implement EV charging stations for the tenants and customers. While EV’s are still a minority of the vehicles on the road, their numbers are increasing and facilities need to prepare for this type of service.
EV Charger Types
Depending on how quickly they can charge EV batteries, EV chargers can be divided into three basic categories: DC Fast Chargers, Level 1, and Level 2.
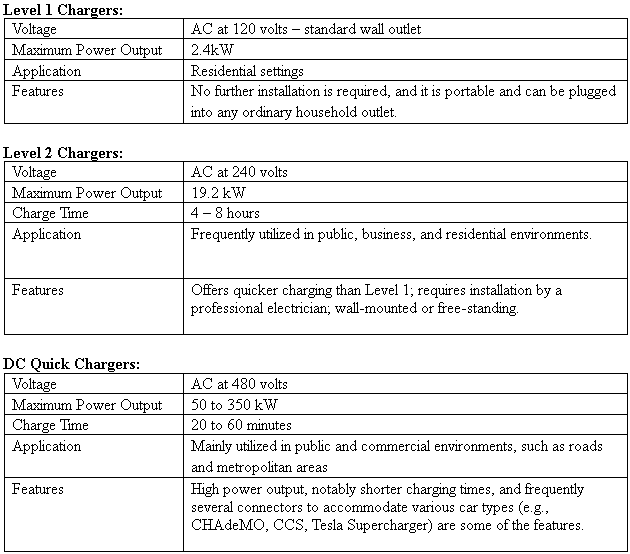
Smart Features
Several clever elements that improve user experience and operating efficiency are included with modern EV chargers:
• Wi-Fi, Ethernet, or cellular communication are examples of connectivity that allows for remote control and monitoring.
• Mobile Apps: Integration with mobile apps for scheduling, notifications, remote start/stop, and real-time status updates.
• Load management: To control power distribution across several chargers and avoid overloading the electrical system, use dynamic load balancing.
• Payment Systems: Credit card readers, RFID, and mobile payment alternatives are all included in the integrated payment systems for public chargers.
• Data gathering and analytics: Gathering usage data for reporting and analysis aids in optimizing charger upkeep and usage.
• User authentication improves security by guaranteeing that only authorized users can access the charging station.
• Integration of Renewable Energy: Greener charging alternatives are made possible by the integration of certain chargers with renewable energy sources, such as solar panels.
Safety Features
Since EV charging systems must be safe, contemporary chargers come with a number of safety features, including:
• Overcurrent Protection: Guards against overcurrent damage to the car and charger.
• Ground Fault Protection: To stop electric shocks, it looks for ground faults and cuts off electricity.
• Surge Protection: Prevents voltage spikes from damaging the charger.
• Temperature Monitoring: Keeps an eye on the battery’s and charger’s temperatures to avoid overheating.
• Auto Restart: Following a power interruption, the charging process is automatically restarted.
Driven by the fast acceptance of electric vehicles in all spheres, the worldwide need for electric vehicle (EV) chargers is witnessing exponential rise. The infrastructure for charging electric models has become increasingly important in facilitating this change as more customers and companies replace internal combustion engine vehicles with electric versions. Demand for EV chargers is especially rising in commercial real estate (CRE), high-density residential areas, and institutional buildings since these sectors realize they must meet the charging demands of an increasing number of owners of electric vehicles.
Demand Growth in Commercial Real Estate (CRE)
Office buildings and Corporate campuses
Particularly in office buildings and corporate campuses in commercial real estate, EV charging stations are starting to be a necessary feature. Sustainability is becoming more and more important to tenants and companies, hence EV chargers are a very obvious approach to show business ethics. EV chargers can enable CRE owners draw in and keep environmentally aware tenants.
For example, big companies like Google and Apple have already included electric vehicle chargers all around their campuses to encourage environmentalism and assist staff members in switching to electric cars. More than 1,000 electric vehicle charging stations on Google’s Mountain View campus in California serve an increasing portion of the company’s personnel who travel by electric cars.
This tendency spans more than just technology firms. To remain competitive, traditional corporate campuses including real estate companies, law firms, and banking companies are now installing electric vehicles chargers. Further increasing demand for workplace charging options are numerous organizations providing incentives for employees who drive electric cars.
Market Impact: One of the fastest-growing sectors for EV charger installations, commercial real estate is claimed by the International Energy Agency (IEA) to Up from just over 1 million in 2021, the research projects that by 2030 the worldwide demand for workplace EV chargers would reach 10 million units.
Shopping and Retail Centers
Installing EV chargers is becoming more and more important for retail centers and shopping malls trying to draw in and keep consumers. The availability of EV chargers can affect consumers’ decision of where to shop as many of them intend lengthier shopping trips and errands. Retail companies can boost foot traffic by including charging infrastructure, therefore matching with consumer tastes for sustainability.
For instance, retail centers like Westfield have teamed with charging network companies to install Level 2 and DC fast chargers all throughout their American, European, Australian properties. Numerous EV charging stations at Westfield Century City in Los Angeles let patrons charge their cars while shopping, dining, or watching a movie.
A study by BloombergNEF estimates that by 2025 retail sites will account for thirty percent of new EV charger installations in urban regions. The more time customers spend at these sites, the more profit stores have to present in providing EV charging as a value-added feature.
Demand Growth for High Density Residential
Multi-Family Living ( condos and Apartments)
Residents in high-density urban areas—especially those living in apartments and condominiums—are demanding access to EV charging infrastructure as electric vehicles get more popular. Unlike homeowners, these tenants lack the choice to set up a personal charging station in a driveway or garage, therefore the provision of shared charging stations in residential buildings becomes quite important.
Installers of EV chargers in shared areas and parking garages are property developers and managers responding. One of the biggest multi-family housing developers in the United States, AvalonBay Communities, has started including EV chargers into many of its sites around the nation, particularly in cities like New York City, Boston, and San Francisco, where occupants are more likely to own electric vehicles.
Multi-family homes provide special difficulties for EV charger installation despite the increasing demand: restricted space, the necessity for electrical improvements, and expense of installation management all play roles. New technology and policy incentives, however, are enabling removal of these obstacles. For instance, the California Electric Vehicle Infrastructure Project (CALeVIP) funds EV charger installations in multi-family buildings, therefore hastening adoption in regions with significant EV ownership.
A McKinsey & Company analysis projects that by 2030 demand for electric vehicle chargers in multi-family residential complexes will rise by 60% yearly. State and municipal legislation requiring EV-ready parking spots in new constructions as well as incentives to adapt older buildings are driving this explosion.
Homeowners’ Association
Homeowners’ associations are being requested more and more in condominium buildings and suburban areas with shared parking to consider installing electric vehicles chargers. While some HOAs are sluggish to embrace because of cost and logistical issues, others are proactively meeting the demands of EV owners by partnering with developers and charging network providers to establish shared chargers.
For instance, Tesla has a “Tesla Charging Partners” program whereby HOAs and property management businesses build charging infrastructure in shared parking and multi-family settings. Residential communities can more easily satisfy increasing demand with this kind of cooperative approach without bearing the whole expense of installation and upkeep.
Particularly in high-density residential areas, the increasing acceptance of electric vehicles (EVs) is changing the scene of real estate. Installing electric vehicle chargers in condominiums and apartment buildings has grown to be a crucial consideration affecting tenant demand, marketability, and property value. For many potential tenants as more people choose electric vehicles, the availability of charging infrastructure becomes not only a convenience but also a need.
Effect on Residential Market High Density Property Value
In multi-family homes and condominiums, EV chargers are considered as a value-adding tool. A growing population of environmentally concerned tenants and buyers that give sustainability top priority finds obvious attraction in the availability of EV charging infrastructure. Demand for easy home charging will keep growing as more people acquire electric cars, so making houses with EV chargers more appealing than those without them.
Properties with EV charging facilities are more likely to draw tenants who own or intend to acquire an electric vehicle, therefore broadening their market share. Multi-family homes with EV charging infrastructure typically have greater occupancy rates and tenant satisfaction, according a 2020 U.S. Department of Energy research.
Furthermore, because of their future-proof infrastructure and environmentally beneficial attractiveness, properties with EV chargers are progressively able to demand more rent or purchase price.
Apartment buildings including specialized EV charging stations have shown a notable rise in tenant demand in locations like Los Angeles and San Francisco, where EV usage exceeds the national average. units with EV charging witnessed rental rates of 2-5% compared to similar units without chargers, according a study done by the California Energy Commission. Over time, these little rental raises added over several units might result in significant profits for property owners.
Enhancing Long-Term Property Viability
Not only does installing EV chargers immediately value-add for present occupants, but it also makes an investment in the long-term survival of a building. Residential complexes without EV charging infrastructure may find it difficult to draw in renters going forward as government rules support electrification and the automotive sector phases out internal combustion engine vehicles. Properties without EV chargers could find their market value stagnate or even drop as the trend toward electric mobility picks speed.
For instance, the European Union has set high standards for carbon emissions, including ideas to forbid selling new diesel and gasoline vehicles by 2035. Apartment buildings and high-density housing developments without EV chargers may find themselves at a competitive disadvantage in nations like the UK and Germany, where the acceptance of EVs is fast rising.
Public demand for EV chargers in high density residential markets
The demand for quick and easily available charging infrastructure in high-density residential areas is growing as urban areas see a boom in electric vehicle acceptance. The International Energy Agency (IEA) estimates that metropolitan areas would be the main market for electric cars (EVs), which sold worldwide more than 10 million units in 2022. Public demand for electric vehicle chargers in apartment buildings has grown critical in high-density residential areas where access to personal garages or dedicated parking spots is restricted.
Over 80% of renters in high-density regions thought the availability of EV charging to be a major consideration while selecting an apartment, according to a 2021 poll by the National Multifamily Housing Council (NMHC). The poll also showed that renters would pay extra for homes with charging stations. Not only are present EV owners driving this demand but also potential consumers who intend to convert to electric cars in the next years.
Multi-Family Housing Challenges
Even with the increasing demand, placing EV chargers in high-density residential environments offers special difficulties. Many times lacking the infrastructure to enable major installations of electric vehicles, multi-family housing complexes can be costly to convert with EV charging stations. Property owners may find it difficult to install EV charging infrastructure due to issues including low electrical capacity, antiquated wiring, and the necessity of major parking area changes.
There are initiatives, though, to remove these obstacles. California’s Electric Vehicle Infrastructure Project (CALeVIP) and other incentive programs compensate property developers and owners to assist cover the expenses of installing electric vehicle chargers. Mandates requiring new homes to contain a specific percentage of EV-ready parking spaces are also being introduced by several states and municipalities all throughout the United States and Europe.
Example: Demand for EV chargers in multi-family buildings in Washington, D.C., has prompted legislative amendments. Particularly in high-density locations where many people live in apartments without personal parking spaces, the D.C. Department of Transportation has set targets for increasing the number of electric vehicle chargers in residential areas. To further generate public demand and satisfy the needs of EV owners in metropolitan environments, the district has provided tax incentives and subsidies to apartment building owners ready to install electric vehicles chargers.
Developer and Property Management Programs
Incorporating electric vehicle chargers into the designs of their buildings helps developers and property management businesses answer consumer demand. Many new high-rise apartment buildings in places such New York, Los Angeles, and Seattle now feature EV chargers as standard amenity package. Some developers are even going so far as to put EV-ready equipment in every parking spot, therefore facilitating simple scaling as more people move to electric cars.
For instance, The Halletts Point development, a sizable waterfront residential building in New York City, has included scores of EV charging stations in its parking garage to guarantee renters’ convenient access to charging outlets. A poll of potential residents drove this choice since it showed great demand for charging infrastructure, especially among younger tenants.
In keeping with the necessity to “future-proof” its developments for a rising community of EV owners, Chicago-based developer AMLI Residential has integrated EV chargers in several of its new multi-family buildings. Consequently, AMLI’s features have attracted more leasing activity since many tenants explicitly choose these buildings for their environmental qualities, including the availability of electric vehicles chargers.
Government Policies and Incentives Filling Demand
The demand for electric vehicle chargers in high-density residential areas is rising in great part in response to government policies. Many states and municipalities have passed laws mandating that newly constructed homes incorporate EV chargers or, at the absolute least, be “EV-ready,” pre-wiring parking spaces for future charger installations helps to ensure.
For instance, Title 24 of California’s Building Code requires that at least 10% of the parking spaces in new multi-family residential complexes include EV charging equipment. Vancouver has also established a target whereby all parking spaces in newly constructed homes have to be EV-ready. The growing number of electric vehicles on the road and the necessity to guarantee that infrastructure for charging them keeps pace with their acceptance drive these legislative actions.
Example: The EV-ready parking rules in Vancouver have greatly increased the availability of chargers in high-density residential complexes. Embracing the legislation, developers have realized that becoming EV-ready not only meets legal requirements but also increases the value and marketability of their buildings. Vancouver is thus among the top cities in North America for EV infrastructure in multi-family residences presently.
Conclusion
Rising numbers of electric vehicles on the road and changing tastes of tenants and homeowners are driving the fast expanding need for EV chargers in high-density residential markets.
Environmentally sensitive tenants find properties with EV charging facilities more appealing, and their occupancy rates and rental rates are probably going to be higher. Government incentives, legal requirements, and developers’ goal to future-proof their buildings are also driving public demand for EV chargers in apartments.
Particularly in highly crowded urban locations, the value and marketability of residential properties will depend much on the availability of charging infrastructure as ownership of electric vehicles grows more common.
Demand Growth in Institutions
Educational Campuses, Universities
As part of their larger sustainability projects, universities and colleges are progressively funding electric vehicle chargers. Large numbers of instructors, staff, and students daily travel to campus, hence educational institutions understand they must have charging infrastructure to satisfy increasing demand.
For instance, the University of California system has placed hundreds of electric vehicle chargers over its campuses and set high targets to lower greenhouse gas emissions. To encourage sustainable transportation among staff and students, UCLA, UC Davis, and UC Berkeley have extensively spent in EV charging infrastructure. To further EV adoption, some colleges have now included EV chargers into parking permits and other incentive schemes.
Market Impact: Infrastructure for EV charging is likely to flourish especially in the higher education sector. Navigant Research estimates that between 2023 and 2028, the 50% increase in EV chargers predicted at North American institutions will result from
Healthcare Facilities
Another important market for infrastructure supporting electric vehicles is hospitals and other healthcare facilities. Providing EV chargers is viewed as a significant first step in lowering their carbon footprint as healthcare companies give sustainability top priority in their operations.
Furthermore expected access to charging stations by healthcare professionals, patients, and guests running electric vehicles especially during longer hospital visits or work shifts.
For example, leading American healthcare company Kaiser Permanente has set up EV charging stations all over its medical facilities in Washington, Oregon, and California. The corporation has matched its ecological objectives with infrastructure supporting more general acceptance of electric vehicles.
According to a Frost & Sullivan analysis, demand for electric vehicle chargers in healthcare facilities is expected to rise by 40% yearly until 2020. Growing acceptance of electric cars among medical personnel as well as patient demand for more environmentally friendly hospital facilities are driving this expansion.
Government and Public Sector Buildings
EV charging stations are progressively being installed for public sector institutions like government buildings, courthouses, libraries, and transport hubs. Local, state, and federal governments are not only pushing the general acceptance of electric vehicles but also funding the required infrastructure to assist their own fleet vehicles and the public overall.
As part of its Green New Deal—which aims to have 100% zero-emission vehicles in the city by 2025—the City of Los Angeles, for instance, has set hundreds of EV chargers at public facilities and parking structures. To facilitate public use and their municipal fleets, government buildings in Washington, D.C., and New York City are also funding EV charging infrastructure.
Particularly as government fleets turn toward electrification, the public sector is a main driver of EV charger expansion. A study by the U.S. Department of Energy projects that, a notable rise from present levels, more than 10,000 government-operated EV chargers are likely to be installed throughout the United States by 2030.
Conclusion
Demand for electric vehicles (EV) chargers is rising quickly in commercial real estate, high- density residential regions, and institutional buildings among other spheres. While in residential properties they are indispensable for satisfying the needs of electric car owners, in commercial real estate EV chargers have become a main feature attracting renters and customers. EV chargers are part of more general sustainability initiatives and are progressively expected by staff, students, and guests in institutional environments including colleges, hospitals, and government facilities.
The demand for strong and easily available charging infrastructure will only become more noticeable as electric car usage rises, therefore presenting chances for developers, property managers, and legislators to fund the future of transportation.
Demand Growth for Hotels/Resorts
Growing acceptance of electric vehicles (EVs) has fundamentally changed customer preferences, including those related to lodging choices. Hotel EV chargers have grown to be a more and more valuable facility directly affecting visitor bookings and customer satisfaction. The availability of EV charging infrastructure might be quite important for EV drivers who search for sustainability and convenience in their decision-making process. Many hotels have started investing in electric vehicles (EV chargers) in response to this trend in order to draw environmentally concerned guests, improve client loyalty, and set themselves apart in a crowded industry.
Attracting in Environmental Conscious Travelers
More people switching to electric cars actively search for hotels with EV charging stations to guarantee handy charge during their stay. One very desired feature for EV owners is the option to charge their car overnight while lodging at a hotel. A study by Booking.com shows that 64% of worldwide visitors indicate they wish to stay at environmentally friendly hotels; EV chargers are thus usually regarded as part of that sustainable approach.
One of the biggest hotel chains worldwide, Marriott International has set up EV chargers all across several of its locations. Marriott not only attracts EV owners with this convenience but also portrays itself as a leader in sustainability. According to a corporate analysis, hotels with EV chargers have seen rising guest bookings from eco-aware guests. This has especially been true in places like California and Europe, where EV ownership is rather strong.
Increased Bookings from Road Trippers
Particularly for EV users who depend on consistent access to charging facilities, road vacations are growingly popular. Hotels with EV chargers can grab this expanding market of road trippers who value locations where they may charge both themselves and their cars. For longer road trips where stopping to charge is required, EV chargers can assist create a pleasing alternative that raises the possibility that guests will select hotels offering this convenience.
Multiple EV chargers were installed by the Hilton Garden Inn in Albany, New York, especially to serve road trippers heading between New York City and Montreal. Bookings for the hotel have grown, especially among long-distance visitors who need an overnight stay and a dependable charging station to keep on their path.
Enhancing Guest Experience and Loyalty
Offering EV chargers will help to improve passenger experience generally. The ease with which EV users may charge their cars overnight is much appreciated, hence the availability of chargers can result in good ratings and repeat business. Hotels that make investments in this infrastructure show a dedication to satisfy visitor needs, which could lead to better ratings of satisfaction.
Example: For all electric vehicles, the Four Seasons Hotel in Beverly Hills has fitted universal Level 2 chargers and Tesla Supercharges. Those that value the hotel’s capacity to charge their cars during their stay have given it great comments. Several internet reviews highlight the ease of the charging stations as a main factor influencing the property choice and return for further visits. This comments support guest loyalty development and adds to the hotel’s stellar service reputation.
EV chargers are being included into loyalty programs by hotels more and more, and they provide benefits to visitors who drive electric cars. Offering special packages or rewards for electric vehicle users would help hotels set themselves apart from rivals and generate a distinctive selling factor.
Renowned for its boutique hotels, the Kimpton Hotel company has developed environmentally friendly packages comprising free EV charging and other green conveniences. Arriving electric vehicle guests get priority parking close to the EV chargers, complimentary charging sessions, and points toward loyalty programs. This has helped the Kimpton brand draw a certain group of guests that give sustainability first priority and are more likely to choose hotels consistent with their environmental ideals.
Differentiation in a Competitive Market
Attracting customers in the cutthroat hotel sector depends mostly on difference. Many areas still view EV chargers as a luxury feature, hence hotels that provide them will be unique from others. Having EV charging stations would enable hotels to grab a niche market and enhance their brand image as progressive and environmentally friendly as more guests search for lodging that fit their beliefs and way of life.
Example: The Ion Adventure Hotel in Iceland bills itself as an eco-luxury establishment and has included electric vehicle charging facilities into their offers of sustainability. The hotel, which is close to Reykjavik, draws eco-aware visitors seeking out green lodging in Iceland’s countryside. Since eco-tourism is a big draw in the area, the availability of EV chargers has become a major selling factor helping the hotel stand out.
Targeting Corporate Clients and Events
Part of their sustainability initiatives, many companies are switching their corporate fleets to electric cars. Offering EV chargers can help hotels hosting business visitors, conferences, and corporate events appeal to these groups. This lets business customers charge their electric cars while staying at the hotel, therefore improving the attraction of the location for meetings and events.
Multiple EV charging stations have been set up by the Hyatt Regency in Chicago to serve business visitors and event participants. Particularly those in sectors with environmental aspirations, many business clients—especially those for conferences and travel—specifically ask for hotels with electric vehicle chargers. Hyatt Regency has positioned itself as a sustainable corporate location by offering this service and drawn bookings from environmentally conscious businesses.
Government Incentives and Regional Influence
In areas where EV ownership is high—like California, Norway, the Netherlands, and China— where demand for EV chargers at hotels is especially strong— In these places, hotels are meeting consumer demand by adding more EV charging stations for visitors. The availability of charging infrastructure in local hotels directly results from the increase in EV acceptance in some regions.
Many hotels in Norway, where EVs make up more than 80% of new vehicle sales in 2022, have set up EV charging stations to satisfy their patrons. Multiple EV chargers available at the Radisson Blu Hotel in Oslo have become a major determinant in drawing both domestic and foreign visitors running electric cars. The great acceptance of electric vehicles in the nation has made charging infrastructure a necessary tool in the hotel industry; hotels without this amenity run the danger of losing business to rivals.
Incentives for Hotels to Install EV Chargers
Apart from passenger demand, government incentives are motivating hotels to install electric vehicles chargers. To help the growth of EV charging infrastructure, several governments issue grants, tax credits, and subsidies to companies—including hotels—in order By helping to offset the initial installation cost, these incentives enable hotels to make more financial sense investing in electric vehicles.
The state government of California has several incentive programs to assist companies— including hotels—in California install EV chargers. Funded by the California Energy Commission, the CALeVIP program offers hotels installing public electric vehicles financial support. Using these rebates, hotels like the Ritz-Carlton in Marina del Rey have installed EV charging stations, which has drawn guests that give sustainability and convenience first priority.
Conclusion
The availability of electric vehicle chargers now becomes a major determinant of hotel visitor bookings. More people are looking for lodging that provides easy access to charge as acceptance of electric cars keeps increasing. Investing in EV chargers will help hotels draw environmentally concerned guests, improve visitor happiness, set themselves apart from rivals, and gain from government incentives. From regional players to major hotel chains and boutique hotels, examples show how EV chargers not only satisfy present demand but also future-proofing qualities in a market going more and more sustainable.
Challenges in Installing EV Chargers
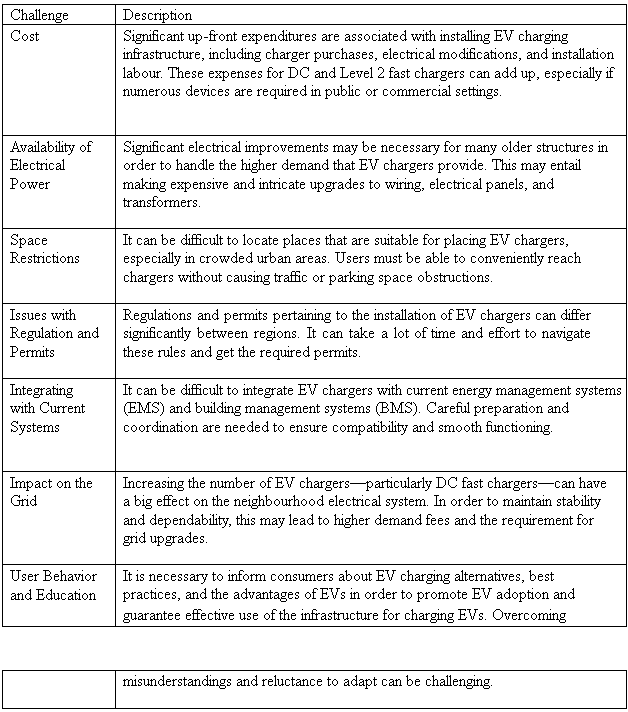
EV Charger Providers
The ChargePoint
One of the biggest and most well-known EV charging network providers in the world is ChargePoint. They provide a large selection of EV charging options for use in public, business, and domestic settings.
Features: ChargePoint chargers are renowned for their energy management system integration, dependable network connectivity, and user-friendly smartphone app. They provide cutting-edge features including comprehensive usage reporting, real-time monitoring, and dynamic load control.
Tesla
The Supercharger network, created especially for Tesla automobiles, is a well-known and vast network of DC rapid charges. But Tesla also has home charging options that work with other electric vehicles.
Features: Tesla owners can now travel vast distances thanks to the incredibly high charging speeds offered by Tesla Superchargers. Smart features like scheduling, energy usage tracking, and connectivity with mobile apps are available with Tesla’s home chargers.
EVBox
Leading worldwide supplier of EV charging solutions, EVBox offers a variety of equipment for public, business, and domestic charging.
Features: Scalability, intelligent charging, and sturdy construction are hallmarks of EVBox chargers. They provide functions including dynamic load balancing, RFID authentication, and integration with renewable energy sources.
Charging Blinks
For personal, business, and public use, Blink Charging offers networked EV charging services and equipment.
Features: Wi-Fi, Ethernet, and cellular connectivity are just a few of the connectivity choices that Blink chargers provide. Their networked chargers include user authentication, real-time data monitoring, and connectivity with many payment systems.
ABB
One of the world’s leading companies in power and automation technologies, ABB provides a wide range of EV charging options, such as AC and DC fast chargers.
Features: ABB chargers are renowned for their exceptional scalability, dependability, and efficiency. They include cutting edge features including smart grid integration, diagnostics, and remote monitoring. Additionally compatible with a range of EV models, ABB’s chargers offer versatility for a variety of usage situations.
Conclusion
EV chargers, with their array of features that improve user experience, operational efficiency, and sustainability, are vital parts of the expanding ecosystem surrounding electric vehicles. The implementation of EV chargers presents several obstacles, such as the need to manage peak power consumption, modernize infrastructure, comply with regulations, and incur significant initial expenses. These difficulties can be lessened with the help of efficient load control and integration with renewable energy sources.
EV chargers have a major impact on peak power demand, which raises demand prices and calls for load management and energy-saving measures. Notwithstanding these difficulties, EV chargers are still a wise investment because of their ability to draw in EV drivers, achieve sustainability objectives, and qualify for incentives.
Leading suppliers of EV chargers, including ChargePoint, Tesla, EVBox, Blink Charging, and ABB, provide a variety of cutting-edge features to cater to the various demands of home, business, and public charging. Facilities may help meet the increasing demand for EVs and contribute to a more sustainable future by utilizing these solutions.
Case Study: EV Chargers for High Density Residential with No Impact on the Grid
The collision of two major market transitions (shift to EV’s and shift to densification of housing) has created concern that the electricity grid will be able to provide the energy required. This study demonstrates that combining onsite generation and batteries with intelligent energy management has the ability to address this issue.
As the residential market in Canada is moving towards densification to satisfy the growing population in urban centres, there is growing interest in providing EV chargers for high density residential facilities. This is evidenced with the growth of Unico Power in this market with over 100 installations in Western Canada.
High density residential developers and condo owners recognize the growing demand for EV chargers at their facilities – and that there is strong motivation to maintain the value of their properties by providing an EV charging capability.
One of the biggest challenges for EV charging in high density residential buildings is the peak power demand. In a residential complex, the cars tend to plug-in to chargers when the electricity demand is at its highest – around 5-8pm. Without intelligent power management, a large number of EV chargers will dramatically increase the peak demand for the grid. This has a significant impact on the cost of electricity at the facility.
Intelligent Power Management
Cerebro™ from Unico Power provides intelligent power management for EV charging in high density residential buildings by watching the peak demand of the building and not allowing EV chargers to exceed this limit. The result is that the EV’s have no impact on the peak demand for
the grid. However, there is a limit to the number of EV’s that will be fully charged by the morning before the buildings peak demand will need to increase.
A study at a high density residential facility has shown that the EV’s return to the chargers with 80 to 90% of charge remaining and only require an average of 4kW for three hours to return to a full charge. The energy required for each EV was monitored over a one year period. This shows that the majority of charge sessions required less than 6kWh over 1.3 hours.
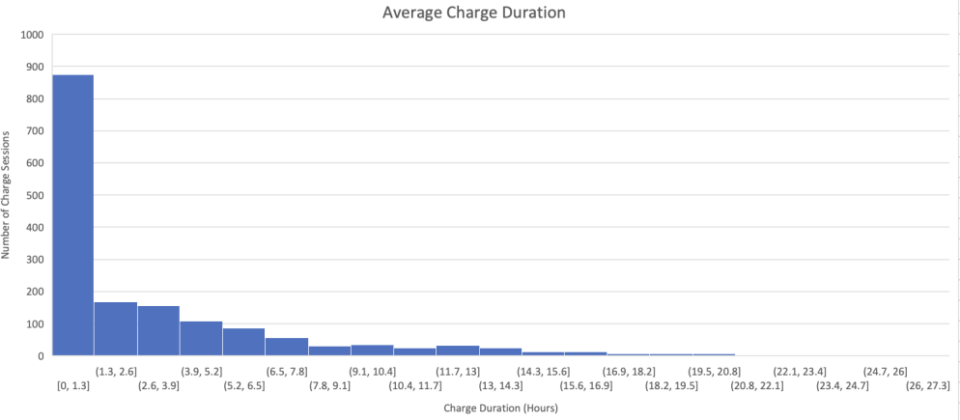
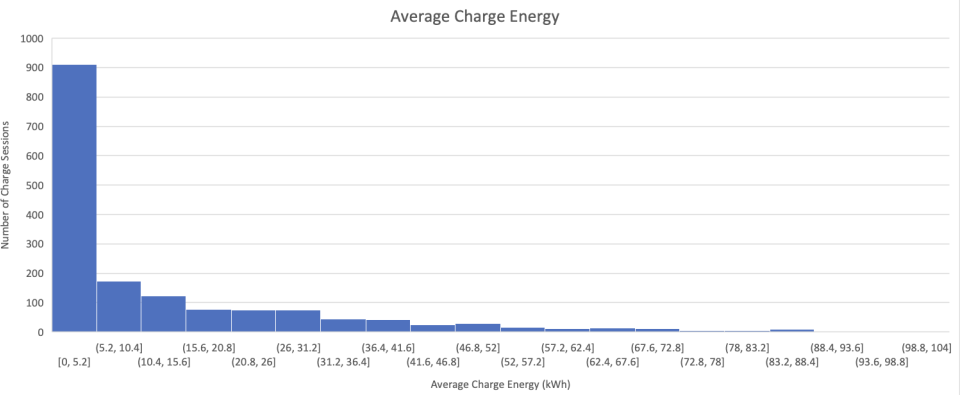
The electricity consumption for a pilot facility is shown below – and demonstrates a peak demand of 125kW. The facility has 121 suites and is located in Calgary Alberta.
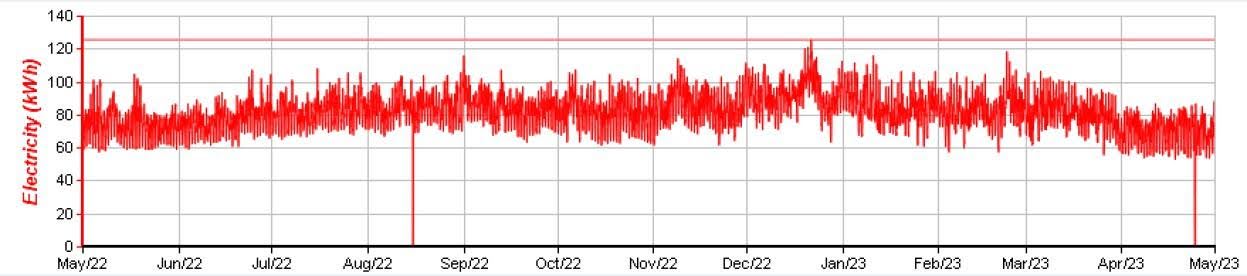
We then simulated the impact of EV chargers with the Intelligent Power Management system that limited power to 125kW. The simulation assumed:
EV’s arrived between 5pm and 9pm
EV’s left between 5am and 9am
EV’s required 4kW for 3 hours to receive a full charge
All EV’s must have a full charge by 5am
Without Intelligent Power Management and allowing the EV’s to consume as much power as they needed starting as they arrived, the peak demand for the facility would almost double and reach 235kW with 38 EV chargers. In the chart below, the grey line is the original facility power and the red line is the power required for both the building and the EV chargers.
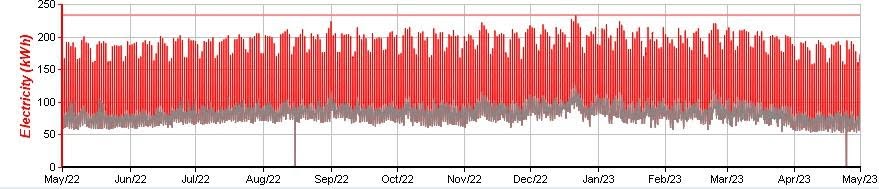
Zooming into one week, we see the power for the EV’s starting to increase at 5pm and reach its peak at 9 to 10pm before reaching full charge for the EV’s at about midnight.
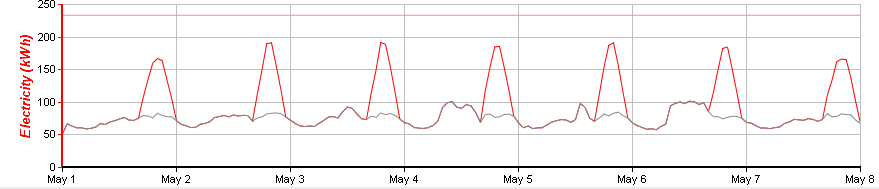
With Intelligent Power Management, the grey line shows the original building power and the red line shows the energy required from the grid as a result of adding 38 level 2 chargers – demonstrating that this building can support 38 EV’s without any power demand increase from the grid.
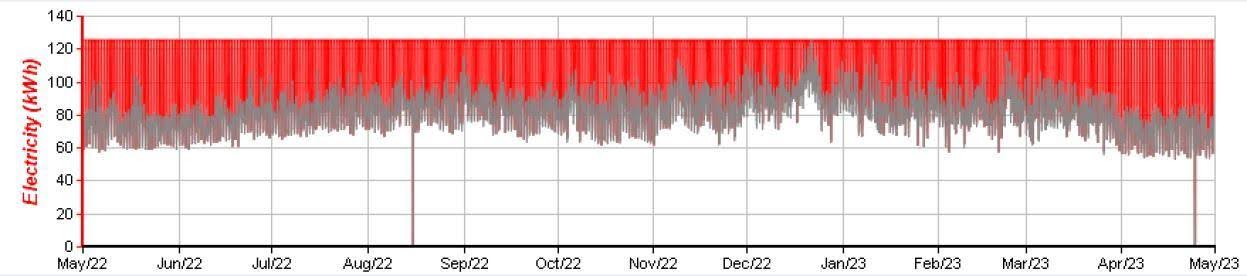
Zooming into one week, we can see the increase in power (red line) to support the EV chargers over the night hours. Each EV is fully charged by 5am.
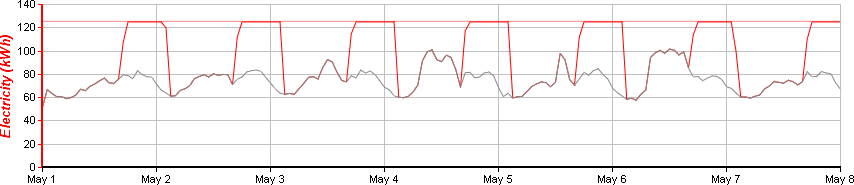
Onsite Generation
The next challenge is to determine how much additional power would be required in order to support 100 chargers. Even with intelligent power management, the building would need to increase its peak demand to 175kW, which would increase electricity costs by 53%.
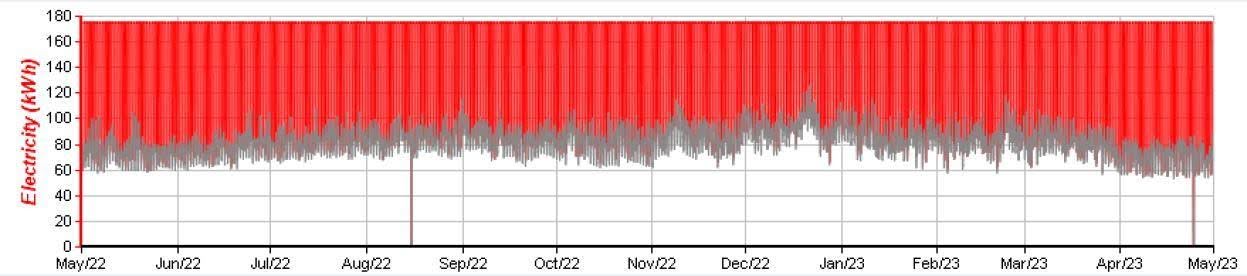
Zooming into one week, we see the peak demand increase to 175kW.
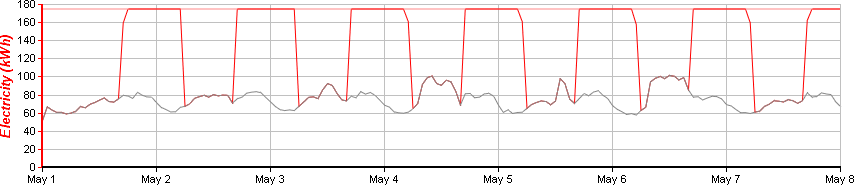
Introducing onsite generation will increase the number of EV chargers that can be supported while maintaining the existing peak demand for the facility.
With the introduction of a 50kW onsite generator, the facility is able to support 100 EV chargers and still maintain the original 125kW peak demand for the facility. The grey line shows the original building power, the blue line shows the onsite generation and the red line shows the grid power demand.
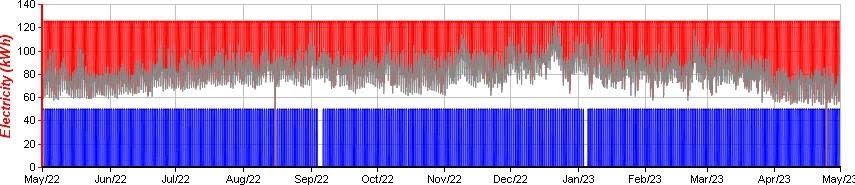
Before introducing onsite generation, the peak demand increased to 175kW with Intelligent Power Management.
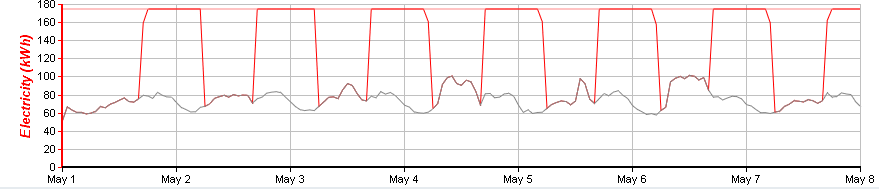
After introducing a 50kW onsite generator (blue line), we can see that the peak demand from the grid (red line) is now limited to 125kW.
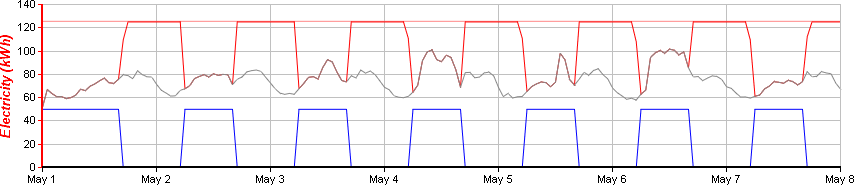
Exercise 11: Outline Your EV Charging Strategy
For your customers
For your tenants
For your operations
Level 2 are ideal for charging less than one hour
Level 3 are required for fast charging on long road trips but may not be needed if the users can leave the car charging for an hour
Can you isolate the car chargers from the facility demand?
If not, how many chargers can you support before increasing your peak demand?
Is onsite generation / storage required?

Course Manual 12: Regional Energy Advantages
Every region has their own unique energy advantages. Identifying the advantages in your area can lead to the types of energy systems that work best.
Modern life depends on energy; it drives homes, businesses, and transportation as well as industry. There are several sources of energy used worldwide; these can be classified as either renewable or non-renewable resources. Dealing with climate change and promoting sustainable development depend on an awareness of various energy sources and their application. This section investigates several energy sources: solar and wind, geothermal, gravity, hydropower and waves, chemical energy (oil, gas, and nuclear), and earth energy.
Solar Energy
Among the most plentiful and sustainable sources of energy on Earth are those derived from the Sun. It can be utilized among several technologies, including wind turbines and solar photovoltaic (PV) cells.
Solar PV Energy
Using semiconductor materials—typically silicon—Solar PV systems directly convert sunlight into electricity, producing an electric current when subjected to sunlight. Most often used applications of this technology are solar panels, which are progressively being installed at utility, business, and residential levels.
Advantages
• Given the sun will continue to emit energy for billions of years, solar energy is essentially infinite.
• Solar PV creates electricity without releasing greenhouse gasses or other pollutants, therefore benefiting the environment.
• Solar systems might be tiny enough to run one house or big enough to run whole towns or cities.
Challenges
• Solar power generation is weather-dependent and stops at night, hence storage options or backup power sources are needed.
• Big solar farms need a lot of space, hence their impact on land use in some areas could be notable.
Among the biggest solar farms in the world, the Noor Solar Complex in Morocco supplies renewable energy to about a million people. It yearly helps to lower carbon emissions by 760,000 tons.
Wind Energy
Another type of solar energy is wind energy since the sun’s unequal heating of the Earth’s surface generates wind. Turning the kinetic energy of flowing air into mechanical power, wind turbines subsequently transform that mechanical power into electricity.
Advantages
• One advantage of wind energy is its naturally occurring, limitless availability.
• Once erected, wind turbines have modest running and maintenance costs.
• With both small turbines for local usage and huge wind farms for utility-scale power generation, wind energy is scalable.
Challenges
• Like solar energy, wind energy has intermittency depending on the state of the climate.
• Wind turbines are occasionally attacked for their visual effect on landscapes and can produce noise.
• Efforts to minimize the effects of wind turbines on birds and bats can result from their possible hazards.
Comprising a capacity of over 7,000 megawatts (MW), the Gansu Wind Farm in China is among the biggest wind farms in the world. It greatly helps China achieve her targets for renewable energy.
Energy from the Earth
Derived from the internal heat of the Earth, geothermal energy finds use in direct heating systems as well as in the generation of electricity.
Geothermal Source
Tapping on the heat created by radioactive decay in the Earth’s core produces geothermal energy. Wells drilled into geothermal reservoirs and steam or hot water brought to the surface to run turbines and create power help to harness it.
Advantages
• Unlike solar or wind, which are intermittent, geothermal energy offers a consistent and constant power supply.
• Compared to plants derived from fossil fuels, geothermal plants release rather minimal amounts of greenhouse gasses.
• Geothermal power facilities use rather less area than solar or wind farms.
Challenges
• Geothermal resources are spatially limited to places close to tectonic plate borders or volcanic sites
• The drilling and exploration necessary to reach geothermal sources can be costly initially.
• Geothermal energy generation runs the danger of contaminating the water supply and spewing sulfur dioxide and other pollutants.
Iceland leads the usage of this renewable energy since around 25% of its electricity comes from geothermal sources. Among the biggest geothermal plants in the world is the Hellisheiði Power Station of that nation.
Gravity Energy
Another strong natural force one can use to create electricity is gravity. This group comprises wave energy and hydropower, both of which make use of the gravitational forces acting upon the Earth and its natural processes.
Hydropower
Among the earliest and most often used renewable energy sources is hydropower. It runs a turbine linked to a generator utilizing the force of falling or flowing water to create power.
Advantages
• Particularly in places with continuous water flow, hydropower facilities can offer a consistent source of electricity.
• Large hydropower plants can produce enormous volumes of electricity to satisfy home and business demand.
• Hydropower stays a renewable source as long as rivers flow.
Challenges
• The building of dams might disturb local ecosystems, fish migration, and water quality, thereby posing challenges for hydropower.
• Large hydropower projects have the ability to destroy habitats for wildlife and communities.
• Drought Vulnerability: Production of hydropower may suffer in areas going through droughts or less rainfall.
With a capacity of 22,500 MW, China’s Three Gorges Dam boasts the biggest hydropower project in the world. The project has been contentious because of its environmental and social effects even if it generates enormous volumes of electricity.
Wave Energy
Driven by wind and impacted by the gravitational pull of the moon, wave energy is collected from the motion of ocean waves. Devices designed to capture this kinetic energy and translate it into power include wave energy converters or oscillating water columns.
Advantages
• Ocean waves transport great energy, hence wave power could be more efficient than solar or wind energy.
• One continuous and renewable energy source are waves.
• Wave energy systems put offshore help to minimize effects on land use by lowering the demand.
Challenges
• Wave energy technology is still in its developing phases and is not extensively used, so it suffers technological immaturity.
• Environmental Issues: One worries about possible effects on shipping paths and maritime environments.
• Wave energy system installation and maintenance are now costly.
Among the first commercial wave energy projects installed off the coast of Scotland is the Pelamis Wave Energy Converter. It emphasizes the possibilities of wave energy to support the creation of renewable energy even if it is still in experimental stage.
Chemical Energy
Stored in atom and molecule bonds, chemical energy is released during chemical processes. Nuclear reactors and fossil fuels provide means of harnessing this energy.
Hydrocarbon Energy
Fossil fuels derived from the remains of extinct plants and animals subjected to heat and pressure over millions of years are oil and natural gas. These fuels release energy utilized for heating, transportation, and generation of power when burned.
Advantages
• Because fossil fuels offer a concentrated source of energy, they are quite efficient for running industrial operations and vehicles.
• Extended worldwide infrastructure including pipelines, refineries, and transportation systems supports oil and gas.
Challenges
• One of the non-renewable resources that will finally run out is fossil fuels in oil and gas.
• Environmental Impact: Large amounts of greenhouse gases produced by burning oil and gas fuel climate change and air pollution.
• Many of oil and gas reserves are found in politically unstable areas, which causes supply interruptions and price volatility.
For example, the United States still ranks among the top natural gas and oil consumers as well as producer. Though the nation is moving toward renewable energy, fossil fuels still make up a sizable share of the energy mix.
Nuclear Power
Nuclear fission is the process by which atom nuclei—usually those of uranium—are split to produce nuclear energy. This reaction’s released energy heats water to create steam, which drives turbines to generate electricity.
Advantages
• From a small amount of fuel, nuclear power plants provide a great volume of energy,
• Once a plant is running, nuclear energy is almost entirely carbon-free.
• Nuclear power plants offer a consistent supply of electricity since they can run continuously for extended lengths of time without interruption.
Challenges
• With long-term storage options required, challenges of nuclear energy remain mostly related to the disposal of radioactive nuclear waste.
• Safety issues with nuclear power have been raised by events including those at Chernobyl and Fukushima.
• High Initial Costs: Constructing nuclear power plants calls both large capital outlay and extensive building times.
France mostly depends on nuclear energy; roughly seventy percent of its power comes from nuclear plants. The nation’s dedication to nuclear energy has helped it to keep low carbon emissions relative to other developed countries.

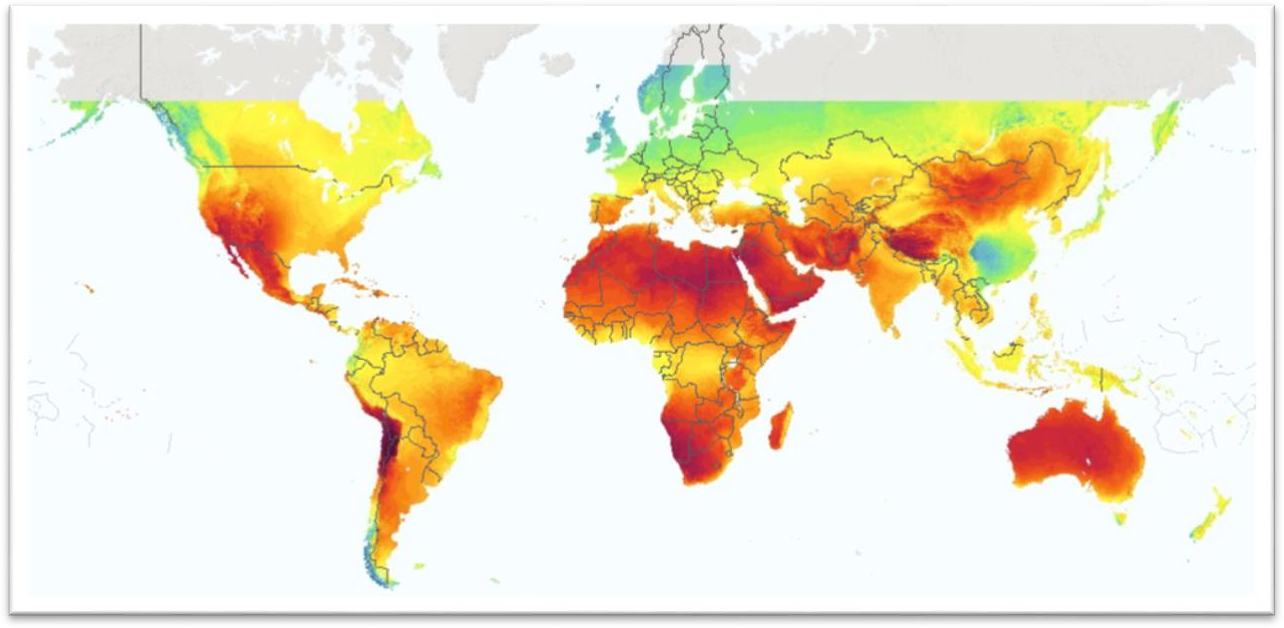


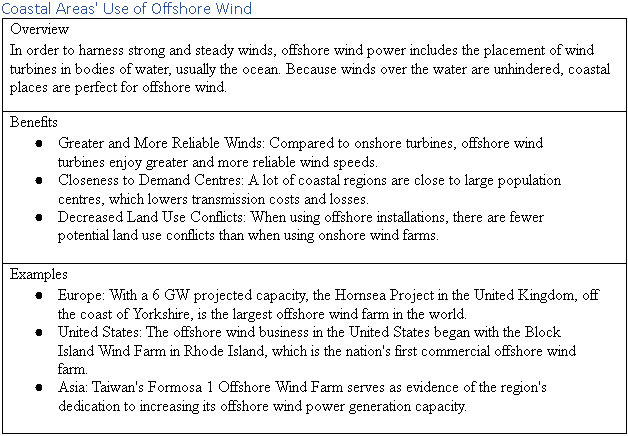
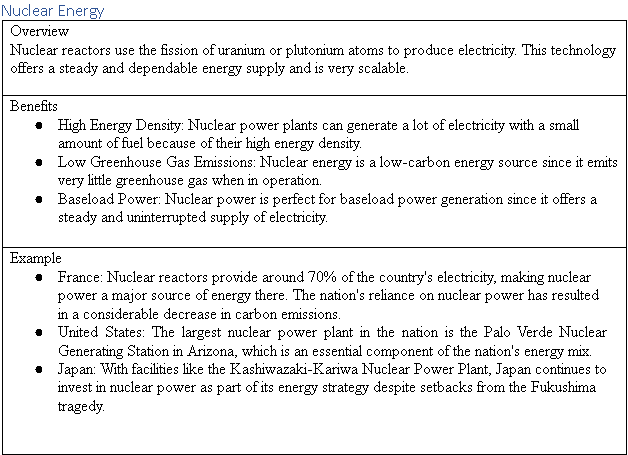


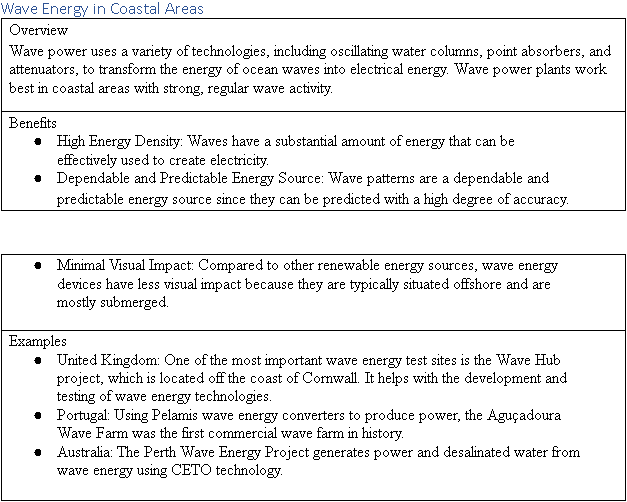
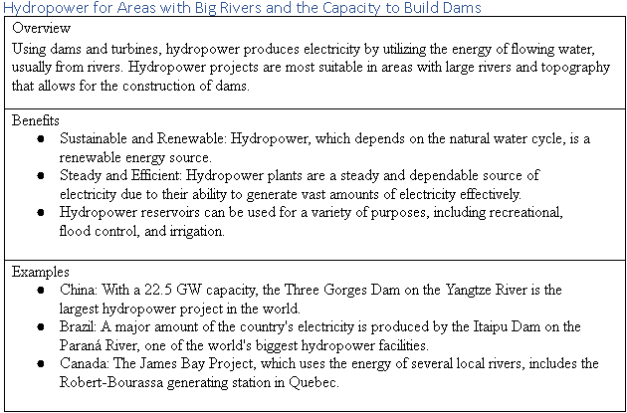

Conclusion
Due to their distinct geographical and climatic features, many parts of the world are suited for different kinds of energy production. While onshore wind power flourishes in hilly places with strong wind speeds, solar PV is best suited for desert and plains areas with high solar irradiation. Because of the strong and steady wind and wave activity offshore, coastal areas benefit from wind and wave power. In areas like Iceland that have abundant geothermal resources, geothermal power is especially efficient. In many regions of the world, hydropower—which depends on big rivers and the capacity to build dams—is a dependable and effective energy source. Last but not least, nuclear power offers a steady and dependable power supply that is necessary to fulfill the rising global energy demand due to its high energy density and low greenhouse gas emissions. A diversified and sustainable global energy portfolio is facilitated by the distinct benefits and opportunities that each of these energy sources offers.
Case Study: Solar and Wind in Alberta Canada
Alberta Canada fully transitioned from coal to primarily natural gas for electricity generation in 2024. As most of Alberta has a prairie landscape, solar PV is popular due to the significant solar resource. In addition, the proximity to the Rocky Mountains provides for a significant wind resource in the southern part of the province.
The dynamics and sources of electricity for Alberta is provided in the dashboard at “https://enermetrics.info/energydashboard/”>https://enermetrics.info/energydashboard/. This shows the energy sources for the generation of electricity each hour.
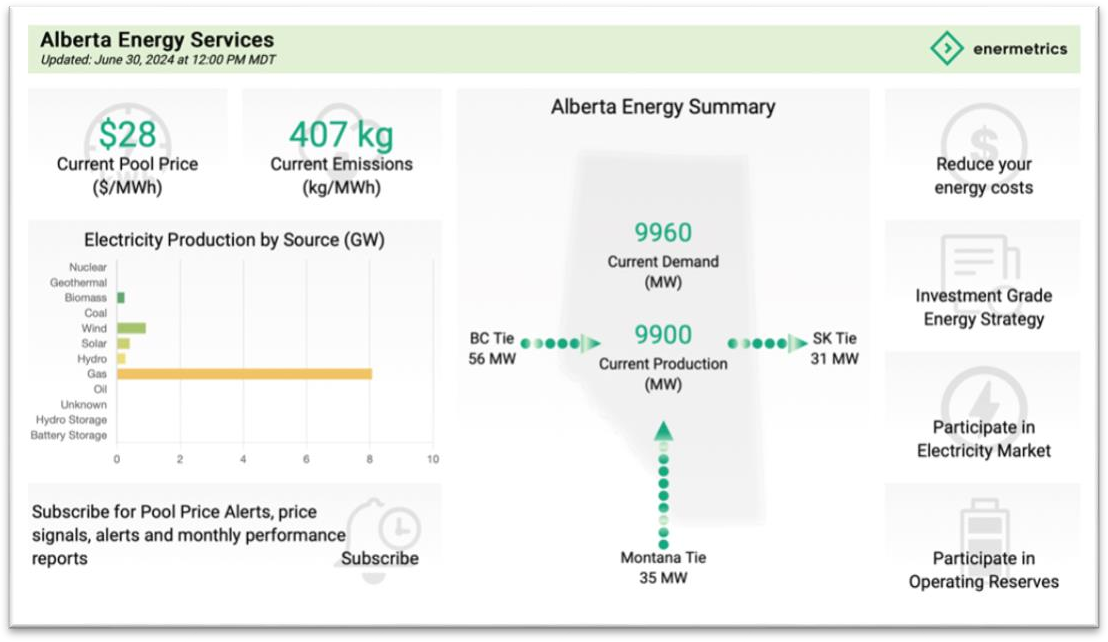
The historical energy sources for the generation of electricity shows that the primary energy source is natural gas (one of Alberta’s main resources) along with wind.
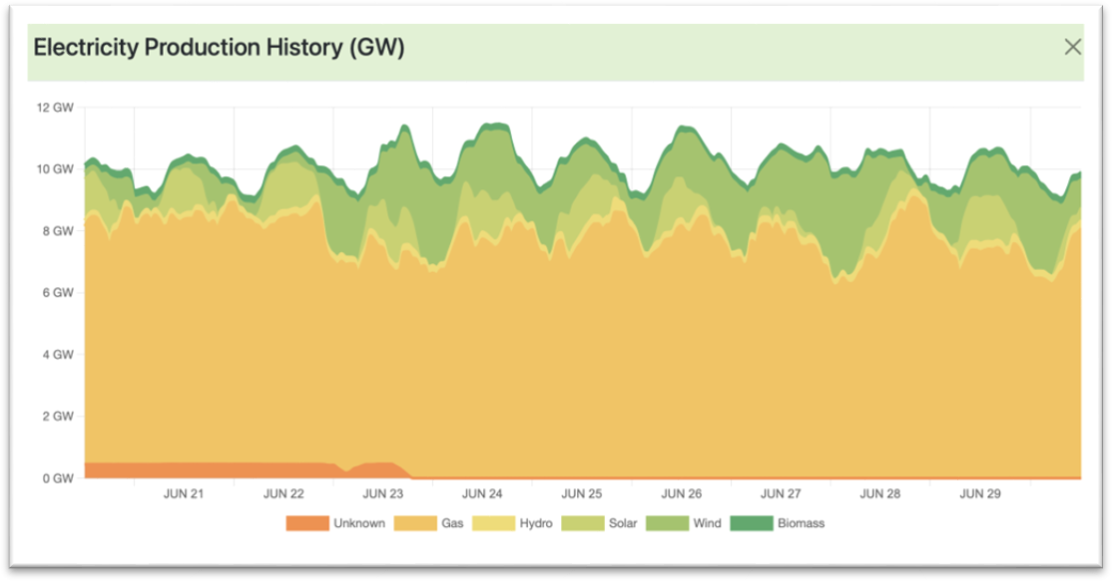
The result for Albertan’s is that the cost of electricity is very low when there is cheap wind and solar energy available as show below. As Alberta is a deregulated market, the price of electricity varies hour by hour between $0/MWh and $1000/MWh.
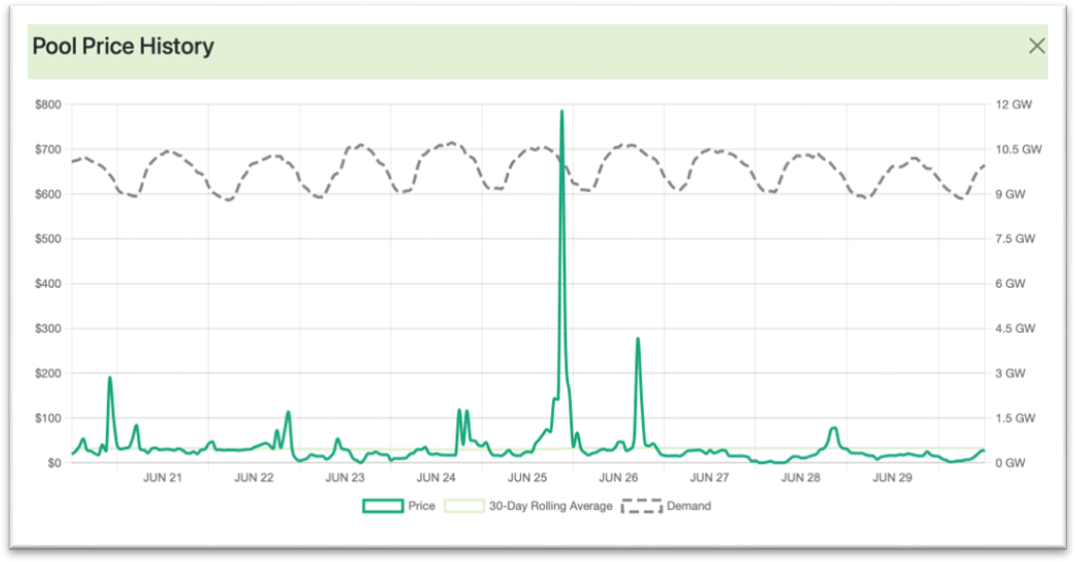
The energy sources for your region can be seen at “https://app.electricitymaps.com/map”>https://app.electricitymaps.com/map
Exercise 12: Energy Advantages for your Region
E.g. space for solar PV
E.g. esthetic restrictions
E.g. regulatory restrictions
E.g. financial restrictions
Project Studies

Project Study (Part 1) – Customer Service
The Head of this Department is to provide a detailed report relating to the Energy Costs process that has been implemented within their department, together with all key stakeholders, as a result of conducting this workshop, incorporating process: planning; development; implementation; management; and review. Your process should feature the following 12 parts:
01. Units of Measure
02. Value of Interval Data
03. Understanding Electricity Costs
04. Electricity Rates and Tariffs
05. Energy Use Intensity
06. Energy Scores
07. Energy Consumers
08. Sub-Meter Design
09. Energy Data Management
10. Emissions Data
11. EV Chargers
12. Regional Energy Advantages
Please include the results of the initial evaluation and assessment.

Project Study (Part 2) – E-Business
The Head of this Department is to provide a detailed report relating to the Energy Costs process that has been implemented within their department, together with all key stakeholders, as a result of conducting this workshop, incorporating process: planning; development; implementation; management; and review. Your process should feature the following 12 parts:
01. Units of Measure
02. Value of Interval Data
03. Understanding Electricity Costs
04. Electricity Rates and Tariffs
05. Energy Use Intensity
06. Energy Scores
07. Energy Consumers
08. Sub-Meter Design
09. Energy Data Management
10. Emissions Data
11. EV Chargers
12. Regional Energy Advantages
Please include the results of the initial evaluation and assessment.

Project Study (Part 3) – Finance
The Head of this Department is to provide a detailed report relating to the Energy Costs process that has been implemented within their department, together with all key stakeholders, as a result of conducting this workshop, incorporating process: planning; development; implementation; management; and review. Your process should feature the following 12 parts:
01. Units of Measure
02. Value of Interval Data
03. Understanding Electricity Costs
04. Electricity Rates and Tariffs
05. Energy Use Intensity
06. Energy Scores
07. Energy Consumers
08. Sub-Meter Design
09. Energy Data Management
10. Emissions Data
11. EV Chargers
12. Regional Energy Advantages
Please include the results of the initial evaluation and assessment.

Project Study (Part 4) – Globalization
The Head of this Department is to provide a detailed report relating to the Energy Costs process that has been implemented within their department, together with all key stakeholders, as a result of conducting this workshop, incorporating process: planning; development; implementation; management; and review. Your process should feature the following 12 parts:
01. Units of Measure
02. Value of Interval Data
03. Understanding Electricity Costs
04. Electricity Rates and Tariffs
05. Energy Use Intensity
06. Energy Scores
07. Energy Consumers
08. Sub-Meter Design
09. Energy Data Management
10. Emissions Data
11. EV Chargers
12. Regional Energy Advantages
Please include the results of the initial evaluation and assessment.

Project Study (Part 5) – Human Resources
The Head of this Department is to provide a detailed report relating to the Energy Costs process that has been implemented within their department, together with all key stakeholders, as a result of conducting this workshop, incorporating process: planning; development; implementation; management; and review. Your process should feature the following 12 parts:
01. Units of Measure
02. Value of Interval Data
03. Understanding Electricity Costs
04. Electricity Rates and Tariffs
05. Energy Use Intensity
06. Energy Scores
07. Energy Consumers
08. Sub-Meter Design
09. Energy Data Management
10. Emissions Data
11. EV Chargers
12. Regional Energy Advantages
Please include the results of the initial evaluation and assessment.

Project Study (Part 6) – Information Technology
The Head of this Department is to provide a detailed report relating to the Energy Costs process that has been implemented within their department, together with all key stakeholders, as a result of conducting this workshop, incorporating process: planning; development; implementation; management; and review. Your process should feature the following 12 parts:
01. Units of Measure
02. Value of Interval Data
03. Understanding Electricity Costs
04. Electricity Rates and Tariffs
05. Energy Use Intensity
06. Energy Scores
07. Energy Consumers
08. Sub-Meter Design
09. Energy Data Management
10. Emissions Data
11. EV Chargers
12. Regional Energy Advantages
Please include the results of the initial evaluation and assessment.

Project Study (Part 7) – Legal
The Head of this Department is to provide a detailed report relating to the Energy Costs process that has been implemented within their department, together with all key stakeholders, as a result of conducting this workshop, incorporating process: planning; development; implementation; management; and review. Your process should feature the following 12 parts:
01. Units of Measure
02. Value of Interval Data
03. Understanding Electricity Costs
04. Electricity Rates and Tariffs
05. Energy Use Intensity
06. Energy Scores
07. Energy Consumers
08. Sub-Meter Design
09. Energy Data Management
10. Emissions Data
11. EV Chargers
12. Regional Energy Advantages
Please include the results of the initial evaluation and assessment.
Project Study (Part 8) – Management
The Head of this Department is to provide a detailed report relating to the Energy Costs process that has been implemented within their department, together with all key stakeholders, as a result of conducting this workshop, incorporating process: planning; development; implementation; management; and review. Your process should feature the following 12 parts:
01. Units of Measure
02. Value of Interval Data
03. Understanding Electricity Costs
04. Electricity Rates and Tariffs
05. Energy Use Intensity
06. Energy Scores
07. Energy Consumers
08. Sub-Meter Design
09. Energy Data Management
10. Emissions Data
11. EV Chargers
12. Regional Energy Advantages
Please include the results of the initial evaluation and assessment.

Project Study (Part 9) – Marketing
The Head of this Department is to provide a detailed report relating to the Energy Costs process that has been implemented within their department, together with all key stakeholders, as a result of conducting this workshop, incorporating process: planning; development; implementation; management; and review. Your process should feature the following 12 parts:
01. Units of Measure
02. Value of Interval Data
03. Understanding Electricity Costs
04. Electricity Rates and Tariffs
05. Energy Use Intensity
06. Energy Scores
07. Energy Consumers
08. Sub-Meter Design
09. Energy Data Management
10. Emissions Data
11. EV Chargers
12. Regional Energy Advantages
Please include the results of the initial evaluation and assessment.

Project Study (Units of Measure0) – Production
The Head of this Department is to provide a detailed report relating to the Energy Costs process that has been implemented within their department, together with all key stakeholders, as a result of conducting this workshop, incorporating process: planning; development; implementation; management; and review. Your process should feature the following 12 parts:
01. Units of Measure
02. Value of Interval Data
03. Understanding Electricity Costs
04. Electricity Rates and Tariffs
05. Energy Use Intensity
06. Energy Scores
07. Energy Consumers
08. Sub-Meter Design
09. Energy Data Management
10. Emissions Data
11. EV Chargers
12. Regional Energy Advantages
Please include the results of the initial evaluation and assessment.

Project Study (Units of Measure1) – Logistics
The Head of this Department is to provide a detailed report relating to the Energy Costs process that has been implemented within their department, together with all key stakeholders, as a result of conducting this workshop, incorporating process: planning; development; implementation; management; and review. Your process should feature the following 12 parts:
01. Units of Measure
02. Value of Interval Data
03. Understanding Electricity Costs
04. Electricity Rates and Tariffs
05. Energy Use Intensity
06. Energy Scores
07. Energy Consumers
08. Sub-Meter Design
09. Energy Data Management
10. Emissions Data
11. EV Chargers
12. Regional Energy Advantages
Please include the results of the initial evaluation and assessment.

Project Study (Units of Measure2) – Education
The Head of this Department is to provide a detailed report relating to the Energy Costs process that has been implemented within their department, together with all key stakeholders, as a result of conducting this workshop, incorporating process: planning; development; implementation; management; and review. Your process should feature the following 12 parts:
01. Units of Measure
02. Value of Interval Data
03. Understanding Electricity Costs
04. Electricity Rates and Tariffs
05. Energy Use Intensity
06. Energy Scores
07. Energy Consumers
08. Sub-Meter Design
09. Energy Data Management
10. Emissions Data
11. EV Chargers
12. Regional Energy Advantages
Please include the results of the initial evaluation and assessment.
Program Benefits
Management
- Energy efficiency
- Reduce waste
- Reduce consumption
- Reduce demand
- Onsite generation
- Optimize contracts
- Operations efficiency
- Fuel switching
- Deferred maintenance
- Modernize systems
Marketing
- NetZero Goals
- Energy reduction
- Low-carbon fuels
- Renewable energy
- Micro-grids
- Social responsibility
- Improved reputation
- Market demand
- Shareholder expectations
- Competitor analysis
Production
- Climate adaptation
- Operations continuity
- Loss prevention
- Guest expectations
- Life Safety
- Emergency shelters
- Energy cost reduction
- Emissions reduction
- Energy security
- Brand reputation
Client Telephone Conference (CTC)
If you have any questions or if you would like to arrange a Client Telephone Conference (CTC) to discuss this particular Unique Consulting Service Proposition (UCSP) in more detail, please CLICK HERE.