


Process Optimization – WDP1 (Competitive Advantage)

The Appleton Greene Corporate Training Program (CTP) for Process Optimization is provided by Dr. Ogunbiyi Certified Learning Provider (CLP). Program Specifications: Monthly cost USD$2,500.00; Monthly Workshops 6 hours; Monthly Support 4 hours; Program Duration 12 months; Program orders subject to ongoing availability.
If you would like to view the Client Information Hub (CIH) for this program, please Click Here
Learning Provider Profile

Dr. Ogunbiyi is a Certified Six Sigma Master Black Belt and entrepreneur with extensive experience in harnessing the interplay between technology and processing to improve operational outcomes across two decades in the financial and public service sectors. He is the founder of a boutique consultancy specialising in business process management and co-founder of a Software-as-a-Service (SaaS) company that enables public service providers to improve interaction continuously and measurably with the public.
He has a proven track record of delivering a variety of successful strategic, global, cross-functional programmes and to date, he has led process optimization initiatives that have yielded tens of millions of Euros in savings.
In addition, Dr. Ogunbiyi is an academic researcher who has made original contributions to the field of process mining and monitoring. His research interests include exploring how contextual (i.e., case, process, social and external) factors contribute to the predictive power of process mining models, causal process mining and object-centric process mining among others.
He obtained a BSc in Computing Science from the University of Greenwich, an MBA from Imperial College Business School and his PhD in Computing Science from the University of Westminster, where he currently serves as a part-time visiting lecturer.

MOST Analysis

Mission Statement
To set a solid foundation for equipping participants with the skills and knowledge to begin utilizing data-driven process excellence as a competitive lever, enabling their organizations to differentiate themselves from their competitors by delivering better quality products and services at lower costs.
To enable participants effectively enthuse and motivate employees to drive and own change that will be deployed through the organization as a result of the program”.

Objectives
01. Understand the concept of processes including its components and lifecycle. Also gain the ability to succinctly and accurately name processes and determine what is not a process. Time Allocated: 1 Month
02. Acquire the skills to produce and interpret process models using BPMN as well as define process performance metrics.Time Allocated: 1 Month
03. Comprehend how process outcomes differ from outputs and differentiate between positive and negative outcomes. Develop the ability to quantify the impact of negative outcomes on diverse groups. Time Allocated: 1 Month
04. Develop the competence to analyze the organization’s competence and compare it with internal and external environment to identify opportunities. Also understand how process excellence enables the organization to seize these opportunities. Time Allocated: 1 Month
05. Recognize the pivotal role customer experience (CX) plays in organization success. Establish the relationship between process excellence and customer experience. Time Allocated: 1 Month
06. Grasp how employee engagement is linked to achievement of organizational objectives. Analyse the current state of the metrics and identify the root cause (if possible).Time Allocated: 1 Month
07. Gain in-depth understanding of the importance of regulatory compliance and the expertise to connect regulatory compliance performance with process excellence. 1 Month
08. Acquire an appreciation of the criticality of growing shareholder value and the capability to map shareholder value metrics with process excellence drivers.Time Allocated: 1 Month
09. Obtain an understanding of how Corporate Social Responsibility (CSR) is linked with the achievement of organizational objectives and identify the processes which move these metrics.Time Allocated: 1 Month
10. Understand the importance of the people element in the process excellence journey and how to activate the seeking system to obtain leadership and employee buy-in. Time Allocated: 1 Month
11. Develop the ability to survey the organization’s culture to determine how well it supports change. Also understand how to move the organization towards a culture-enabling culture.Time Allocated: 1 Month
12. Recognize the various components of process excellence momentum, assess the current state of the organization change momentum and implement recommendations to sustain change momentum.Time Allocated: 1 Month

Strategies
01. Undertaking reflection on learning and applying it to identify key organization processes including their components and lifecycle.: Each individual department head to undertake departmental SWOT analysis; strategy research & development.
02. Analyse the performance of key organizational processes.: Each individual department head to undertake departmental SWOT analysis; strategy research & development.
03. Develop an awareness of the consequences of business process failure by analysing the measurable impact of negative process outcomes on various stakeholder groups.: Each individual department head to undertake departmental SWOT analysis; strategy research & development.
04. Generate a pipeline of potential opportunities that align with organizational competences by identifying how processes can enable these opportunities to be capitalized on.: Each individual department head to undertake departmental SWOT analysis; strategy research & development.
05. Establish the relationship between CX metrics, customer requirements and the processes that produce or support these requirements.: Each individual department head to undertake departmental SWOT analysis; strategy research & development.
06. Demonstrate the link between employee engagement and process excellence. : Each individual department head to undertake departmental SWOT analysis; strategy research & development.
07. Review regulatory conformance performance and the connected processes. : Each individual department head to undertake departmental SWOT analysis; strategy research & development.
08. Investigate the relationship between shareholder value growth (or stagnation) and process outcomes.: Each individual department head to undertake departmental SWOT analysis; strategy research & development.
09. Create a connection between CSR, organizational objectives, and process excellence.: Each individual department head to undertake departmental SWOT analysis; strategy research & development.
10. Perform critical analysis on the current state of the organization’s process excellence journey and identify how to enable progress.: Each individual department head to undertake departmental SWOT analysis; strategy research & development.
11. Investigate the organization’s change culture and identify how to move it towards a change-enabling culture.: Each individual department head to undertake departmental SWOT analysis; strategy research & development.
12. Examine relevant indicators that provide insight into the organization’s process excellence momentum and identify suitable ways to sustain the momentum.: Each individual department head to undertake departmental SWOT analysis; strategy research & development.

Tasks
01. Create a task on your calendar, to be completed within the next month, to analyze Identify the key processes that are critical to delivering the organization’s objective and for each process, identify the Suppliers, Inputs, Activities, Outputs and Customers. .
02. Create a task on your calendar, to be completed within the next month, to analyze Identify the performance metrics for the processes that are critical to delivering the organization’s objective and assess whether they meet defined targets.
03. Create a task on your calendar, to be completed within the next month, to analyze Quantify the impact of negative process outcomes on customers, employees, shareholders, regulators, and society.
04. Create a task on your calendar, to be completed within the next month, to analyze Identify opportunities which have arisen due to recent systemic shocks (e.g., the COVID-19 pandemic and the recent cost of living crisis) and how process excellence may have helped to capitalize on these opportunities.
05. Create a task on your calendar, to be completed within the next month, to analyze Identify critical customer requirements and link these with relevant CX metrics and the processes which produce or support these products and services.
06. Create a task on your calendar, to be completed within the next month, to analyze Analyse relevant employee engagement metrics and potentially identify the reasons for the current state.
07. Create a task on your calendar, to be completed within the next month, to analyze Scrutinize relevant regulatory compliance metrics and identify the processes measured by these metrics.
08. Create a task on your calendar, to be completed within the next month, to analyze Assess the relevant metrics for evaluating stakeholder value and identify the processes which contribute to these metrics.
09. Create a task on your calendar, to be completed within the next month, to analyze Analyze relevant Corporate Social Responsibility (CSR) metrics and identify the processes which drive these metrics.
10. Create a task on your calendar, to be completed within the next month, to analyze Determine current organizational position on the process excellence journey. Implement recommendations to obtain leadership and employee buy-in.
11. Create a task on your calendar, to be completed within the next month, to analyze Position your organizational on the organizational change culture spectrum. Implement recommendations to move it towards change-enabling culture.
12. Create a task on your calendar, to be completed within the next month, to analyze Evaluate the current state of the organization’s process excellence momentum. Implement recommendations to increase mass, speed or ensure movement continues in the right direction.
Introduction

This workshop, the first in the course, is designed to equip participants with the skills and knowledge to utilize process excellence as a competitive lever, enabling their organizations to differentiate themselves from their competitors by delivering better quality products and services at lower costs. It commences by defining a process and assisting participants to understand the composite parts of the process – triggers, inputs, outputs, activities, actors, and enablers, among others. Participants are enabled to identify business processes, distinguish what are not processes and introduced to the process lifecycle.

Subsequently, following a session on process definition, participants are introduced to process excellence, examining the concept and the various ways in which process outcomes fail to meet customer expectations, including quality and non-timely delivery. However, processes can also enable opportunities, and the various ways optimized processes can help organizations seize opportunities is explored.
The next section of the workshop examines the benefits of process optimization from the perspective of five key stakeholder groups.
The first stakeholder group are customers. Participants are assisted in understanding how streamlining customer-facing processes reduces waiting times and improves responsiveness, resulting in a smoother and more enjoyable customer experience, increasing satisfaction and loyalty. Efficient processes enable organizations to respond quickly to customer needs and preferences, delivering products or services on time and providing tailored solutions. A superior customer experience differentiates an organization from its competitors and attracts new customers through positive word-of-mouth, expanding the customer base and driving revenue growth.

Next, participants will explore how process optimization increases employee engagement due to the innovative and collaborative culture that drives continuous improvements. Employees can focus on value-adding activities by eliminating inefficiencies, streamlining workflows, and delivering better results. This increased efficiency reduces workloads, stress, and burnout, promoting a healthier work environment.

Subsequently, participants will examine the relationship between process optimization and regulatory compliance. Well-documented and standardized processes enable organizations to demonstrate their adherence to regulatory requirements. As a result, regulators view the organization as a trusted partner that requires light-touch oversight. Organizations can minimize errors, fraud, and non-compliance by implementing robust controls and quality assurance measures, which not only satisfies regulatory obligations but also enhances the credibility and trustworthiness of the organization.

The penultimate stakeholder group positively impacted by process optimization are shareholders, who are delighted as improved revenue growth, operating margin, and capital efficiency increase shareholder value. The organization can reinvest cost savings achieved through process excellence in strategic initiatives, research and development, or return to shareholders as dividends.

The final stakeholder group is the wider society, including the communities in which the organization operates. In this workshop section, participants will explore how process excellence can enable the organization to exceed its Corporate Social Responsibility (CSR) objectives.

In the concluding section of the workshop, drawing heavily on proven findings from ground-breaking research in organizational neuroscience, participants start to be equipped with the tools to implement process excellence in their organization, including how to obtain buy-in from senior management, engage employees and overcome resistance to change. Next, participants are assisted to measure how receptive their organizational culture is to change so they can better prepare the organization for their process optimization journey. The course concludes by helping participants to develop the skills required to sustain process excellence, including how to embed it into the DNA of their organization.
Executive Summary

Chapter 1: What is a Process?
The course manual provides an in-depth explanation of what a process is and its various components. A process is a sequence of activities that transform inputs into valuable customer outputs. The components of a process include triggers, inputs, suppliers, activities, decision points, actors, outputs, and enablers.
Triggers are events or conditions that initiate a process, and they can be internal or external, planned or unplanned, and even time-based. Inputs are the materials or data that are transformed during the process, often supplied by internal and external suppliers. Activities are the specific tasks or steps within the process that lead to the desired outputs, which are the tangible or measurable results of the process. Decision points are moments where choices are made that affect the process’s direction, and actors are the individuals or roles responsible for executing the activities within the process. Enablers are the resources and tools that support and facilitate the process’s execution.
The manual also discusses naming conventions for processes, such as “Input-to-Outcome” and “Verb + Noun” and provides clear and consistent process naming guidelines. It highlights the importance of distinguishing between processes and one-time tasks, emphasizing that processes involve structured sequences of activities and have identifiable outputs valued by customers.
The course manual describes the natural lifecycle of processes and emphasizes the importance of understanding this lifecycle for effective process management within organizations. The process lifecycle begins with the design phase, creating a process blueprint, including its structure, workflow, and resource requirements. It then moves on to the implementation phase, where the designed process is actualized. Simultaneously, ongoing monitoring and improvement involves assessing the process’s performance and refining as needed. The diagnostic phase follows, analyzing and evaluating an existing process to identify areas for improvement. Finally, the process re-design phase aims to address shortcomings and enhance performance through goal setting, streamlining, and standardization. Performance measurement, feedback gathering, and innovation are vital throughout the lifecycle. Overall, understanding and effectively managing each stage of the process lifecycle is crucial for optimizing and adapting organizational processes.
The course manual offers a comprehensive overview of processes, their components, and guidelines for defining and naming them. It also provides questions to help determine whether an activity qualifies as a process and a detailed description of the process lifecycle.


Chapter 2: Process Definition
This course manual explores the concept of process definition, its significance, and the myriad ways it enables efficiency, quality, innovation, and adaptability within an organization.
Process definition is a systematic articulation of organizational processes that includes detailed documentation and descriptions of execution. It involves breaking down complex activities into clear steps, specifying roles, and often using visual aids like flowcharts. Processes can be defined from different perspectives, such as control flow, resource, or risk. The defined processes aid in maintaining uniformity, reducing errors, ensuring clarity, and providing a structured framework that is especially beneficial for training new staff and reinforcing sequences of activities to existing staff.
Comparing discovered processes with defined processes helps identify bottlenecks and streamline workflows, enhancing productivity and reducing operational costs. Process definition enables quality to be integrated from the beginning of the design and implementation phase rather than being tested afterwards, an approach encapsulated by the term Quality by Design. This, along with detailed documentation of quality prevention measures, assures high activity standards and continuous improvement in products or services. In regulated industries, well-defined processes are essential for adherence to legal standards, compliance, risk management, and mitigation of potential vulnerabilities.
Process definition produces artefacts like process models visually representing the process and enhancing stakeholder understanding. These models specify roles, responsibilities, triggers, inputs, outputs, and enablers utilized in executing activities and controls designed to mitigate risks. The performance metrics derived from process definitions measure efficiency, effectiveness, and quality. These metrics include Cycle Time, Touch Time, Wait Time, OTD Rate, and DPMO, which are essential for understanding and improving the process’s performance. The desired performance metrics are determined by agreeing on high-level performance objectives, defining pertinent performance dimensions for each target, and creating specific goals based on these indicators.
Process models possess three main attributes: mapping, abstraction, and purpose. Process models map real-world entities into a helpful form, simplifying reality by retaining only necessary information and serving a pre-defined purpose, making them practical for their intended audience. Different types of process models include Process Flowcharts, SIPOC, Value Stream Mapping (VSM), and Business Process Model and Notation (BPMN). Each has its advantages and serves specific purposes, from simplifying complex processes and emphasizing customer-centricity to analyzing entire value streams and standardizing graphical representations. BPMN, in particular, offers standardized symbols and elements like Start Event, End Event, Task, Gateway, and Sequence Flow, and utilizes swimlanes such as pools and lanes to categorize activities based on the responsible entity, thus enhancing clarity and organization in process diagrams.


Chapter 3: Process Excellence
The course manual delves into the concept of process outcomes, highlighting the distinction between outcomes and outputs; and how positive outcomes deliver value to customers. The manual also introduces the idea of process excellence, defined as consistently delivering positive outcomes to customers. Process performance is subsequently explored as measured along four key dimensions: time, quality, cost, and flexibility, each illustrated with examples.
Regarding process performance, the course manual outlines the importance of measuring dimensions such as time, quality, cost, and flexibility. It uses various examples to demonstrate how a deviation from expected delivery times or product specifications can lead to negative outcomes. Time, for instance, is split into two sub-dimensions: On-Time Delivery and excessive cycle time. These dimensions are critical for assessing whether the outcomes of a process met customer expectations and thus contributed to process excellence.
Furthermore, the course manual explains the impact of process outcomes on various stakeholders, emphasizing the widespread effects of negative outcomes. It presents a structured approach to quantitatively assess the consequences on customers, employees, stakeholders, regulators, and society. Several quantitative assessment methods are detailed for each group, considering financial costs, satisfaction levels, productivity metrics, compliance costs, and environmental impact. The manual underscores that these impacts compound and the challenges in attributing adverse outcomes to specific processes.
Finally, the manual stresses the significance of systematically measuring the multi-faceted impacts of process failures despite the inherent challenges. This practice enables organizations to grasp the full extent of the damages incurred, allowing them to proactively mitigate risks, enhance resilience, and safeguard the interests of all stakeholders involved. The manual concludes by noting that quantifying the impact of negative process outcomes will be revisited in future workshops focusing on Enterprise Process Modeling (EPM) and diagnosing the root causes of sub-optimal process performance.

Chapter 4: Opportunity Enablers
This course manual delineates the multi-faceted nature of business opportunities and how organizations can harness them effectively. Opportunities, characterized by ubiquity, persistence in economic hardships, and time-bound qualities, are omnipresent and emerge from various sources such as technological advances, changing consumer preferences, and globalization. Despite economic downturns, opportunities persist, stemming from niche markets, innovation and efficiency, and digital transformation. However, these opportunities are often time-sensitive, influenced by factors like first-mover advantage, seasonality, and the lifecycle of technologies.
To seize these opportunities, organizations require a combination of competence, resource allocation, and the ability to overcome barriers to entry. Competence involves market knowledge, technological proficiency, strategic vision, and adaptability. Resource allocation encompasses financial resources, human capital, technology, and supply chain management. Overcoming barriers to entry is also crucial, involving compliance with regulations, understanding competitive landscapes, protecting intellectual property, and developing effective market entry strategies. Risk management and adaptability are integral for navigating challenges and ensuring the successful pursuit of opportunities.
Process excellence is highlighted as a pivotal enabler for seizing opportunities. It enhances organizational capabilities and agility, contributing significantly to effective personnel hiring through streamlined recruitment, data-driven decision-making, positive candidate experience, and reduced time-to-hire. It also facilitates in-house skill development via comprehensive training frameworks, performance management, cross-functional collaboration, and succession planning. Additionally, process excellence supports rapid technology adoption through thorough technology assessment, structured change management, continuous improvement, and efficient data utilization.
In conclusion, the course manual underscores the importance of recognizing business opportunities’ diverse and dynamic nature; and the critical elements organizations need to capitalize on them. Emphasizing the ongoing commitment to process excellence, the manual posits that it acts as a linchpin for organizational success, fostering continuous improvement and adaptation. This commitment enables organizations to identify, pursue, and leverage opportunities for sustained growth, innovation, and excellence across industries.


Chapter 5: Customer Experience
This course manual demonstrates how Customer Experience (CX) is a pivotal concept in modern business, encompassing all interactions between a customer and a brand, influencing perceptions, loyalty, and satisfaction. CX is not only about the quality of products or services but also includes emotional, psychological, and sensory aspects of customer interactions with a brand. Businesses must focus on quality, personalization, convenience, trust, transparency, emotional connection, consistency, accessibility, and support to deliver exceptional CX. Understanding and addressing what customers value can make or break a company’s success in a competitive market.
Kano analysis, developed by Professor Noriaki Kano, is a crucial tool to enhance CX by categorizing customer needs into five categories: Basic Needs, Performance Needs, Excitement Needs, Indifferent Needs, and Reverse Needs. Applying Kano analysis helps businesses identify and prioritize efforts to meet and exceed customer expectations while addressing potential negatives. The goal is to create a memorable CX that meets customers’ expectations, surprising and delighting them, which is essential for standing out in a competitive business landscape.
Measuring CX is integral to gaining insights into customer satisfaction and loyalty and involves quantitative and qualitative methods. Several fundamental approaches, including Net Promoter Score (NPS), Customer Satisfaction (CSAT), Customer Effort Score (CES), online reviews, and customer journey mapping, are used to assess CX effectively. The success and failure of CX initiatives can significantly impact a company’s reputation and growth, as evidenced by numerous examples.
The manual concludes by clearly showing how Process excellence is pivotal in enhancing CX by focusing on efficiency, consistency, minimizing errors, employee empowerment, and data-driven insights. Key elements driving this synergy include customer-centric design, continuous improvement, automation, technology integration, and cross-functional collaboration. Examples from various companies demonstrate how focusing on process excellence can deliver superior CX, foster customer loyalty, and ensure long-term success in today’s competitive business environment. Investing in process excellence is imperative for companies that differentiate themselves through exceptional customer experiences.

Chapter 6: Employee Engagement
The course manual explores the multi-dimensional concept of employee engagement, emphasizing its significance in organizational success, productivity, and employee well-being. It details how engagement is cultivated and evolves throughout the employee lifecycle, from recruitment to retirement. It also highlights the elements employees value most, such as purpose, recognition, growth opportunities, work-life balance, positive culture, effective leadership, and fair compensation. The manual demonstrates that fostering employee engagement is essential for sustained organizational growth and excellence.
The manual also delves into the methods and importance of measuring employee engagement and its impact on organizational success and individual well-being. Various techniques, such as surveys, interviews, and feedback, are utilized to gauge employee engagement levels. It outlines the positive outcomes of engaged employees—increased productivity, innovation, lower turnover, and positive work culture—and the negative consequences of disengagement, including “quiet quitting” and “learned helplessness.” Addressing and measuring engagement is crucial for cultivating a motivated and valued workforce.
The course manual discusses the symbiotic relationship between process excellence and employee engagement, elucidating how process excellence fosters engagement by providing clarity, reducing frustration, empowering employees, enabling data-driven recognition, and offering growth opportunities. It showcases Toyota as an exemplar of leveraging process excellence to enhance engagement and organizational success. The manual shows that recognizing and leveraging the interconnection between process excellence and employee engagement is imperative for sustainable growth and a thriving workforce.
Throughout the course manual, the recurring theme is the pivotal role of employee engagement in fostering organizational success and individual well-being. Engagement is portrayed as a dynamic, evolving process intrinsically linked to various organizational practices and employee values. The course underscores the necessity of measuring engagement, addressing disengagement, and intertwining engagement with process excellence, illustrated by real-world examples, for achieving a competitive edge, innovation, and overall organizational excellence.

Chapter 7: Regulatory Compliance
This course manual delves into the intricacies of regulatory compliance, its measurement, and its interconnection with process excellence. The manual defines regulatory compliance as adherence to laws, regulations, and standards and underscores its importance in legal adherence, risk mitigation, consumer protection, and promoting ethical business practices. Regulators value transparency, accountability, documentation, proactive measures, continuous improvement, and ethical culture. The financial industry is highlighted as a sector where regulatory compliance is paramount, exemplified by the 2008 financial crisis.
Measuring regulatory compliance is essential for assessing an organization’s alignment with relevant standards and understanding the consequences of compliance practices. Several tools, including regulatory audits, KPIs, compliance checklists, surveys, and RegTech solutions, are used for this purpose. Good compliance ensures legal and ethical standing, operational efficiency, financial stability, stakeholder trust, and competitive advantage. In contrast, non-compliance can result in legal consequences, reputation damage, operational disruptions, financial losses, and loss of customers.
Process excellence and regulatory compliance are integral to the success and sustainability of organizations. Process excellence, which involves optimizing and streamlining operational workflows, serves as a catalyst for achieving and maintaining compliance. It facilitates clarity, standardization, risk identification and mitigation, efficiency, data-driven insights, documentation, and continuous improvement. The pharmaceutical industry exemplifies the intersection of these two concepts, utilizing process excellence methodologies to adhere to stringent regulations and maintain product quality and safety.
Process excellence and regulatory compliance synergy yield various benefits, including reduced compliance risks, cost savings, enhanced reputation, and improved operational efficiency. This synergy is vital in a complex and regulated business environment for ensuring long-term success, reputation management, and stakeholder trust. Organizations leveraging process excellence are better positioned to align with regulatory requirements, thereby mitigating risks associated with non-compliance.

Chapter 8: Shareholder Value
This course manual outlines shareholder value as a central concept in corporate governance, representing the financial interests of those who invest in a company. Financial performance, dividends, risk management, corporate governance, innovation, efficient capital allocation, long-term sustainability, and communication determine the fundamental measure of a company’s success. It highlights examples of increasing shareholder value, emphasizing financial performance, efficient capital allocation, transparency, and risk management. The manual also emphasizes the importance of corporations enhancing shareholder value while considering broader stakeholder responsibilities.
The course manual discusses the importance of measuring and actively growing shareholder value, offering insights into a company’s ability to generate returns for investors. Critical metrics for measuring shareholder value include market capitalization, total shareholder return (TSR), earnings per share (EPS), price-to-earnings (P/E) ratio, dividend yield, book value, and return on equity (ROE). Actively growing shareholder value has several benefits: positive returns, investor confidence, competitive advantage, attracting capital, talent attraction and retention, and sustainability. The manual provides examples of companies that have successfully grown shareholder value through innovation and a focus on customer experience.
The manual also delves into the role of process excellence in maximizing shareholder value. It underscores that process excellence, optimizing operational workflows, is vital in achieving enhanced efficiency, improved quality, faster time-to-market, cost reduction, risk mitigation, and customer satisfaction. All these factors contribute to increased shareholder value. Amazon is highlighted as a company exemplifying how process excellence can be leveraged to maximize shareholder value through efficient supply chain and distribution processes, subsequently driving revenue growth and increasing market share.
In conclusion, the course manual stresses the pivotal role of shareholder value in assessing a company’s success, illustrating the various factors and practices contributing to its enhancement. It underscores the significance of actively growing shareholder value and how process excellence catalyzes achieving this. Real-world examples illustrate the practical application and impact of the principles discussed. Balancing shareholder interests with broader stakeholder responsibilities is reiterated as essential for long-term, sustainable value creation.

Chapter 9: Social Responsibility
The course manual provides an in-depth insight into Corporate Social Responsibility (CSR), illustrating its evolution from a philanthropic effort to a fundamental element of contemporary business strategy. CSR is depicted as a commitment to ethical conduct, environmental stewardship, social responsibility, transparency, and accountability, going beyond legal obligations and profit generation. The relationship between CSR and Environmental, Social, and Governance (ESG) factors is highlighted, demonstrating their interconnectedness through environmental concerns, social considerations, and governance principles. The manual underscores the significance of CSR in enhancing company reputation, mitigating risks, fostering sustainability, attracting investments, building stakeholder trust, and creating a positive social impact, with Unilever exemplified as a case in point for successful CSR initiatives.
Furthermore, the course manual delves into diverse CSR stakeholders’ varying values and expectations, including customers, employees, investors, communities, suppliers, regulators, government bodies, NGOs, and activist groups. It emphasizes that customers prioritize ethical products and transparency, employees value ethical workplaces and community engagement, and investors favour sustainable practices and long-term value. Communities, suppliers, and regulators appreciate environmental stewardship, fair trade practices, and compliance, respectively, while NGOs and activist groups value alignment with causes and collaboration. This section concludes by stressing the importance of understanding and addressing stakeholders’ diverse needs and priorities for the success of CSR programs, which can result in improved business performance, competitive advantage, and a positive societal impact.
The manual also provides insight into measuring CSR impact through Key Performance Indicators (KPIs), sustainability reporting, social impact metrics, environmental impact assessment, and evaluating financial performance, which is essential for distinguishing between genuine CSR efforts and greenwashing.
The course manual delves into the consequences of effective and poor CSR practices. Positive CSR initiatives can enhance reputation, talent attraction, innovation, cost savings, and access to new market opportunities. At the same time, greenwashing can lead to reputation damage, loss of trust, legal repercussions, operational disruptions, and market rejection. The intersection of CSR and process excellence is also explored, demonstrating how process excellence can amplify CSR initiatives by optimizing internal workflows, promoting resource conservation, ensuring compliance, and enhancing transparency. The synergy between the two fosters sustainable business practices, employee well-being, ethical sourcing, and supplier collaboration, as exemplified by Toyota’s sustainability efforts through its Toyota Production System (TPS), which aligns process excellence with CSR to achieve significant environmental and social impacts.

Chapter 10: Implementing Excellence
The course manual outlines the intricate journey of achieving process excellence within an organization, focusing on the pivotal roles of people, leadership, and understanding the human brain. The manual begins by elaborating on the multi-faceted journey towards process excellence, emphasizing continuous improvement and optimization, with a significant emphasis on the critical role of people. It details the systematic phases of the journey, underscoring the importance of leadership, culture, change management, skills, training, and continuous improvement. Furthermore, it discusses how successful implementation hinges on the collective efforts and commitment of individuals within the organization.
The manual subsequently delves into the neurological perspective of achieving process excellence, focusing on the human brain’s seeking system. It illustrates how this system, which is closely tied to curiosity, exploration, and motivation, can be leveraged to secure buy-in from leaders and enhance employee engagement. It elucidates the importance of appealing to curiosity, framing challenges as opportunities, fostering intrinsic motivation, and rewarding and recognizing employees. By comprehending and leveraging the workings of the seeking system, organizations can tap into intrinsic motivation and empowerment to facilitate the implementation of process excellence initiatives effectively.
The course manual also provides practical steps on securing buy-in from senior management, engaging employees, and overcoming resistance to change, essential prerequisites for implementing process excellence. The benefits of process excellence need to be articulated, a specific and measurable implementation plan developed, and senior management kept informed and involved to secure management buy-in. Employee engagement is achieved through clear communication of benefits, involvement in the improvement process, and recognition and rewards. Overcoming resistance necessitates clear communication on the need for change, patience, and flexibility to adapt the plan as needed.
In conclusion, the course manual offers a comprehensive guide to achieving process excellence, focusing on the crucial elements of people, leadership, understanding the human brain, and managing change. The multi-faceted approach involves systematic phases, leveraging neurological insights, securing management buy-in, engaging employees, and addressing resistance to change. The emphasis on continuous improvement, intrinsic motivation, and the collective commitment of individuals within the organization are highlighted as essential components for realizing and sustaining process excellence and achieving organizational success.


Chapter 11: Change Culture
Organizational change culture is pivotal for modern businesses, affecting adaptability and innovation. This culture is characterized by shared attitudes towards change, and a spectrum is identified, ranging from change-resistant to change-enabling cultures, each with distinctive features and adaptability levels. Various factors, such as leadership, communication, employee involvement, past experiences, and external environment, play significant roles in shaping an organization’s change culture. Organizations benefit from cultivating a change-enabling culture supported by effective leadership, transparent communication, and active employee involvement, fostering resilience and competitiveness.
Assessing an organization’s position on the change culture spectrum is essential for managing change initiatives effectively. A range of methods, including surveys, interviews, observation, and benchmarking can be employed to gauge attitudes and behaviors towards change. Combining multiple assessment techniques, ensuring anonymity, involving diverse teams, and seeking external expertise contribute to a comprehensive understanding of the organizational change culture. Knowledge of an organization’s stance on this spectrum informs tailored change management strategies, aligning initiatives with the organization’s capabilities.
To foster innovation and growth, organizations must activate employees’ seeking systems, which involve embracing individual strengths, adopting self-reflective titles, encouraging creativity through serious play, and promoting a culture of experimentation. A strengths-based approach utilizes unique talents, while self-reflective titles allow for broader role perceptions and responsibilities. Serious play involves structured creative activities, and a culture of experimentation celebrates learning from successes and failures. These strategies contribute to employee engagement and motivation, driving positive organizational change.
In conclusion, organizational change culture is integral for business adaptability and success in today’s dynamic environment. Assessing and understanding this culture informs effective change management strategies while activating employees’ seeking systems through various techniques fosters innovation and growth. Cultivating a positive change culture and activating employee’s seeking systems contributes to an organization’s long-term resilience and competitiveness in a challenging business landscape.


Chapter 12: Sustaining Excellence
Organizational change initiatives frequently encounter varying levels of enthusiasm, often dwindling over time due to several factors, such as lack of clarity, communication, and employee involvement. This loss of interest can stem from uncertainty, fear, resistance from peers and superiors, and failure to perceive progress or benefits. Addressing these issues and maintaining clarity, involvement, and visible progress are vital for sustaining enthusiasm and ensuring successful change implementation.
By drawing parallels to physical momentum—the product of an object’s mass, speed, and direction—we can better develop a rich analogy to understand the dynamics of process excellence momentum in organizations. From a process excellence perspective, speed denotes the pace of change initiatives, mass represents the scale of people across the organization who are bought into the change initiative, and direction indicates whether process excellence is progressing forward or regressing backwards.
To sustain creativity and innovation, organizations allocate time for self-initiated projects, encourage cross-functional collaboration, provide opportunities for employees to witness their work’s impact, and celebrate innovation. This fosters autonomy, collaboration, and a sense of purpose among employees, driving the organization towards excellence and competitive advantage. Examples include companies allocating a percentage of work time to personal projects and recognizing innovative contributions through awards and incentives.
Adapting to company size and local culture is critical in implementing change. Organizations should experiment with frequency, local governance, and reward systems, avoiding a one-size-fits-all approach. Emphasizing that meaning is personal, it’s essential to consider different perspectives and levels of construal. Maintaining adaptability and fostering a culture of continuous learning and experimentation are vital in revisiting and altering strategies, ensuring the sustained success of initiatives.

Curriculum

Process Optimization – WDP1 (Competitive Advantage)
- What is a process?
- Process Definition
- Process Excellence
- Opportunity Enablers
- Customer Experience
- Employee Engagement
- Regulatory Compliance
- Shareholder Value
- Social Responsibility
- Implementing Excellence
- Change Culture
- Sustaining Excellence
Distance Learning

Introduction
Welcome to Appleton Greene and thank you for enrolling on the Process Optimization corporate training program. You will be learning through our unique facilitation via distance-learning method, which will enable you to practically implement everything that you learn academically. The methods and materials used in your program have been designed and developed to ensure that you derive the maximum benefits and enjoyment possible. We hope that you find the program challenging and fun to do. However, if you have never been a distance-learner before, you may be experiencing some trepidation at the task before you. So we will get you started by giving you some basic information and guidance on how you can make the best use of the modules, how you should manage the materials and what you should be doing as you work through them. This guide is designed to point you in the right direction and help you to become an effective distance-learner. Take a few hours or so to study this guide and your guide to tutorial support for students, while making notes, before you start to study in earnest.
Study environment
You will need to locate a quiet and private place to study, preferably a room where you can easily be isolated from external disturbances or distractions. Make sure the room is well-lit and incorporates a relaxed, pleasant feel. If you can spoil yourself within your study environment, you will have much more of a chance to ensure that you are always in the right frame of mind when you do devote time to study. For example, a nice fire, the ability to play soft soothing background music, soft but effective lighting, perhaps a nice view if possible and a good size desk with a comfortable chair. Make sure that your family know when you are studying and understand your study rules. Your study environment is very important. The ideal situation, if at all possible, is to have a separate study, which can be devoted to you. If this is not possible then you will need to pay a lot more attention to developing and managing your study schedule, because it will affect other people as well as yourself. The better your study environment, the more productive you will be.
Study tools & rules
Try and make sure that your study tools are sufficient and in good working order. You will need to have access to a computer, scanner and printer, with access to the internet. You will need a very comfortable chair, which supports your lower back, and you will need a good filing system. It can be very frustrating if you are spending valuable study time trying to fix study tools that are unreliable, or unsuitable for the task. Make sure that your study tools are up to date. You will also need to consider some study rules. Some of these rules will apply to you and will be intended to help you to be more disciplined about when and how you study. This distance-learning guide will help you and after you have read it you can put some thought into what your study rules should be. You will also need to negotiate some study rules for your family, friends or anyone who lives with you. They too will need to be disciplined in order to ensure that they can support you while you study. It is important to ensure that your family and friends are an integral part of your study team. Having their support and encouragement can prove to be a crucial contribution to your successful completion of the program. Involve them in as much as you can.
Successful distance-learning
Distance-learners are freed from the necessity of attending regular classes or workshops, since they can study in their own way, at their own pace and for their own purposes. But unlike traditional internal training courses, it is the student’s responsibility, with a distance-learning program, to ensure that they manage their own study contribution. This requires strong self-discipline and self-motivation skills and there must be a clear will to succeed. Those students who are used to managing themselves, are good at managing others and who enjoy working in isolation, are more likely to be good distance-learners. It is also important to be aware of the main reasons why you are studying and of the main objectives that you are hoping to achieve as a result. You will need to remind yourself of these objectives at times when you need to motivate yourself. Never lose sight of your long-term goals and your short-term objectives. There is nobody available here to pamper you, or to look after you, or to spoon-feed you with information, so you will need to find ways to encourage and appreciate yourself while you are studying. Make sure that you chart your study progress, so that you can be sure of your achievements and re-evaluate your goals and objectives regularly.
Self-assessment
Appleton Greene training programs are in all cases post-graduate programs. Consequently, you should already have obtained a business-related degree and be an experienced learner. You should therefore already be aware of your study strengths and weaknesses. For example, which time of the day are you at your most productive? Are you a lark or an owl? What study methods do you respond to the most? Are you a consistent learner? How do you discipline yourself? How do you ensure that you enjoy yourself while studying? It is important to understand yourself as a learner and so some self-assessment early on will be necessary if you are to apply yourself correctly. Perform a SWOT analysis on yourself as a student. List your internal strengths and weaknesses as a student and your external opportunities and threats. This will help you later on when you are creating a study plan. You can then incorporate features within your study plan that can ensure that you are playing to your strengths, while compensating for your weaknesses. You can also ensure that you make the most of your opportunities, while avoiding the potential threats to your success.
Accepting responsibility as a student
Training programs invariably require a significant investment, both in terms of what they cost and in the time that you need to contribute to study and the responsibility for successful completion of training programs rests entirely with the student. This is never more apparent than when a student is learning via distance-learning. Accepting responsibility as a student is an important step towards ensuring that you can successfully complete your training program. It is easy to instantly blame other people or factors when things go wrong. But the fact of the matter is that if a failure is your failure, then you have the power to do something about it, it is entirely in your own hands. If it is always someone else’s failure, then you are powerless to do anything about it. All students study in entirely different ways, this is because we are all individuals and what is right for one student, is not necessarily right for another. In order to succeed, you will have to accept personal responsibility for finding a way to plan, implement and manage a personal study plan that works for you. If you do not succeed, you only have yourself to blame.
Planning
By far the most critical contribution to stress, is the feeling of not being in control. In the absence of planning we tend to be reactive and can stumble from pillar to post in the hope that things will turn out fine in the end. Invariably they don’t! In order to be in control, we need to have firm ideas about how and when we want to do things. We also need to consider as many possible eventualities as we can, so that we are prepared for them when they happen. Prescriptive Change, is far easier to manage and control, than Emergent Change. The same is true with distance-learning. It is much easier and much more enjoyable, if you feel that you are in control and that things are going to plan. Even when things do go wrong, you are prepared for them and can act accordingly without any unnecessary stress. It is important therefore that you do take time to plan your studies properly.
Management
Once you have developed a clear study plan, it is of equal importance to ensure that you manage the implementation of it. Most of us usually enjoy planning, but it is usually during implementation when things go wrong. Targets are not met and we do not understand why. Sometimes we do not even know if targets are being met. It is not enough for us to conclude that the study plan just failed. If it is failing, you will need to understand what you can do about it. Similarly if your study plan is succeeding, it is still important to understand why, so that you can improve upon your success. You therefore need to have guidelines for self-assessment so that you can be consistent with performance improvement throughout the program. If you manage things correctly, then your performance should constantly improve throughout the program.
Study objectives & tasks
The first place to start is developing your program objectives. These should feature your reasons for undertaking the training program in order of priority. Keep them succinct and to the point in order to avoid confusion. Do not just write the first things that come into your head because they are likely to be too similar to each other. Make a list of possible departmental headings, such as: Customer Service; E-business; Finance; Globalization; Human Resources; Technology; Legal; Management; Marketing and Production. Then brainstorm for ideas by listing as many things that you want to achieve under each heading and later re-arrange these things in order of priority. Finally, select the top item from each department heading and choose these as your program objectives. Try and restrict yourself to five because it will enable you to focus clearly. It is likely that the other things that you listed will be achieved if each of the top objectives are achieved. If this does not prove to be the case, then simply work through the process again.
Study forecast
As a guide, the Appleton Greene Process Optimization corporate training program should take 12-18 months to complete, depending upon your availability and current commitments. The reason why there is such a variance in time estimates is because every student is an individual, with differing productivity levels and different commitments. These differentiations are then exaggerated by the fact that this is a distance-learning program, which incorporates the practical integration of academic theory as an as a part of the training program. Consequently all of the project studies are real, which means that important decisions and compromises need to be made. You will want to get things right and will need to be patient with your expectations in order to ensure that they are. We would always recommend that you are prudent with your own task and time forecasts, but you still need to develop them and have a clear indication of what are realistic expectations in your case. With reference to your time planning: consider the time that you can realistically dedicate towards study with the program every week; calculate how long it should take you to complete the program, using the guidelines featured here; then break the program down into logical modules and allocate a suitable proportion of time to each of them, these will be your milestones; you can create a time plan by using a spreadsheet on your computer, or a personal organizer such as MS Outlook, you could also use a financial forecasting software; break your time forecasts down into manageable chunks of time, the more specific you can be, the more productive and accurate your time management will be; finally, use formulas where possible to do your time calculations for you, because this will help later on when your forecasts need to change in line with actual performance. With reference to your task planning: refer to your list of tasks that need to be undertaken in order to achieve your program objectives; with reference to your time plan, calculate when each task should be implemented; remember that you are not estimating when your objectives will be achieved, but when you will need to focus upon implementing the corresponding tasks; you also need to ensure that each task is implemented in conjunction with the associated training modules which are relevant; then break each single task down into a list of specific to do’s, say approximately ten to do’s for each task and enter these into your study plan; once again you could use MS Outlook to incorporate both your time and task planning and this could constitute your study plan; you could also use a project management software like MS Project. You should now have a clear and realistic forecast detailing when you can expect to be able to do something about undertaking the tasks to achieve your program objectives.
Performance management
It is one thing to develop your study forecast, it is quite another to monitor your progress. Ultimately it is less important whether you achieve your original study forecast and more important that you update it so that it constantly remains realistic in line with your performance. As you begin to work through the program, you will begin to have more of an idea about your own personal performance and productivity levels as a distance-learner. Once you have completed your first study module, you should re-evaluate your study forecast for both time and tasks, so that they reflect your actual performance level achieved. In order to achieve this you must first time yourself while training by using an alarm clock. Set the alarm for hourly intervals and make a note of how far you have come within that time. You can then make a note of your actual performance on your study plan and then compare your performance against your forecast. Then consider the reasons that have contributed towards your performance level, whether they are positive or negative and make a considered adjustment to your future forecasts as a result. Given time, you should start achieving your forecasts regularly.
With reference to time management: time yourself while you are studying and make a note of the actual time taken in your study plan; consider your successes with time-efficiency and the reasons for the success in each case and take this into consideration when reviewing future time planning; consider your failures with time-efficiency and the reasons for the failures in each case and take this into consideration when reviewing future time planning; re-evaluate your study forecast in relation to time planning for the remainder of your training program to ensure that you continue to be realistic about your time expectations. You need to be consistent with your time management, otherwise you will never complete your studies. This will either be because you are not contributing enough time to your studies, or you will become less efficient with the time that you do allocate to your studies. Remember, if you are not in control of your studies, they can just become yet another cause of stress for you.
With reference to your task management: time yourself while you are studying and make a note of the actual tasks that you have undertaken in your study plan; consider your successes with task-efficiency and the reasons for the success in each case; take this into consideration when reviewing future task planning; consider your failures with task-efficiency and the reasons for the failures in each case and take this into consideration when reviewing future task planning; re-evaluate your study forecast in relation to task planning for the remainder of your training program to ensure that you continue to be realistic about your task expectations. You need to be consistent with your task management, otherwise you will never know whether you are achieving your program objectives or not.
Keeping in touch
You will have access to qualified and experienced professors and tutors who are responsible for providing tutorial support for your particular training program. So don’t be shy about letting them know how you are getting on. We keep electronic records of all tutorial support emails so that professors and tutors can review previous correspondence before considering an individual response. It also means that there is a record of all communications between you and your professors and tutors and this helps to avoid any unnecessary duplication, misunderstanding, or misinterpretation. If you have a problem relating to the program, share it with them via email. It is likely that they have come across the same problem before and are usually able to make helpful suggestions and steer you in the right direction. To learn more about when and how to use tutorial support, please refer to the Tutorial Support section of this student information guide. This will help you to ensure that you are making the most of tutorial support that is available to you and will ultimately contribute towards your success and enjoyment with your training program.
Work colleagues and family
You should certainly discuss your program study progress with your colleagues, friends and your family. Appleton Greene training programs are very practical. They require you to seek information from other people, to plan, develop and implement processes with other people and to achieve feedback from other people in relation to viability and productivity. You will therefore have plenty of opportunities to test your ideas and enlist the views of others. People tend to be sympathetic towards distance-learners, so don’t bottle it all up in yourself. Get out there and share it! It is also likely that your family and colleagues are going to benefit from your labors with the program, so they are likely to be much more interested in being involved than you might think. Be bold about delegating work to those who might benefit themselves. This is a great way to achieve understanding and commitment from people who you may later rely upon for process implementation. Share your experiences with your friends and family.
Making it relevant
The key to successful learning is to make it relevant to your own individual circumstances. At all times you should be trying to make bridges between the content of the program and your own situation. Whether you achieve this through quiet reflection or through interactive discussion with your colleagues, client partners or your family, remember that it is the most important and rewarding aspect of translating your studies into real self-improvement. You should be clear about how you want the program to benefit you. This involves setting clear study objectives in relation to the content of the course in terms of understanding, concepts, completing research or reviewing activities and relating the content of the modules to your own situation. Your objectives may understandably change as you work through the program, in which case you should enter the revised objectives on your study plan so that you have a permanent reminder of what you are trying to achieve, when and why.
Distance-learning check-list
Prepare your study environment, your study tools and rules.
Undertake detailed self-assessment in terms of your ability as a learner.
Create a format for your study plan.
Consider your study objectives and tasks.
Create a study forecast.
Assess your study performance.
Re-evaluate your study forecast.
Be consistent when managing your study plan.
Use your Appleton Greene Certified Learning Provider (CLP) for tutorial support.
Make sure you keep in touch with those around you.
Tutorial Support

Programs
Appleton Greene uses standard and bespoke corporate training programs as vessels to transfer business process improvement knowledge into the heart of our clients’ organizations. Each individual program focuses upon the implementation of a specific business process, which enables clients to easily quantify their return on investment. There are hundreds of established Appleton Greene corporate training products now available to clients within customer services, e-business, finance, globalization, human resources, information technology, legal, management, marketing and production. It does not matter whether a client’s employees are located within one office, or an unlimited number of international offices, we can still bring them together to learn and implement specific business processes collectively. Our approach to global localization enables us to provide clients with a truly international service with that all important personal touch. Appleton Greene corporate training programs can be provided virtually or locally and they are all unique in that they individually focus upon a specific business function. They are implemented over a sustainable period of time and professional support is consistently provided by qualified learning providers and specialist consultants.
Support available
You will have a designated Certified Learning Provider (CLP) and an Accredited Consultant and we encourage you to communicate with them as much as possible. In all cases tutorial support is provided online because we can then keep a record of all communications to ensure that tutorial support remains consistent. You would also be forwarding your work to the tutorial support unit for evaluation and assessment. You will receive individual feedback on all of the work that you undertake on a one-to-one basis, together with specific recommendations for anything that may need to be changed in order to achieve a pass with merit or a pass with distinction and you then have as many opportunities as you may need to re-submit project studies until they meet with the required standard. Consequently the only reason that you should really fail (CLP) is if you do not do the work. It makes no difference to us whether a student takes 12 months or 18 months to complete the program, what matters is that in all cases the same quality standard will have been achieved.
Support Process
Please forward all of your future emails to the designated (CLP) Tutorial Support Unit email address that has been provided and please do not duplicate or copy your emails to other AGC email accounts as this will just cause unnecessary administration. Please note that emails are always answered as quickly as possible but you will need to allow a period of up to 20 business days for responses to general tutorial support emails during busy periods, because emails are answered strictly within the order in which they are received. You will also need to allow a period of up to 30 business days for the evaluation and assessment of project studies. This does not include weekends or public holidays. Please therefore kindly allow for this within your time planning. All communications are managed online via email because it enables tutorial service support managers to review other communications which have been received before responding and it ensures that there is a copy of all communications retained on file for future reference. All communications will be stored within your personal (CLP) study file here at Appleton Greene throughout your designated study period. If you need any assistance or clarification at any time, please do not hesitate to contact us by forwarding an email and remember that we are here to help. If you have any questions, please list and number your questions succinctly and you can then be sure of receiving specific answers to each and every query.
Time Management
It takes approximately 1 Year to complete the Process Optimization corporate training program, incorporating 12 x 6-hour monthly workshops. Each student will also need to contribute approximately 4 hours per week over 1 Year of their personal time. Students can study from home or work at their own pace and are responsible for managing their own study plan. There are no formal examinations and students are evaluated and assessed based upon their project study submissions, together with the quality of their internal analysis and supporting documents. They can contribute more time towards study when they have the time to do so and can contribute less time when they are busy. All students tend to be in full time employment while studying and the Process Optimization program is purposely designed to accommodate this, so there is plenty of flexibility in terms of time management. It makes no difference to us at Appleton Greene, whether individuals take 12-18 months to complete this program. What matters is that in all cases the same standard of quality will have been achieved with the standard and bespoke programs that have been developed.
Distance Learning Guide
The distance learning guide should be your first port of call when starting your training program. It will help you when you are planning how and when to study, how to create the right environment and how to establish the right frame of mind. If you can lay the foundations properly during the planning stage, then it will contribute to your enjoyment and productivity while training later. The guide helps to change your lifestyle in order to accommodate time for study and to cultivate good study habits. It helps you to chart your progress so that you can measure your performance and achieve your goals. It explains the tools that you will need for study and how to make them work. It also explains how to translate academic theory into practical reality. Spend some time now working through your distance learning guide and make sure that you have firm foundations in place so that you can make the most of your distance learning program. There is no requirement for you to attend training workshops or classes at Appleton Greene offices. The entire program is undertaken online, program course manuals and project studies are administered via the Appleton Greene web site and via email, so you are able to study at your own pace and in the comfort of your own home or office as long as you have a computer and access to the internet.
How To Study
The how to study guide provides students with a clear understanding of the Appleton Greene facilitation via distance learning training methods and enables students to obtain a clear overview of the training program content. It enables students to understand the step-by-step training methods used by Appleton Greene and how course manuals are integrated with project studies. It explains the research and development that is required and the need to provide evidence and references to support your statements. It also enables students to understand precisely what will be required of them in order to achieve a pass with merit and a pass with distinction for individual project studies and provides useful guidance on how to be innovative and creative when developing your Unique Program Proposition (UPP).
Tutorial Support
Tutorial support for the Appleton Greene Process Optimization corporate training program is provided online either through the Appleton Greene Client Support Portal (CSP), or via email. All tutorial support requests are facilitated by a designated Program Administration Manager (PAM). They are responsible for deciding which professor or tutor is the most appropriate option relating to the support required and then the tutorial support request is forwarded onto them. Once the professor or tutor has completed the tutorial support request and answered any questions that have been asked, this communication is then returned to the student via email by the designated Program Administration Manager (PAM). This enables all tutorial support, between students, professors and tutors, to be facilitated by the designated Program Administration Manager (PAM) efficiently and securely through the email account. You will therefore need to allow a period of up to 20 business days for responses to general support queries and up to 30 business days for the evaluation and assessment of project studies, because all tutorial support requests are answered strictly within the order in which they are received. This does not include weekends or public holidays. Consequently you need to put some thought into the management of your tutorial support procedure in order to ensure that your study plan is feasible and to obtain the maximum possible benefit from tutorial support during your period of study. Please retain copies of your tutorial support emails for future reference. Please ensure that ALL of your tutorial support emails are set out using the format as suggested within your guide to tutorial support. Your tutorial support emails need to be referenced clearly to the specific part of the course manual or project study which you are working on at any given time. You also need to list and number any questions that you would like to ask, up to a maximum of five questions within each tutorial support email. Remember the more specific you can be with your questions the more specific your answers will be too and this will help you to avoid any unnecessary misunderstanding, misinterpretation, or duplication. The guide to tutorial support is intended to help you to understand how and when to use support in order to ensure that you get the most out of your training program. Appleton Greene training programs are designed to enable you to do things for yourself. They provide you with a structure or a framework and we use tutorial support to facilitate students while they practically implement what they learn. In other words, we are enabling students to do things for themselves. The benefits of distance learning via facilitation are considerable and are much more sustainable in the long-term than traditional short-term knowledge sharing programs. Consequently you should learn how and when to use tutorial support so that you can maximize the benefits from your learning experience with Appleton Greene. This guide describes the purpose of each training function and how to use them and how to use tutorial support in relation to each aspect of the training program. It also provides useful tips and guidance with regard to best practice.
Tutorial Support Tips
Students are often unsure about how and when to use tutorial support with Appleton Greene. This Tip List will help you to understand more about how to achieve the most from using tutorial support. Refer to it regularly to ensure that you are continuing to use the service properly. Tutorial support is critical to the success of your training experience, but it is important to understand when and how to use it in order to maximize the benefit that you receive. It is no coincidence that those students who succeed are those that learn how to be positive, proactive and productive when using tutorial support.
Be positive and friendly with your tutorial support emails
Remember that if you forward an email to the tutorial support unit, you are dealing with real people. “Do unto others as you would expect others to do unto you”. If you are positive, complimentary and generally friendly in your emails, you will generate a similar response in return. This will be more enjoyable, productive and rewarding for you in the long-term.
Think about the impression that you want to create
Every time that you communicate, you create an impression, which can be either positive or negative, so put some thought into the impression that you want to create. Remember that copies of all tutorial support emails are stored electronically and tutors will always refer to prior correspondence before responding to any current emails. Over a period of time, a general opinion will be arrived at in relation to your character, attitude and ability. Try to manage your own frustrations, mood swings and temperament professionally, without involving the tutorial support team. Demonstrating frustration or a lack of patience is a weakness and will be interpreted as such. The good thing about communicating in writing, is that you will have the time to consider your content carefully, you can review it and proof-read it before sending your email to Appleton Greene and this should help you to communicate more professionally, consistently and to avoid any unnecessary knee-jerk reactions to individual situations as and when they may arise. Please also remember that the CLP Tutorial Support Unit will not just be responsible for evaluating and assessing the quality of your work, they will also be responsible for providing recommendations to other learning providers and to client contacts within the Appleton Greene global client network, so do be in control of your own emotions and try to create a good impression.
Remember that quality is preferred to quantity
Please remember that when you send an email to the tutorial support team, you are not using Twitter or Text Messaging. Try not to forward an email every time that you have a thought. This will not prove to be productive either for you or for the tutorial support team. Take time to prepare your communications properly, as if you were writing a professional letter to a business colleague and make a list of queries that you are likely to have and then incorporate them within one email, say once every month, so that the tutorial support team can understand more about context, application and your methodology for study. Get yourself into a consistent routine with your tutorial support requests and use the tutorial support template provided with ALL of your emails. The (CLP) Tutorial Support Unit will not spoon-feed you with information. They need to be able to evaluate and assess your tutorial support requests carefully and professionally.
Be specific about your questions in order to receive specific answers
Try not to write essays by thinking as you are writing tutorial support emails. The tutorial support unit can be unclear about what in fact you are asking, or what you are looking to achieve. Be specific about asking questions that you want answers to. Number your questions. You will then receive specific answers to each and every question. This is the main purpose of tutorial support via email.
Keep a record of your tutorial support emails
It is important that you keep a record of all tutorial support emails that are forwarded to you. You can then refer to them when necessary and it avoids any unnecessary duplication, misunderstanding, or misinterpretation.
Individual training workshops or telephone support
Please be advised that Appleton Greene does not provide separate or individual tutorial support meetings, workshops, or provide telephone support for individual students. Appleton Greene is an equal opportunities learning and service provider and we are therefore understandably bound to treat all students equally. We cannot therefore broker special financial or study arrangements with individual students regardless of the circumstances. All tutorial support is provided online and this enables Appleton Greene to keep a record of all communications between students, professors and tutors on file for future reference, in accordance with our quality management procedure and your terms and conditions of enrolment. All tutorial support is provided online via email because it enables us to have time to consider support content carefully, it ensures that you receive a considered and detailed response to your queries. You can number questions that you would like to ask, which relate to things that you do not understand or where clarification may be required. You can then be sure of receiving specific answers to each individual query. You will also then have a record of these communications and of all tutorial support, which has been provided to you. This makes tutorial support administration more productive by avoiding any unnecessary duplication, misunderstanding, or misinterpretation.
Tutorial Support Email Format
You should use this tutorial support format if you need to request clarification or assistance while studying with your training program. Please note that ALL of your tutorial support request emails should use the same format. You should therefore set up a standard email template, which you can then use as and when you need to. Emails that are forwarded to Appleton Greene, which do not use the following format, may be rejected and returned to you by the (CLP) Program Administration Manager. A detailed response will then be forwarded to you via email usually within 20 business days of receipt for general support queries and 30 business days for the evaluation and assessment of project studies. This does not include weekends or public holidays. Your tutorial support request, together with the corresponding TSU reply, will then be saved and stored within your electronic TSU file at Appleton Greene for future reference.
Subject line of your email
Please insert: Appleton Greene (CLP) Tutorial Support Request: (Your Full Name) (Date), within the subject line of your email.
Main body of your email
Please insert:
1. Appleton Greene Certified Learning Provider (CLP) Tutorial Support Request
2. Your Full Name
3. Date of TS request
4. Preferred email address
5. Backup email address
6. Course manual page name or number (reference)
7. Project study page name or number (reference)
Subject of enquiry
Please insert a maximum of 50 words (please be succinct)
Briefly outline the subject matter of your inquiry, or what your questions relate to.
Question 1
Maximum of 50 words (please be succinct)
Maximum of 50 words (please be succinct)
Question 3
Maximum of 50 words (please be succinct)
Question 4
Maximum of 50 words (please be succinct)
Question 5
Maximum of 50 words (please be succinct)
Please note that a maximum of 5 questions is permitted with each individual tutorial support request email.
Procedure
* List the questions that you want to ask first, then re-arrange them in order of priority. Make sure that you reference them, where necessary, to the course manuals or project studies.
* Make sure that you are specific about your questions and number them. Try to plan the content within your emails to make sure that it is relevant.
* Make sure that your tutorial support emails are set out correctly, using the Tutorial Support Email Format provided here.
* Save a copy of your email and incorporate the date sent after the subject title. Keep your tutorial support emails within the same file and in date order for easy reference.
* Allow up to 20 business days for a response to general tutorial support emails and up to 30 business days for the evaluation and assessment of project studies, because detailed individual responses will be made in all cases and tutorial support emails are answered strictly within the order in which they are received.
* Emails can and do get lost. So if you have not received a reply within the appropriate time, forward another copy or a reminder to the tutorial support unit to be sure that it has been received but do not forward reminders unless the appropriate time has elapsed.
* When you receive a reply, save it immediately featuring the date of receipt after the subject heading for easy reference. In most cases the tutorial support unit replies to your questions individually, so you will have a record of the questions that you asked as well as the answers offered. With project studies however, separate emails are usually forwarded by the tutorial support unit, so do keep a record of your own original emails as well.
* Remember to be positive and friendly in your emails. You are dealing with real people who will respond to the same things that you respond to.
* Try not to repeat questions that have already been asked in previous emails. If this happens the tutorial support unit will probably just refer you to the appropriate answers that have already been provided within previous emails.
* If you lose your tutorial support email records you can write to Appleton Greene to receive a copy of your tutorial support file, but a separate administration charge may be levied for this service.
How To Study

Your Certified Learning Provider (CLP) and Accredited Consultant can help you to plan a task list for getting started so that you can be clear about your direction and your priorities in relation to your training program. It is also a good way to introduce yourself to the tutorial support team.
Planning your study environment
Your study conditions are of great importance and will have a direct effect on how much you enjoy your training program. Consider how much space you will have, whether it is comfortable and private and whether you are likely to be disturbed. The study tools and facilities at your disposal are also important to the success of your distance-learning experience. Your tutorial support unit can help with useful tips and guidance, regardless of your starting position. It is important to get this right before you start working on your training program.
Planning your program objectives
It is important that you have a clear list of study objectives, in order of priority, before you start working on your training program. Your tutorial support unit can offer assistance here to ensure that your study objectives have been afforded due consideration and priority.
Planning how and when to study
Distance-learners are freed from the necessity of attending regular classes, since they can study in their own way, at their own pace and for their own purposes. This approach is designed to let you study efficiently away from the traditional classroom environment. It is important however, that you plan how and when to study, so that you are making the most of your natural attributes, strengths and opportunities. Your tutorial support unit can offer assistance and useful tips to ensure that you are playing to your strengths.
Planning your study tasks
You should have a clear understanding of the study tasks that you should be undertaking and the priority associated with each task. These tasks should also be integrated with your program objectives. The distance learning guide and the guide to tutorial support for students should help you here, but if you need any clarification or assistance, please contact your tutorial support unit.
Planning your time
You will need to allocate specific times during your calendar when you intend to study if you are to have a realistic chance of completing your program on time. You are responsible for planning and managing your own study time, so it is important that you are successful with this. Your tutorial support unit can help you with this if your time plan is not working.
Keeping in touch
Consistency is the key here. If you communicate too frequently in short bursts, or too infrequently with no pattern, then your management ability with your studies will be questioned, both by you and by your tutorial support unit. It is obvious when a student is in control and when one is not and this will depend how able you are at sticking with your study plan. Inconsistency invariably leads to in-completion.
Charting your progress
Your tutorial support team can help you to chart your own study progress. Refer to your distance learning guide for further details.
Making it work
To succeed, all that you will need to do is apply yourself to undertaking your training program and interpreting it correctly. Success or failure lies in your hands and your hands alone, so be sure that you have a strategy for making it work. Your Certified Learning Provider (CLP) and Accredited Consultant can guide you through the process of program planning, development and implementation.
Reading methods
Interpretation is often unique to the individual but it can be improved and even quantified by implementing consistent interpretation methods. Interpretation can be affected by outside interference such as family members, TV, or the Internet, or simply by other thoughts which are demanding priority in our minds. One thing that can improve our productivity is using recognized reading methods. This helps us to focus and to be more structured when reading information for reasons of importance, rather than relaxation.
Speed reading
When reading through course manuals for the first time, subconsciously set your reading speed to be just fast enough that you cannot dwell on individual words or tables. With practice, you should be able to read an A4 sheet of paper in one minute. You will not achieve much in the way of a detailed understanding, but your brain will retain a useful overview. This overview will be important later on and will enable you to keep individual issues in perspective with a more generic picture because speed reading appeals to the memory part of the brain. Do not worry about what you do or do not remember at this stage.
Content reading
Once you have speed read everything, you can then start work in earnest. You now need to read a particular section of your course manual thoroughly, by making detailed notes while you read. This process is called Content Reading and it will help to consolidate your understanding and interpretation of the information that has been provided.
Making structured notes on the course manuals
When you are content reading, you should be making detailed notes, which are both structured and informative. Make these notes in a MS Word document on your computer, because you can then amend and update these as and when you deem it to be necessary. List your notes under three headings: 1. Interpretation – 2. Questions – 3. Tasks. The purpose of the 1st section is to clarify your interpretation by writing it down. The purpose of the 2nd section is to list any questions that the issue raises for you. The purpose of the 3rd section is to list any tasks that you should undertake as a result. Anyone who has graduated with a business-related degree should already be familiar with this process.
Organizing structured notes separately
You should then transfer your notes to a separate study notebook, preferably one that enables easy referencing, such as a MS Word Document, a MS Excel Spreadsheet, a MS Access Database, or a personal organizer on your cell phone. Transferring your notes allows you to have the opportunity of cross-checking and verifying them, which assists considerably with understanding and interpretation. You will also find that the better you are at doing this, the more chance you will have of ensuring that you achieve your study objectives.
Question your understanding
Do challenge your understanding. Explain things to yourself in your own words by writing things down.
Clarifying your understanding
If you are at all unsure, forward an email to your tutorial support unit and they will help to clarify your understanding.
Question your interpretation
Do challenge your interpretation. Qualify your interpretation by writing it down.
Clarifying your interpretation
If you are at all unsure, forward an email to your tutorial support unit and they will help to clarify your interpretation.
Qualification Requirements
The student will need to successfully complete the project study and all of the exercises relating to the Process Optimization corporate training program, achieving a pass with merit or distinction in each case, in order to qualify as an Accredited Process Optimization Specialist (APOS). All monthly workshops need to be tried and tested within your company. These project studies can be completed in your own time and at your own pace and in the comfort of your own home or office. There are no formal examinations, assessment is based upon the successful completion of the project studies. They are called project studies because, unlike case studies, these projects are not theoretical, they incorporate real program processes that need to be properly researched and developed. The project studies assist us in measuring your understanding and interpretation of the training program and enable us to assess qualification merits. All of the project studies are based entirely upon the content within the training program and they enable you to integrate what you have learnt into your corporate training practice.
Process Optimization – Grading Contribution
Project Study – Grading Contribution
Customer Service – 10%
E-business – 05%
Finance – 10%
Globalization – 10%
Human Resources – 10%
Information Technology – 10%
Legal – 05%
Management – 10%
Marketing – 10%
Production – 10%
Education – 05%
Logistics – 05%
TOTAL GRADING – 100%
Qualification grades
A mark of 90% = Pass with Distinction.
A mark of 75% = Pass with Merit.
A mark of less than 75% = Fail.
If you fail to achieve a mark of 75% with a project study, you will receive detailed feedback from the Certified Learning Provider (CLP) and/or Accredited Consultant, together with a list of tasks which you will need to complete, in order to ensure that your project study meets with the minimum quality standard that is required by Appleton Greene. You can then re-submit your project study for further evaluation and assessment. Indeed you can re-submit as many drafts of your project studies as you need to, until such a time as they eventually meet with the required standard by Appleton Greene, so you need not worry about this, it is all part of the learning process.
When marking project studies, Appleton Greene is looking for sufficient evidence of the following:
Pass with merit
A satisfactory level of program understanding
A satisfactory level of program interpretation
A satisfactory level of project study content presentation
A satisfactory level of Unique Program Proposition (UPP) quality
A satisfactory level of the practical integration of academic theory
Pass with distinction
An exceptional level of program understanding
An exceptional level of program interpretation
An exceptional level of project study content presentation
An exceptional level of Unique Program Proposition (UPP) quality
An exceptional level of the practical integration of academic theory
Preliminary Analysis

FUNDAMENTALS OF BUSINESS PROCESS MANAGEMENT
Book by Marlon Dumas, Marcello La Rosa, Jan Mendling & Hajo Reijers
Foreword
Business processes represent one of the core assets of organisations for many reasons. They have direct impact on the attractiveness of products and services, influence customer experiences and ultimately revenue in case of corporations. Processes orchestrate corporate resources to fulfil these external demands and therefore are a key factor determining the cost-to-serve and operational efficiency.
In particular, they determine tasks, jobs, and responsibilities and by this, shape the future work of every employee and machine along a business process. Processes are the arterial system within organisations and in inter-organizational supply networks. Consequently, any process failure can bring corporate life and the entire process ecosystem to a standstill. Processes determine the potential and speed of an organization to adapt to new circumstances and to comply with a fast-growing number of legislative requirements.
However, unlike other corporate assets such as products, services, workforce, brand, physical or monetary assets, the significance of business processes had not been appreciated for a long period. Despite the fact that processes are the lifeblood of an organization, they did not develop the status of a primary citizen in boardroom discussions and managerial decision-making processes until the very end of the twentieth century.
The growing demands for globalization, integration, standardization, innovation, agility, and operational efficiency, coupled with the opportunities raised by digital technologies, have finally increased the appetite for reflecting on and ultimately improving existing as well as designing entire new business processes.
In response, a comprehensive body of tools, techniques, methods, and entire methodologies to support all stages of the business process lifecycle has emerged over the past two decades. It is called Business Process Management (BPM), and it consolidates a plethora of tools and approaches coming from diverse disciplines, including Industrial Engineering, Operations Management, Quality Management, Human Capital Management, Corporate Governance, Computer Science, and Information Systems Engineering.
“Fundamentals of Business Process Management” takes on the challenge pedagogically. It brings meaningful order and consistency into approaches that often have been developed, discussed, and deployed in isolation. It derives its merits from its firm foundation in the latest applied BPM research. Relying on scientifically sound practices means capitalizing on evidence rather than depending on confidence. This clearly differentiates this much-needed publication from many of its predecessors. In particular, it gives BPM the credibility that a still growing discipline requires.
The book itself is also a compelling showcase for the importance of a new class of processes, i.e. internationally distributed, complex, and flexible business processes. In this case, it is the process of jointly writing a book involving four authors in four different countries. The team has addressed this challenge brilliantly and the outcome is an impressive compilation of the individual strengths of each author grounded in a shared understanding of the essential BPM fundamentals and a common passion for the topic.
It has been no surprise that the first edition of the book had a tremendous uptake and gained rapid adoption worldwide. The hundreds of institutions that have adopted the book in their teaching, and the tens of thousands of students and professionals who have taken the Massive Open Online Course (MOOC) developed on the basis of this book, are a testimony of both the growing demand for BPM education and the technical and pedagogical value of the book.
As the field evolves and matures, a second updated and extended edition is most welcome. The second edition significantly expands the reach of the first one with a more in-depth coverage of process architecture, process discovery, process innovation, process analytics, BPM strategic alignment, and governance, all of which are essential ingredients in a sustainable BPM program.
I have no doubts that this second edition will contribute to shaping the toolset, and even more the mindset, of the current and future generations of BPM professionals. The book will continue to be the standard reference for everyone who is keen to learn more about.
If you would like to know more, Click Here

ALIVE AT WORK: THE NEUROSCIENCE OF HELPING YOUR PEOPLE LOVE WHAT THEY DO
Book by Dan Cable
Synopsis
Poll after poll has confirmed that an astonishing number of workers are disengaged from their work. Why is this happening? And how can we fix the problem?
In this bold, enlightening book, social psychologist and professor Daniel M. Cable takes leaders into the minds of workers and reveals the surprising secret to restoring their zest for work. Disengagement isn’t a motivational problem, it’s a biological one. Humans aren’t built for routine and repetition. We’re designed to crave exploration, experimentation, and learning – in fact, there’s a part of our brains, which scientists have coined “the seeking system”, that rewards us for taking part in these activities. But the way organizations are run prevents many of us from following our innate impulses. As a result, we shut down.
Things need to change. More than ever before, employee creativity and engagement are needed to win. Fortunately, it won’t take an extensive overhaul of your organizational culture to get started. With small nudges, you can personally help people reach their fullest potential. Alive at Work reveals:
o How to encourage people to bring their best selves to work and use their greatest strengths to help your organization flourish
o How to build creative environments that motivate people to share ideas, work smarter, and embrace change.
o How to enhance people’s connection to their work and your customers
o How to create personalized experiences that help people feel a deeper sense of purpose.
Filled with fascinating stories from the author’s extensive research, Alive at Work is the inspirational guide that you need to tap into the passion, creativity, and purpose fizzing beneath the surface of every person who falls under your leadership.
If you would like to know more, Click Here

THE LEADER’S GUIDE TO CORPORATE CULTURE
Article by Boris Groysberg, Jeremiah Lee, Jesse Price & J. Yo-Jud Cheng
Synopsis
We undertook a comprehensive study of organizational culture and outcomes to explore the link between them. We analyzed the cultures of more than 230 companies along with the leadership styles and values of more than 1,300 executives across a range of industries (including consumer discretionary, consumer staples, energy and utilities, financial and professional services, health care, industrials, and IT and telecommunications), regions (Africa, Asia, Europe, the Middle East, North America, Oceania, and South America), and organizational types (public, private, and nonprofit). We diagnosed those cultures using online survey responses from approximately 25,000 employees together with interviews of company managers.
Our analysis highlighted how strongly each of the eight styles defined the organizations in our study. Results ranked first, and caring second. This pattern is consistent across company types, company sizes, regions, and industries. Order and learning ranked among the third and fourth most common styles in many cultures.
Culture appears to most directly affect employee engagement and motivation, followed by customer orientation. To model its relationship to organizational outcomes, we assessed employee engagement levels for all the companies using widely accepted survey questions and arrived at customer-orientation scores with an online questionnaire. In many cases we also documented top leaders’ individual styles and values.
We found that employee engagement is most strongly related to greater flexibility, in the form of enjoyment, learning, purpose, and caring. Similarly, we observed a positive relationship between customer orientation and those four styles plus results. These relationships, too, are surprisingly consistent across companies. We also found that engagement and customer orientation are stronger when employees are in close agreement about the culture’s characteristics.
Our research was influenced by the work of countless scholars in this field, many of whom are mentioned in this article. In addition, we stand on the shoulders of giants such as David Caldwell, Jennifer Chatman, James Heskett, John Kotter, Charles O’Reilly, and many, many others who have inspired our thinking.
If you would like to know more, Click Here

Recommended Pre-Workshop Activities
Collect existing organizational metrics or KPIs that quantifies the current performance on the following stakeholder dimensions:
o Customers e.g., cost of complaints, fines, refunds and CX metrics (e.g., Net Promoter Scores, Customer Satisfaction Scores, Customer Effort Scores, etc)
o Employees e.g., Absenteeism Rate, Employee Satisfaction Index (ESI), Employee Net Promoter Score, Employee Turnover rate
o Regulators e.g., Compliance Costs Per Issue, Mean Time to Issue Discovery (MTTID), Mean Time to Issue Resolution (MTTIR), Number of Breaches, Risk Mitigation Timeframe
o Society e.g., Carbon footprint, Water usage, Employee Volunteer Hours, Supplier Sustainability Score, Gender Ratio (or other D & I metrics)
o Shareholders e.g., COGS Margin Ratio, Sales Growth, SG & A expenses, Net PPE, Inventory Management Costs”
o Change Culture e.g., Change Readiness Assessment, Employee Turnover Rate Post-Change, Stakeholder Engagement Score, Change Adoption Rate, Post-Change Performance Metrics
Course Manuals 1-12

Course Manual 1: What is a process?
What is a process?
1.1 Introduction
Simply put, a process transforms inputs into outputs considered valuable to customers using a sequence of activities (or steps).
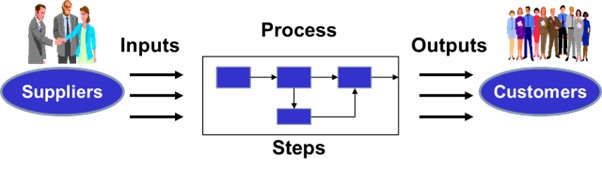
1.2 Components of a process
To illustrate, consider the process of applying for a credit card from a bank. Below are the various components of this process:
Trigger:

Process triggers are events, conditions, or situations that initiate or kick-start the process, serving as catalysts that set the process into motion. In the example above, the trigger is the receipt of an application from a customer (hereafter referred to as the applicant).
Triggers can be internal or external to the organization and can be planned or unplanned. They often indicate the need for action or a response. Triggers could also be time-based or temporal, activating a process at a predetermined or scheduled point in time, e.g., generating the sales report at the end of each quarter.
Examples of other process triggers include:
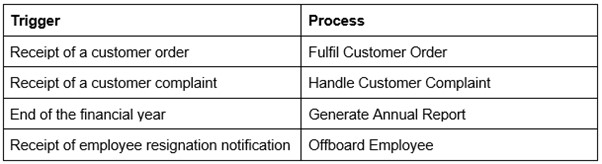
Inputs:

Process inputs are the physical and virtual objects transformed during the process. For the credit card application process, the inputs include various data points about the applicant (e.g., identity data, credit score)
Suppliers:

In the context of business processes, suppliers refer to the entities or organizations that provide the required process inputs. For example, a credit agency typically supplies the applicant’s credit score.
Process suppliers can be both internal and external to an organization.
Internal Suppliers are departments, teams, or units within an organization that provide inputs to processes within the same organization. For example, in a manufacturing company, the materials procurement department can be considered an internal supplier providing raw materials for production.
External Suppliers are external entities or organizations that provide inputs, materials, or components to an organization’s processes. These external suppliers can include vendors, suppliers, subcontractors, and service providers. For instance, a car manufacturer relies on external suppliers for components like tires, electronics, and seat upholstery.
Activities:

Activities are the specific tasks or steps performed within a process to transform inputs into desired outputs. Specifically, a task is a single unit of work (e.g.), whilst an activity refers to a collection of tasks. For example, performing a Know-Your-Customer (KYC) check is a composite task that involves verifying the applicant’s identity and ensuring they are not on a sanctions list, among others. A distinction can also be made between events (which happen instantaneously, e.g., receipt of the application) and activities (which take time to complete, e.g., review of the application). For the sake of simplicity, throughout this course, we will not distinguish between tasks, events and activities and simply refer to activities.
These activities are typically sequenced logically and designed to achieve the process outcomes. Activities can be both manual and automated and often progressively increase the value of the inputs as these transform.
For the credit process, typical activities include performing KYC checks, assessing the customer’s eligibility and deciding the credit limit.
Decision Points:
Decision points are specific junctures within a process where choices or decisions must be made. These decisions can affect the direction or outcome of the process. Decision points often involve evaluating alternatives and selecting the most appropriate course of action based on predefined criteria.
For the credit card application process, key decision points include whether to reject or approve the credit application and the card credit limit (if the application is approved).
Actors:
Process actors are the individuals or roles responsible for executing the activities within a process. Actors perform tasks, make decisions, and contribute to completing the process. Actors can be employees, contractors, stakeholders, or automated systems.
Process actors may be internal and external to the organization. Examples of internal actors in the example above are the KYC analyst, credit officer and Robotic Process Automation (RPA) bots involved in executing activities. These actors are also referred to as process performers (or resources). The credit agency and other external data providers are external actors (also known as a business party).

The actor who consumes the output of a process is referred to as the customer (who may be internal or external). In the example above, the customer is the applicant. It is also worth noting that a process may have multiple customers.

Outputs:

Outputs are the products or deliverables generated by executing the activities within a process. They contribute to the outcomes of the process and are often intended to meet specific goals or requirements. Outputs can take various forms, such as reports, products, services, or decisions.
The outputs for the credit application include physical items (such as credit cards) and informational objects such as papers and electronic records (e.g., the decision and email sent to the applicant). Other examples of process outputs include a financial report, a manufactured product or a customer order fulfilment.
Enablers:

Process enablers are the resources, tools and systems that support and facilitate the successful execution of a process. They provide the necessary means for individuals or teams to carry out their tasks efficiently and effectively. A key differentiator between inputs and enablers is that while inputs undergo a transformation, enablers do not. An example of an enabler for the credit card application process is the Credit IT system, which reduces the effort required to execute activities but is not transformed. Enablers ensure that a process runs smoothly and achieves its intended outcomes.
Other examples of process enablers include:
● Skills and expertise required to execute activities.
● Clear and well-documented procedures and guidelines.
● Supportive organizational culture and leadership commitment.
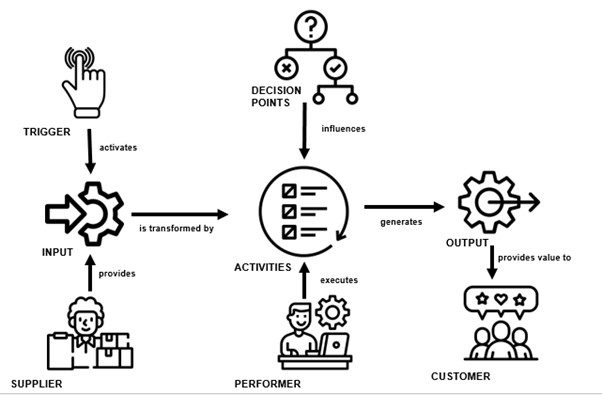
Processes are ubiquitous; in other words, they exist in many business and domestic settings. For example, making a cup of tea is a process consisting of inputs (such as boiling water, milk, and sugar) supplied by the supermarket delivery service and transformed into a cup of tea for your colleague, friend or partner (. i.e. the customer) through a series of activities (.i.e. Boiling the kettle, pouring into a mug, inserting tea bag into the hot water, etc.). The kettle is an example of an enabler in this process. While this course manual focuses on business processes, it is helpful to understand that processes are all around us.
Processes are often “hidden” by activities. For example, if requested to make a cup of tea, we don’t often think, “I need to instantiate a process”. Instead, we focus on the activities that require completion (boiling the kettle, etc.). However, as later demonstrated, it is often beneficial to adopt a process lens, especially when process outcomes fail to meet expectations. Specifically, it can help to diagnose whether the cause of the undesired process outcomes are inputs which do not meet the required specification, sub-optimal configuration of activities or defective enablers, among others.
1.3 Naming Processes
Different conventions for naming processes exist. Two of the most common are discussed below:
Input-to-Outcome: Processes are often named in the format Input-to-Outcome, e.g., Credit Card Application-to-Activation. Other examples of this format are IT Issue-to-Resolution, triggered by a customer raising an IT issue and ends when the issue is satisfactorily resolved, or Equipment Order-to-Cash, which commences when a customer order is placed and ends when full payment is received from the customer. The main advantage of this convention is that it enables the inputs and outcomes of the process to be correctly inferred and delineates the process boundaries.
Verb+Noun: In this format, the name of the process starts with an action verb that describes what the process does, followed by a noun that identifies the object or focus of the process. For example:
● Generate Sales Report
● Investigate Customer Complaint
● Review Employee Performance
The main advantage of this format is that it enables the end state of the process to be determined, e.g., a sales report has been generated. Additionally, it can assist in determining whether the candidate process is indeed a process or not.
In terms of utility, the difference between both conventions is slight. However, we will adopt the Input-to-Outcome format throughout this course.
Whichever format is adopted, the following guidelines should be followed:
● Avoiding Jargon: It’s essential to use clear and understandable language in process names to ensure that they are easily comprehensible by all stakeholders, including those needing to become more familiar with technical or industry-specific terms.
● Consistency: Maintain consistency in process naming conventions across the organization to make it easier for employees to identify, understand, and work with processes. It is not advisable to adopt a mixture of formats.
● Versioning (if applicable): As processes are updated or revised, consider incorporating a version number or date into the process name to differentiate between different iterations. For example, “SalesReportGeneration_v2” or “EmployeeOnboarding_2023.”

Exercise 1.1:
1. List ten processes: five from a business and five from a domestic perspective.
2. Name these using the ‘Input-to-Outcome’ convention.
3. For each process, identify the:
o Supplier(s)
o Input(s)
o Activities
o Output(s)
o Customer(s)
1.4 What is not a process?
While processes are pervasive, it is equally important to recognize what does not qualify as a process. Some activities seem like processes but lack the essential characteristics of a process. The following guidelines will assist in determining whether a candidate qualifies as a process or not:
● Does it adhere to the process naming convention? As mentioned above, an advantage of the ‘Verb+Noun’ process naming convention is that it assists in determining whether the candidate process is indeed a process. Consider the example ‘Generate Sales Reports’. The main action performed in this process is identifiable (.i.e. Generate), and the output (.i.e. Sales reports) enables us to test whether the process output conforms to the ‘Noun+Past Participle’ pattern. For example, completed cases in this example are sales reports which have been generated.
● Is it a one-time task/activity? One-time tasks that do not involve a structured sequence of activities are not processes. For example, writing a single email or making an occasional phone call are not processes but discrete actions. However, these activities may be part of a process. A helpful way to test this is to consider whether at least three different actors are involved (excluding the customer).
Additional Questions
● Can cases for the process be distinguished one from the other?
● Is there a customer that values the output and would be willing to pay for it?
● Is there a compelling regulatory reason to execute it?
1.5 Process Lifecycle
As with organisms and entities, processes have a natural lifecycle, commencing with their design (analogous to being born) and ending (for certain – but not all processes) with termination (akin to death). Organizations must understand the process lifecycle to effectively manage, optimize, and adapt these processes.
Processes start in the design phase (see Box 1 in Figure 1.3), followed by the designed process’s implementation and configuration (Box 2). The implemented process is monitored and adjusted incrementally as required (Boxes 3 and 3a). However, just as we might decide to stop fixing our current car and invest in a new one, if the process significantly fails to meet its critical requirements, it is often necessary to diagnose the root cause of problems (Box 4) and radically redesign the process (Box 5). While process termination may occur for various reasons (including obsolescence, redundancy, or strategic shifts, e.g., exiting a market), certain processes cannot feasibly be terminated while the organization is active. Examples of these critical processes are the Procure-to-Pay process (which enables the company to procure goods and services) and the Hire-to-Retire process (which enables the company to manage employees effectively). Often, these processes will undergo multiple iterations of redesign during their lifetime.
Below is a more detailed description of the stages of the process lifecycle
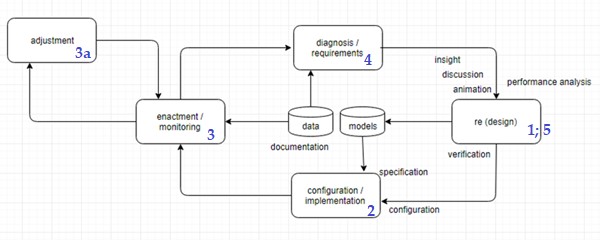
Design
Once the need for a process is identified, the design and planning stage comes into play. This phase involves creating a blueprint for the process, including its structure, workflow, and resource requirements. Key activities in this stage include:
● Process Definition: Creating detailed process maps or flowcharts visually representing the process’s steps, decisions, and interactions. (Detailed coverage in Course Manual 2)
● Resource Allocation: Identifying the human, technological, and financial resources required to execute the process effectively.
● Risk Assessment: Evaluating potential risks and devising strategies to mitigate them.
● Performance Metrics: Defining key performance indicators (KPIs) that will be used to measure the success of the process. (Detailed coverage in Workshops 4 and 6)
Configuration/Implementation
The implementation stage is where the designed process is brought to life. This phase involves executing the process according to the plan developed in the previous stage. Key activities in this stage include:
● Training: Ensuring the individuals executing the process are adequately trained and clearly understand their roles and responsibilities.
● Testing: Conduct pilot tests or simulations to identify issues and fine-tune the process before full-scale implementation.
● Establish Monitoring Framework: Establish mechanisms to monitor the process in real-time and make necessary adjustments to maintain efficiency and quality.
Enactment/Monitoring
The monitoring and improvement stage is ongoing and runs in parallel with the implementation phase. It involves continuously assessing the process’s performance and making refinements as needed. Key activities in this stage include:
● Performance Measurement: Regularly measuring and analyzing the process’s performance against predefined KPIs. (Detailed coverage in Workshops 6 using historical process data and Workshops 9-10 using real-time data)
● Feedback Gathering: Collecting feedback from stakeholders, including employees and customers, to identify areas for improvement.
● Process Optimization: Adjusting to streamline the process, reduce bottlenecks, and enhance efficiency. (Detailed coverage in Workshop 8)
● Innovation: Encouraging and implementing innovations that can enhance the process, such as automation or new technologies. (Detailed coverage in Course Manual 10-12 and Workshop 12)
Diagnosis/Requirements:
The analysis and assessment of an existing process to identify its strengths, weaknesses, bottlenecks, and areas for improvement. This diagnostic phase typically includes the following key activities:
● Stakeholder Interviews: Engaging with individuals involved in or affected by the process to gain insights into their experiences and perceptions.
● Root Cause Analysis: Identifying the underlying causes of any inefficiencies, errors, or challenges within the process. (Detailed coverage in Workshop 7 using historical process data and Workshop 10 using real-time data to detect and prevent problems from occurring)
● Benchmarking: Comparing the process’s performance against other organizations’ industry best practices or similar processes.
Process Redesign:
Process redesign follows the diagnostic phase and involves making intentional changes to the existing process to address identified shortcomings and improve overall performance. This phase includes the following key activities:
● Goal Setting: Establish clear and measurable goals and objectives for the re-designed process to ensure alignment with organizational priorities.
● Redesign Planning: Develop a detailed plan that outlines the changes to be implemented, including alterations to workflow, resource allocation, and technology utilization. (Detailed coverage in Workshops 8 and 12)
● Streamlining: Simplifying and optimizing the process by eliminating unnecessary steps, automating manual tasks, and improving decision-making points.
● Standardization: Implementing standardized procedures and protocols to ensure consistency and reduce variations in process execution.
● Training and Change Management: Providing training to staff and managing the transition to the re-designed process to ensure successful adoption. (Detailed coverage in Course Manual 12 and Workshop 12)
● Monitoring and Continuous Improvement: Establishing mechanisms for ongoing monitoring and evaluation to track the performance of the re-designed process, gather feedback, and make further adjustments as necessary. (Detailed coverage in Workshop 6)

Case Study
Adverse Drug Side Effect Identification-to-Documented Countermeasures Process, Medistar
Problem
This pharmaceutical company recognized that the elapsed time from identifying an adverse effect in a drug to documenting countermeasures was taking several days, which was considered excessive given the potential repercussions of an unknown risk. This pharmacovigilance process is critical to the safety of the drug consumers because, even though the drug undergoes extensive testing before approval for marketing to the public, when it is made available to the broader population, its known safety profile might change. As such, it was essential that new side effects were identified promptly and the resultant risk effectively mitigated.
Process Redesign Activities
The process redesign project team adopted the Identify-Design-Optimize-Verify (IDOV) methodology. Below is a summary of key activities undertaken in each phase and the outputs:
i. Identify
● The team collected data from the Voice-of-the-Customer (VOC), and the attributes that were most critical to the quality of the process outputs (CTQs) were summarized in a design scorecard.
● An initial baseline that demonstrated the performance of the current process against the requirements was produced using historical data (see Figure 1.4).
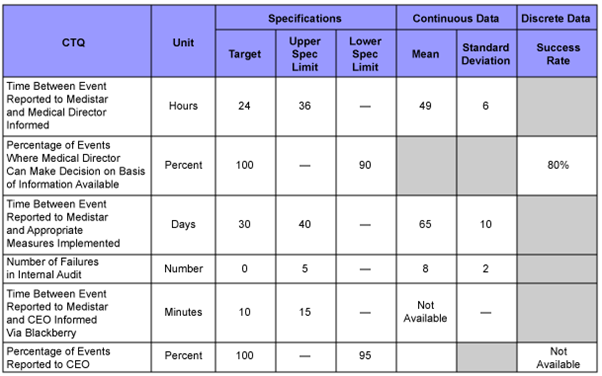
Figure 1.4 – As-Is Process Design Scorecard
ii. Design
● The team defined the ‘To-Be’ process of the process showing detailed activities, responsibilities and requirements for enablers e.g., IT systems.
● This process map served as input into defining user requirements specifications for a new IT pharmacovigilance system which was being built to support the new process. These requirements were subsequently prioritized against the CTQs, which enabled the conceptual design of this system.
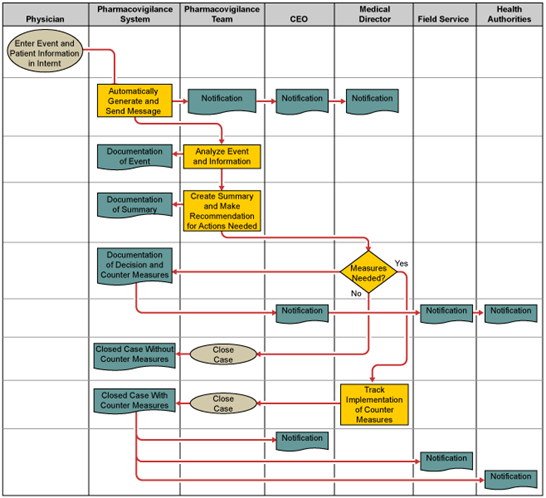
Figure 1.5 – ‘To-Be’ Process Map
iii. Optimize
● As the new IT pharmacovigilance system was a critical enabler in optimizing the process, this phase was spent testing, validating and modifying the system to ensure it satisfied user requirements.
iv. Verify
● The project team implemented a dashboard to measure the refreshed CTQ metrics for comparison against the baseline (see Figure 1.6).
● Process performers were trained in using the new IT system, and the old system was decommissioned.
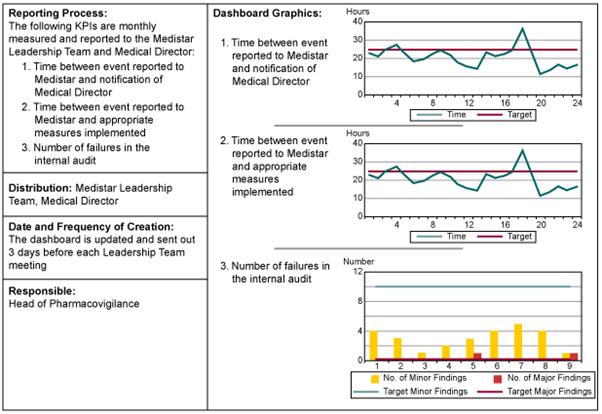
Figure 1.6 –Process Dashboard
Results
● The new process was transitioned to the Head of Pharmacovigilance (the Process Owner).
● Post-implementation process outcomes (measured after two months) indicated that the process and IT system performed as expected.
Source: isixsigma.com
Exercise 1.2:
1. Review the list of processes from Exercise 1.1 to identify any items deemed NOT to be processes based on the information above.
2. Document the group justification for each listed item. In other words, if it is agreed the item is a process, explain why and do the same if it is deemed not to be a process.

Course Manual 2: Process Definition
2.1 Introduction
Process definition refers to the systematic and detailed articulation of organizational processes, including comprehensive documentation and a description of how these are executed. It involves breaking down complex activities into a series of well-defined steps, specifying roles and responsibilities, and often incorporating visual representations like flowcharts or diagrams for clarity. Processes can be defined from a control flow perspective (which focuses on the flow of activities), resource perspective (focusing on the handover of work from one process performer to another) or risk perspective (showing where risks occur in the process and the controls for mitigating these), among others.
2.2 What Good Process Definition Enables
Clarity and Consistency
Process definition provides a communication mechanism that clarifies complex operations by providing a structured framework that employees can follow. This consistency ensures that tasks are carried out uniformly, reducing the risk of errors and inefficiencies. Unambiguous process documentation is essential for training new process performers and clarifying or reinforcing the sequence of activities and decision routes to existing performers.
Efficiency and Productivity
Process discovery (which will be explored in further detail in Workshops 4 and 6) unearths the true nature of how existing organizational processes behave. This differs from process definition which specifies how the processes are designed or intended to behave. Comparing the discovered process with the defined process (conformance checking) enables organizations to identify bottlenecks, streamline workflows, and allocate resources more efficiently, enhancing productivity and reducing operational costs.
Quality Assurance
Quality by Design is an approach where quality is built into a process from the beginning of the design and implementation phase rather than being tested and inspected afterwards. For example, Poka Yoke, a Japanese term that means “mistake-proofing,” proposes designing activities and user interfaces so that mistakes become impossible or are immediately detected and corrected before becoming defects. Good process definition ensures that these quality prevention measures are properly documented, ensuring that activities are completed to a high standard. It enables organizations to maintain and continuously improve the quality of their products or services.
Compliance and Risk Management
In industries with strict regulatory requirements, well-defined processes facilitate compliance by ensuring that processes adhere to legal standards. Additionally, they aid in risk management by identifying potential vulnerabilities and providing a framework for mitigation. For example, the process documentation might include a requirement for the segregation of duties by process performers to mitigate the risk of employee (or internal) fraud.
2.3 Process Definition Artefacts
Process Models
Process models are a key output from process definition activities. They often create a visual representation of the process, which helps stakeholders grasp the sequence of steps and decision points. They also typically include roles and responsibilities, defining who is responsible for each activity within the process and ensuring clarity and accountability. They also include the triggers, inputs and outputs, identifying the resources and information needed to initiate the process and the expected outcomes or deliverables.
Process models may also specify the enablers utilised in the execution of activities (including IT systems in the scope of the process) and the controls designed to mitigate the risks associated with the process.
The remainder of this manual will be dedicated to understanding the purpose of process modeling, the various types of models and how to create and interpret process models.
Performance Metric
Metrics establish the desired process performance regarding efficiency, effectiveness, and quality, representing another essential process definition deliverable.
Below are some typical process key performance indicators (KPIs) and their definitions:
a. Cycle Time:
Cycle time is the total time taken to complete a process from start to finish. It includes both active working time (touch time) and any waiting time during the process.
b. Touch Time:
Touch time refers to the time spent working on an activity within the overall cycle time. It is the time when the work is actively being done, excluding any idle or wait time, and this time may be spent doing value-added work. i.e. work valued by the customer or non-value-adding work – also referred to as waste.
c. Wait Time:
Wait time is the duration for which activity remains idle or in a queue, waiting for the next step in the process. Minimizing wait time is essential for reducing cycle time.
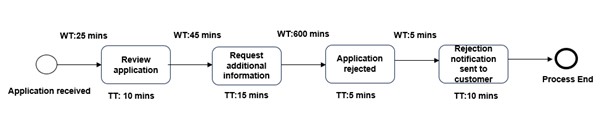
Figure 2.1 – Wait, Touch and Elapsed Time Illustrated
In the example above, the total wait time (WT) is 675 minutes (25 mins + 45 mins + 600 mins + 5 mins). In comparison, the total touch time (TT) is 40 minutes (10 mins + 15 mins + 5 mins + 10 mins), bringing the cycle time to 715 minutes, assuming all the activities were executed sequentially.
d. OTD Rate (On-Time Delivery Rate):
OTD Rate measures the proportion of products or services delivered on time to the customer. It is a crucial indicator of a company’s ability to meet its commitments and is often used to assess supply chain and production efficiency.
e. DPMO (Defects Per Million Opportunities):
DPMO is a metric that calculates the number of defects in a process per million opportunities for a defect to occur. It provides insights into the quality and reliability of a process, with a lower DPMO indicating higher quality.
Dumas et al recommend the following steps for determining the desired performance metrics for a process:
1. Agree on a high-level description of the ideal process’s performance objectives. e.g. for the Credit Card Application-to-Activation process (described in Course Mane.g.,1), applicants should receive a decision within 48 hours of their application receipt. These performance objectives could be determined from customer feedback, e.g., interviews, surveys or focus groups or mandated by regulations.
2. Determine each performance target’s pertinent performance dimension(s) and define the objective’s aggregation function(s). E.g., the proportion of applicants responded to within 48 hours. We can call this RT48. i.e. Response Time within 48 hours
3. Create a more specific goal based on this performance indicator, such as RT48 ≥ 90%.
The process models can be annotated with the defined performance metrics to indicate the desired performance; however, as discussed below, this will depend on the purpose for which the model is intended and the audience for which is produced.
Exercise 2.1
1. Review the list of processes from Exercise 1.1. Which of the metrics discussed above are suitable for assessing their performance?
2.4 Introduction to Process Modeling
The three main attributes of any model are its mapping, abstraction, and purpose. First, a model maps to (or is) a version of reality. Consider a map describing a city’s transport network, e.g., the London Underground (or Tube) map or New York City’s Subway map. These map real-world entities (e.g., stations, rail tracks, etc) onto a two-dimensional form which can be represented on paper or digitally. Similarly, process models map real-world entities (objects, data, people, etc.) into a useful form to define the process. This explains why process models are often called process maps (although a model is much more than a map).
Second, a model simplifies (or abstracts) reality, retaining only the required information. For example, a London Underground map represents the stations as small circles, omitting irrelevant information such as the station’s height, shape, or opening date. The same is true of process models that simplify processes to communicate them.
Finally, a model has a pre-defined purpose, which enables the modeler to decide what information to retain to make the model useful to its intended audience. For example, the London Underground (or Tube) map shows where the various lines intersect, enabling travellers to plan their journey. As described above, process models can be annotated with a myriad of information e.g., wait time, touch time, risk and controls, etc. Knowing the intended audience enables the modeler to retain useful information, preventing information overload. For example, a process model for regulators may highlight the controls in the process (as well as identified control gaps); however, a different model highlighting required roles might be produced for human resources capacity modeling or organizational design purposes.

Figure 2.2 – Snapshot of London Underground Map juxtaposed with real-world station.
2.5 Types of Process Models
i. Process Flowcharts
Process flowcharts are visual representations of a process’s steps and sequences. They use standardized symbols and arrows to illustrate the flow of activities, decision points, and inputs/outputs.
Advantages of Process Flowcharts:
o Simplify complex processes for easy understanding.
o Facilitate communication among team members.
o Highlight decision points and critical paths.
o Serve as valuable documentation for process auditing and improvement.
For the remainder of this course, any references to process models will refer to process flowcharts.
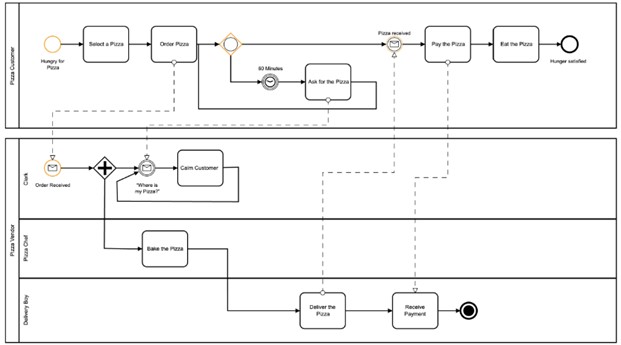
Figure 2.3 – Process flowchart for Pizza Order-to-Cash process
Source: Camunda.com
ii. SIPOC (Suppliers, Inputs, Process, Outputs, Customers)
The SIPOC model is a simple yet powerful tool that helps organizations comprehensively understand a process by breaking it down into five key components: Suppliers, Inputs, Process, Outputs, and Customers. Each element in the SIPOC diagram is carefully examined to identify potential areas for improvement.
Advantages of SIPOC:
o Simple and easy to understand.
o Provides a clear visual representation of the process.
o Helps identify potential areas for improvement.
o Emphasizes customer-centricity.
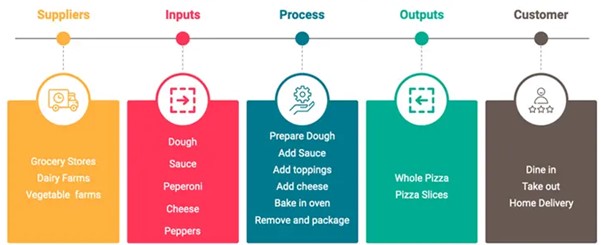
Figure 2.4 – SIPOC for Pizza Order-to-Cash process
Source: Simpliaxis.com
iii. Value Stream Mapping (VSM)
Value Stream Mapping is a process modeling method that analyses the entire value stream within an organization, from customer demand to product or service delivery. It provides a holistic process view, highlighting value-added and non-value-added activities, lead times, and resource utilization.
Key components of VSM:
▪ Value-Added and Non-Value-Added Activities: VSM helps distinguish between activities that directly contribute to value creation and those that do not.
▪ Lead Time Analysis: VSM assesses the time a product or service takes to move through the entire process, helping identify areas for time reduction.
Advantages of VSM:
o Provides a holistic view of the entire value stream.
o Focuses on waste reduction and process efficiency.
o Enables organizations to create a roadmap for process improvement.
o Supports lean and agile principles.
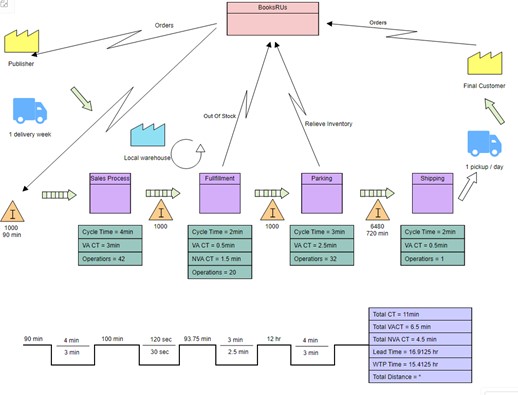
Figure 2.5 – SIPOC for Pizza Order-to-Cash process
Source: online.visual-paradigm.com
2.6 Business Process Model and Notation (BPMN)
Business Process Model and Notation (BPMN) is a standardized graphical representation that enables organizations to model, document, and analyze their business processes. BPMN is vital for business analysts, process engineers, and stakeholders to communicate and collaborate effectively.
The origins of BPMN can be traced back to the early 2000s when businesses realized the need for a unified language to model and communicate their processes effectively. Before BPMN, various notations and diagramming techniques were in use, making it challenging for organizations to consistently share and understand process models.
BPMN was conceived as a standard by the Business Process Management Initiative (BPMI) to address this issue, which later merged with the Object Management Group (OMG). The primary goal was to develop a notation that technical and non-technical stakeholders would easily understand. BPMN aimed to bridge the gap between business processes and IT systems, allowing organizations to align their operations more efficiently with their strategic objectives.
2.7 Key Symbols in BPMN
BPMN employs a set of standardized symbols and elements that represent various aspects of a business process. Understanding these symbols is essential for creating and interpreting BPMN diagrams effectively. Here are some of the key symbols commonly used in BPMN:

i. Start Event: Represented by a circle, this symbol marks the beginning of a process flow. It signifies the initiation of a specific business process.

ii. End Event: Similar to the Start Event, the End Event is represented by a circle but with a bold border. It indicates the conclusion or termination of a process.
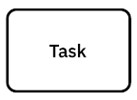
iii. Task: Depicted as a rectangle with rounded corners, a Task represents a specific action or activity that needs to be performed as part of the process.

iv. Gateway: Gateways, represented as diamond shapes, are used to control the flow of a process. They define branching and merging (or decision) points within a process. Various types of gateways exist as follows:
a. Exclusive Gateway: Represented by an XOR gateway, it indicates an exclusive decision point where only one of the outgoing paths is chosen based on specific conditions.

b. Parallel Gateway: The Parallel Gateway, represented by a plus (+) sign inside a diamond, signifies that multiple tasks can occur concurrently.

c. Event-Based Gateway: This specialized gateway handles events that may interrupt or trigger a process flow.

v. Sequence Flow: These arrows connect various elements in a BPMN diagram, indicating the order in which tasks or events occur.

vi. Message Flow: Message Flows, depicted as dashed lines with a circle at one end, show communication between different pools or lanes in a BPMN diagram.

vii. Data Object: Represented as a rectangle with a folded corner, Data Objects illustrate data or information required or generated during a process.
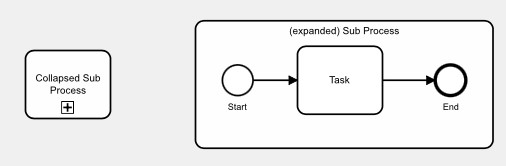
viii. Sub-Process: Sub-Processes are used to represent a sub-process within the main process. They are drawn as rectangles with a bold border.

ix. Timer Event: A Timer Event symbolizes a time-based trigger, such as a delay or deadline within a process.
x. Swimlanes
In addition to symbols, BPMN utilizes swimlanes to further enhance the clarity and organization of process diagrams. Swimlanes are horizontal or vertical divisions within a diagram that categorize activities or tasks based on the responsible entity or role. They help assign accountability and clarify the flow of work within a process. Swimlanes can be used to represent various dimensions, such as departments, teams, or external entities.
There are two main types of swimlanes in BPMN:
a. Pools: Pools represent separate participants or organizations involved in a process. They are typically used to distinguish between different entities within a complex business process. Each pool can contain its own set of elements, making it clear which tasks belong to which participant.
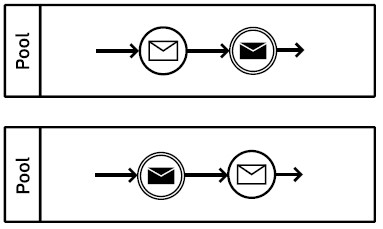
b. Lanes: Lanes, on the other hand, represent subdivisions within a pool. They are used to group tasks or activities performed by specific roles, departments, or teams within the same participant or organization. Lanes help in depicting the responsibilities and interactions between different units within a single pool.
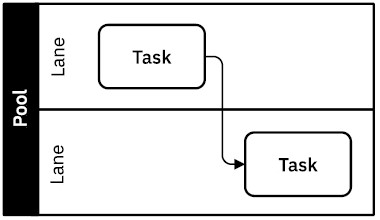
Swimlanes simplify the representation of complex processes by providing a visual hierarchy that shows how tasks and responsibilities are distributed among participants or teams.
Case Study
MBA Application-to-Enrolment Process, University of North Alabama
Problem
The University of North Alabama’s MBA programme enrolment had been steadily declining yearly because of various factors, including cost and the anxiety of leaving a highly competitive employment market to pursue further education.
The university has severe concerns about this because MBA programmes are a significant source of income for its business college.
Process Modeling Activities
To better understand the As-Is (or current state) process, the team produces a process model annotated with relevant data about the process,
This revealed the presence of a ‘hockey stick pattern’ in the process (i.e. the majority of registrations for each semester took place during the final week of enrolment), resulting in a great deal of confusion at the start of each semester as students raced to finish before the deadline.
Many prospective students could not complete the required activities before the deadline, resulting in many incomplete enrolments.
The team used Value Stream Mapping to design the To-Be (or future state) process. The objective of this exercise included, among others:
● Ensuring that all activities undertaken in the process added value to prospective students.
● Eliminate duplication of activities.
● Remove disguised friction from the process.
● Facilitate and encourages information sharing between departments rather than establishing silos.
● Achieve staff buy-in for the methodology’s adoption for this project and any follow-up initiatives,
Implementing the ‘To-Be’ process resulted in changes that prompted potential students to enrol early. Cross-training was introduced to reduce team tension and boost student satisfaction by removing the need to wait for a person-dependent reaction.
Better forecasting and planning started to be possible because of pipeline analysis. Transparency in the process enabled opportunities for future continuous improvement initiatives.
Results
The team met the project’s objectives, increasing MBA programme enrolment by 70% and attaining a 97% recruitment satisfaction rate among registrants.
An RIE, or Rapid Improvement Event, helped the team increase the effectiveness of its project by bringing in new perspectives, identifying further improvement action items, and putting control measures in place for the improvements that had already been accomplished.
Source: isixsigma.com
Exercise 2.2
i. Create a process model using BPMN to define one of the processes identified in Exercise 1.1
ii. Review the process model in Figure 2.6 below and answer the following questions:
a) How many payment options are accepted? List these.
b) Which task(s) are executed for credit card payments?
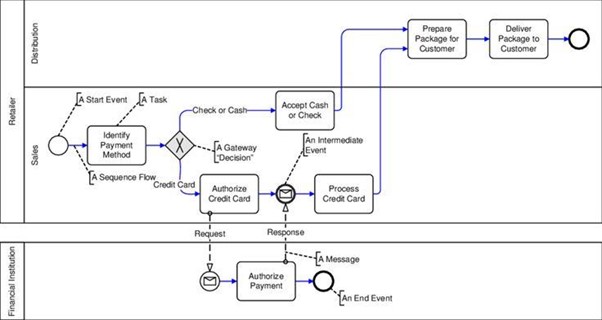
Figure 2.6 – Sale-to-Delivery Process Model

Course Manual 3: Process Excellence
3.1 Process Outcomes
A process outcome refers to the final result or achievement a process intends to produce. It represents the overarching goal or purpose of the process, which typically aligns with the desired outcome or value that an organization or system aims to deliver. Outcomes can be negative or positive; positive outcomes provide value to customers, while negative outcomes erode value.
On the other hand, process outputs are specific, tangible, physical or virtual products generated by executing the activities within a process. These outputs contribute to the overall process outcome.
For example, the Credit Check Request-to-Report sub-process is executed when the credit card provider requests a credit check on an applicant from a credit agency. Ideally, an outcome should provide value to the parties involved, who in this case are the credit card provider and the credit agency. In certain circumstances, this value is not met or is only partially met. For example, neither party receives benefits when a credit check cannot be completed due to missing input data (and has to be reworked), resulting in a negative outcome instead of a positive one that benefits the actors involved.
Process excellence refers to the state where processes consistently deliver positive outcomes to customers.
3.2 Process Performance Dimensions
Process performance is typically measured along four dimensions as described below:
i. Quality
The quality of a process output indicates whether or not the customer’s specifications were met.
Let’s revisit the illustrative process from Course Manual 1, which produces a cup of tea as the output. Consider a request by a colleague (who is a strict, ethical vegan) for a cup of tea. If the output contains dairy products (e.g., cow milk), it will be considered defective as it failed to meet the customer’s (your colleague) specification and will most likely be rejected.
To further illustrate using the Credit Card Request-to-Activation process, consider the case where the applicant receives a defective credit card. While the process has produced an output for the applicant, it is not valued by the applicant as it is faulty, resulting in a negative outcome.
Both examples above highlight the difference between outputs and outcomes, emphasizing that the output must meet the customer’s requirement to ensure positive outcomes.
DPMO (Defects Per Million Opportunities) is a typical quality measure (as discussed in Course Manual 2), calculated using the formula below:
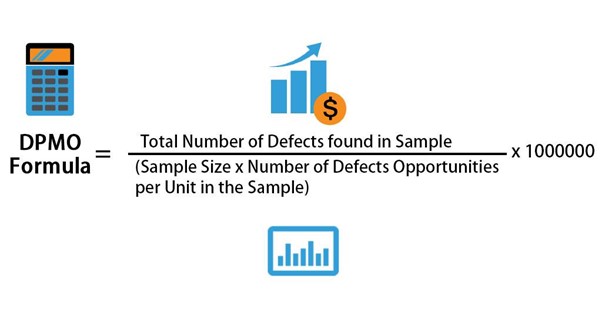
Figure 3.1 – DPMO Formula
Source: educba.com
ii. Time
The time dimension can be divided into two sub-dimensions. The first is On-Time Delivery. The process output is considered delivered on time if it is produced to specification by an agreed deadline. Consider an event manager who must ensure that the specified food items are delivered to conference participants by 12:30 p.m. (when the break starts). However, the caterers deliver the items by 1 p.m. Whilst the output has been delivered (and the food might be delicious), it represents a negative outcome because it failed to meet the agreed delivery deadline.
On-Time Delivery is typically measured by the OTD Rate (On-Time Delivery Rate; introduced in in Course Manual 2)

The second dimension of time is excessive cycle time, where it takes too long to deliver the process output from the customer’s perspective. This differs from On-Time Delivery in that a deadline is absent; however, the customer has clear expectations regarding how long they expect the process to take. Consider the Mortgage Application-to-Approval process. This process typically takes 2-8 weeks in the United Kingdom, depending on financial complexity, property valuation, etc. If a customer waits six months for the process to complete, they will likely view the process outcome as negative, even if the mortgage is eventually approved.
iii. Cost
Cost is another critical process performance dimension that is not typically transparent to the customer. Process costs include the cost of inputs, labor, and purchasing and maintaining enablers (e.g., IT systems). Labor costs typically make up a sizeable portion of operating costs. Factors such as an increase in the cost of inputs or high defect rates (resulting in higher labor costs because of rework) will likely increase the cost of producing outputs. In certain instances, the organization may choose not to pass on this cost to customers, likely resulting in lower operating margins.
A typical measure of process cost is Cost Per Unit (or Unit Cost), calculated by dividing the total cost of the process by the number of units produced.
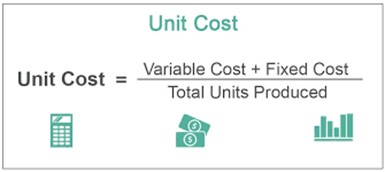
Figure 3.2 – Unit Cost Formula
Source: wallstreetmojo.com
iv. Flexibility
The final performance dimension (often the least utilised) is the process’s flexibility, which describes its resilience, i.e., its ability to adapt and effectively respond to changes such as a spike in demand or reduction in the number of process performers. For example, the Credit Card Request-to-Activation process might receive an average of 100 applications daily and respond to 92% within the desired 48-hour window. However, following an advertising campaign, it gets an average of 250 applications daily (over two weeks), resulting in a drop to 50% of applicants receiving a response within 48 hours. In that case, the process flexibility might be deemed to be unsatisfactory.

Exercise 3.1
1. Write down one or two processes from your personal or professional experience which have had a significant negative outcome.
2. On which of the four dimensions did the process fail?
3. What impact did the outcome have on you or others? Include the financial cost, time lost, psychological implications, etc.
3.3 Impact of Negative Process Outcomes on Stakeholders
Due to the interconnected nature of the world around us, the impact of consistently negative process outcomes can be far-reaching, affecting not only customers and employees but also shareholders, regulators, and society. To make informed decisions and guide their process excellence journey, organizations need to quantitatively assess the consequences of these outcomes on each stakeholder group. Below, we explore how to evaluate quantitatively the impact of adverse process outcomes on customers, employees, stakeholders, regulators, and society.
i. Impact on Customers
Customers are arguably the most directly affected by business process failures. Customers will typically share their experiences of negative outcomes with family, friends, and neighbours – information which has strong validity and is likely to discourage them from adopting an organization’s products and services. Customer impact will be explored further in Course Manual 5.

A quantitative assessment of the impact on customers should consider:
a. Financial Costs: Calculate the monetary losses customers incur, such as refunds, additional expenses, or lost opportunities.
b. Customer Satisfaction: Conduct surveys or analyze customer feedback to gauge changes in satisfaction levels, net promoter scores, and customer retention rates.
c. Downtime or Delays: Measure the time customers spend waiting for resolution, which can be converted into monetary terms using the concept of the cost of time.
d. Reputation and Loyalty: Quantify the impact on brand reputation and customer loyalty, which can affect long-term revenue.
ii. Impact on Employees
Business process failures can lead to stress, frustration, and increased employee workloads. Course Manual 6 delves into employee impact in additional detail.

Quantitative assessment in this context may involve:
a. Employee Surveys: Use surveys to measure changes in job satisfaction, stress levels, and burnout rates among employees.
b. Productivity Metrics: Analyze productivity data, including output, project completion times, and absenteeism rates, to identify deviations caused by process failures.
c. Attrition Rates: Calculate the cost of employee attrition, including recruitment and training costs, which may increase due to dissatisfaction from process failures.
iii. Regulatory Impact
Regulators play a crucial role in ensuring compliance and upholding industry standards. Regulatory impact is examined in further detail in Course Manual 7.

Quantitative assessment considerations for regulators include:
a. Fines and Penalties: Calculate regulatory fines and penalties incurred due to process failures.
b. Compliance Costs: Measure the cost of bringing processes back into compliance with regulatory requirements.
c. Regulatory Investigations: Quantify the costs of regulatory investigations, including legal fees and staff time.
iv. Impact on Society
Business process failures can have broader societal impacts, including environmental, social, and economic consequences. Course Manual 9 addresses the effects of negative process outcomes on society.

Quantitative assessments may involve:
a. Environmental Impact: Calculate the ecological damage or pollution resulting from process failures and estimate the remediation cost.
b. Public Health and Safety: Assess the impact on public health and safety, including medical expenses, property damage, and potential lawsuits.
c. Economic Effects: Examine the impact on the local or national economy, including job losses, decreased tax revenue, and increased social welfare costs.
v. Impact on Other Stakeholders
As used in this context, other stakeholders encompass various individuals and entities not addressed above, including shareholders, partners, suppliers, and creditors. Shareholder impact will be explored further in Course Manual 8.

Quantitative assessments may include:
a. Shareholder Value: Evaluate stock price fluctuations and dividend changes to quantify the impact on shareholders’ investments.
b. Supplier Relationships: Analyze supply chain disruptions, late deliveries, and costs associated with sourcing alternatives.
c. Contractual Obligations: Calculate any financial penalties or legal liabilities arising from contract breaches or failures to meet obligations.
It is worth noting that the impact of these negative outcomes may compound. For example, an increase in customer complaints may lead regulators to impose a more onerous supervisory regime on the organization, which might put the organisation at a disadvantage to competitors.
Attributing the negative outcome to a distinct process may also be problematic. Revisiting the Mortgage Application-to-Approval process, if the applicant complains due to the excessive cycle time and the output from the Mortgage Complaint-to-Resolution process is unsatisfactory, resulting in significant compensation costs, which process should this negative outcome be attributed to? The initial process? The final process? Both processes? If the latter, in what proportion?
The points above illustrate some of the challenges of quantitatively assessing the impact of business process failures on customers, employees, stakeholders, regulators, and society. However, despite these challenges, it is an essential activity. By systematically measuring financial, operational, and reputational consequences, organizations can better understand the full extent of the damage caused by process failures and take proactive steps to mitigate risks, enhance resilience, and protect the interests of all stakeholders.
Quantifying the impact of negative process outcomes will be revisited in Workshop 3 (where we consider Enterprise Process Modeling and select the processes most in need of optimization) and Workshop 7 (where we diagnose the root causes of sub-optimal process performance)
Case Study
Patient Admission-to-Exit Process, Baylor St. Lukes Medical Center, Houston
Problem
Following a year-long investigation by journalists, two government agencies (the Centers for Medicare and Medicaid Services) released a damning report that catalogued a series of failing in patient care, some of which directly resulted in patient deaths.
In addition to the preventable loss of lives, the hospital’s funding for heart transplants was cut as it was deemed not to have taken sufficient remedial action to stem the high rate of patient deaths, potentially resulting in a degree of financial hardship for the hospital.
Process Failure and Consequences
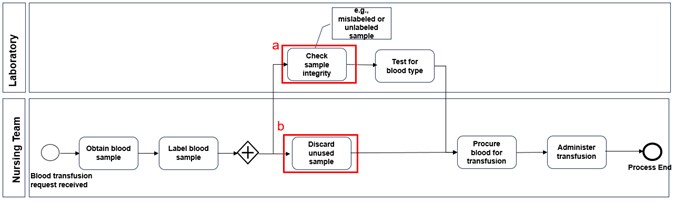
Figure 3.3 – Recommended Blood Transfusion Request-to-Transfusion Administration Process
The process model above describes the recommended sub-process to be followed when a patient is deemed to require a blood transfusion.
However, the internal definition of this process at the hospital (especially the lack of a complete definition for the ‘Check sample integrity’ activity – Figure 3.3) resulted in an adverse medical event as follows:
A 75-year-old woman was rushed to the hospital and deemed to require a blood transfusion.
However, the Emergency Room (ER) team had neglected to discard the blood sample from the previous patient who had occupied the emergency room and mistakenly placed the new label over the old one (see Figure 3.3 (b)). The laboratory staff should have picked up this double-labeling error. However, as the process did not specify that samples with multiple labels should be rejected (see Figure 3.3 (a)), the woman was transfused with the wrong blood type. Sadly, the woman suffered complications, including four cardiac arrests and died the following day.
In total, 122 incidents were identified over a four-month period where blood-labeling errors were made, with varying degrees of consequences.
The hospital subsequently dismissed its CEO and three other top executives. It also made several new hires to guide it on its “journey back to excellence”.
However, several of the consequences of the negative process outcome (e.g., patient deaths) are irreversible.
Exercise 3.2
1. Collectively select a business process from your organization with the potential for optimization.
2. Each of the five groups should:
i) Write down the impact on one of the stakeholder groups: customers, employees, stakeholders, regulators, and society and
ii) Quantify the impact as best as possible.

Course Manual 4: Opportunity Enablers
4.1 Introduction
Business opportunities manifest in various forms and are characterized by ubiquity, persistence during economic hardship, and time-bound qualities. In this course manual, we will explore the diverse nature of business opportunities, highlighting their enduring presence, adaptability, temporal dimension, and how process excellence enables an organization to capitalize on these opportunities.
4.2 Nature of Opportunities
Ubiquity
Opportunities are ubiquitous; in other words, they are all around us. They are not confined to specific industries, regions, or economic conditions. Opportunities can arise in various forms and at anytime, offering entrepreneurs the chance to create value and drive innovation. Strategic analysis tools such as SWOT (Strength-Weaknesses-Opportunities-Threats; see Figure 4.1) and PEST (People-Environment-Social-Technology) analysis can assist in unearthing some of these opportunities.

Figure 4.1 – How to Perform a SWOT Analysis
Source: semrush.com
a. Technological Advances: Advances in technology have led to a perpetual stream of opportunities. For example, the rise of the internet birthed countless digital businesses, from e-commerce giants like Amazon to app-based startups like Uber.
b. Changing Consumer Preferences: New niches and markets emerge as consumer preferences evolve. Trends such as health and wellness, sustainability, and convenience have created opportunities for businesses to cater to shifting demands.
c. Globalization: Increased globalization has opened doors to international markets and collaborations, allowing businesses to expand beyond their borders.
Persistence
Business opportunities do not vanish during economic downturns or hardships. Economic or societal shocks often create opportunities. For example, the Covid pandemic created opportunities for vaccine manufacturers and Personal Protective Equipment (PPE) suppliers. Below are some other factors contributing to the persistence of opportunities

a. Niche Markets: Economic downturns can lead to cost-cutting measures and increased price sensitivity among consumers, creating opportunities for businesses that cater to niche markets with unique value propositions or cost-effective solutions.
b. Innovation and Efficiency: During economic hardships, businesses may seek ways to improve efficiency, reduce waste, or find innovative solutions to survive, opening doors for companies specializing in process optimization, cost reduction, and innovation consulting.
c. Digital Transformation: The COVID-19 pandemic highlighted the importance of digitalization, accelerating the need for businesses to adapt to remote work, e-commerce, and online services, generating opportunities for technology providers and digital transformation consultants.
Time-Bound
While opportunities may seem perpetual and ubiquitous, they often have a temporal dimension. The time when an opportunity is recognized and seized can significantly impact its success. For example, the end of COVID restrictions significantly reduced the demand for face masks, effectively limiting supplier opportunities. Other temporal factors influencing opportunities include the following:

a. First-Mover Advantage: Being the first to identify and capitalize on an emerging trend or market can provide a significant advantage. Early entrants often establish market dominance and brand recognition.
b. Seasonal Opportunities: Some opportunities are time-bound by nature, such as those related to seasonal events or holidays. Businesses like gift shops or holiday-themed services thrive during specific times of the year.
c. Lifecycle of Technologies: The lifecycle of technologies can create time-bound opportunities. For instance, as older technologies become obsolete, there are opportunities for companies to offer upgrades, replacements, or alternatives.
Exercise 4.1:
b. Reflect on recent systemic shocks such as the COVID-19 pandemic and the recent cost of living crisis. Identify and list any opportunities they present for your organization.
4.3 What is Required to Seize Opportunities
In the previous section, we established that opportunities persist even during economic hardship and are time-bound and ubiquitous. However, to take advantage of these, organizations must be prepared to identify and capitalize on opportunities that align with their strategic goals. To harness these opportunities effectively, an organization requires a combination of competence, resources, and the ability to overcome barriers to entry. Below, we explore these critical elements and their significance in enabling organizations to take advantage of opportunities.
i. Competence and Expertise
Competencies (or organizational capabilities) are the foundation upon which an organization can effectively seize opportunities. It encompasses a range of essential skills and capabilities, including:

a. Market Knowledge: Understanding market dynamics, trends, and consumer behavior is crucial for recognizing emerging opportunities. In-depth market research and analysis provide valuable insights.
b. Technological Proficiency: In today’s digital age, organizations must possess the technical skills to leverage emerging technologies and digital platforms.
c. Strategic Vision: Leadership with a clear strategic vision can identify opportunities that align with the organization’s long-term goals and competitive advantage.
d. Adaptability: The ability to adapt to changing circumstances and pivot when necessary is essential for staying agile and seizing unexpected opportunities.
Resource Allocation and Management
Resources, both human and financial, are fundamental for pursuing and capitalizing on opportunities:
a. Financial Resources: Adequate capital is essential for investments in research, development, marketing, and infrastructure required to pursue opportunities.
b. Human Capital: A skilled and motivated workforce is crucial. Employees with diverse skills and expertise can drive innovation and execute strategies effectively.

c. Technology and Infrastructure: Organizations must have the necessary technological infrastructure to support their operations and capitalize on digital opportunities.
d. Supply Chain and Logistics: Efficient supply chain management ensures timely delivery and enhances competitiveness in seizing opportunities.
Overcome Barriers to Entry
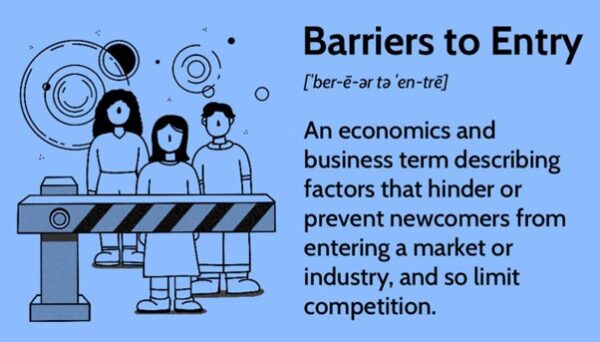
Source: Investopedia.com
Overcoming barriers to entry is often a pivotal challenge when seizing opportunities. Barriers may arise due to:
a. Regulatory Compliance: Organizations must navigate and comply with industry-specific regulations, which can vary significantly from one market to another.
b. Competitive Landscape: Analyzing and understanding competitors’ strengths and weaknesses is essential for gaining a competitive edge.
c. Intellectual Property Protection: Protecting intellectual property, trademarks, and patents is crucial to safeguard innovations and maintain a competitive position.
d. Market Entry Strategies: Effective market entry strategies, such as partnerships, alliances, or mergers and acquisitions, can help overcome barriers and gain a foothold in new markets.
Risk Management and Adaptability
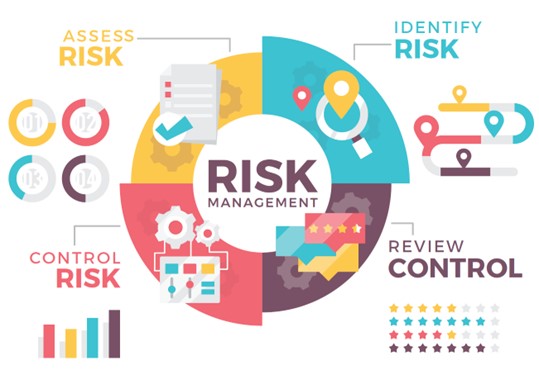
Opportunity pursuit involves inherent risks, and organizations must be prepared to manage them by:
a. Risk Assessment: Conduct thorough risk assessments to proactively understand and mitigate potential challenges associated with opportunities.
b. Flexibility and Adaptability: An adaptable organizational culture and structure allow quick responses to unforeseen obstacles.
c. Scenario Planning: Develop contingency plans and alternative strategies to navigate potential setbacks.
To take full advantage of opportunities, organizations require a multifaceted approach that combines competence, resource allocation, and the ability to overcome barriers to entry. Competence enables organizations to identify opportunities aligned with their strengths, while resources provide the means to pursue these opportunities effectively. Overcoming barriers to entry ensures a competitive advantage in new markets or industries. Risk management and adaptability are also essential to navigate the challenges that inevitably arise during opportunity pursuit.
Ultimately, an organization’s ability to seize opportunities is a dynamic process that relies on continuous learning, innovation, and strategic decision-making. By cultivating a culture of agility, resilience, and forward-thinking, organizations can position themselves to recognise opportunities and capitalize on them successfully, driving sustainable growth and competitive advantage in an ever-evolving business landscape.
Exercise 4.2:
4.4 Process Excellence as an Opportunity Enabler
Process excellence plays a pivotal role in an organization’s ability to identify, pursue, and capitalize on opportunities, acting as a catalyst for enhancing organizational capabilities and overall agility. Below, we will explore how process excellence empowers organizations to take advantage of opportunities, particularly in the areas of effective personnel hiring, skill development, and rapid technology adoption.
i. Effective Personnel Hiring
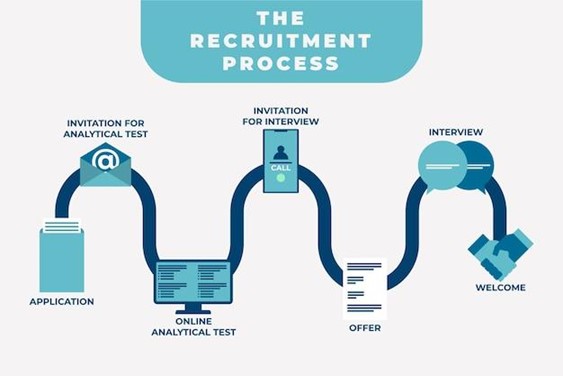
Figure 4.2 – Typical Job Application-To-Hire Process
As discussed above, employee skills and knowledge are critical to developing and maintaining organizational capability. Process excellence significantly contributes to identifying, attracting and recruiting individuals with the required skills to capitalize on an opportunity in the following ways:
a. Streamlined Recruitment Processes: Implementing efficient and standardized recruitment processes, such as clear job descriptions, automated applicant tracking systems, and well-defined interview protocols, enables organizations to identify and onboard talent more rapidly.
b. Data-Driven Decision-Making: Utilizing data analytics in the hiring process helps organizations assess candidates objectively and make informed decisions based on skills, cultural fit, and potential contributions.
c. Enhanced Candidate Experience: Process excellence ensures a positive candidate experience, attracting top talent and fostering a favorable employer brand.
d. Reduced Time-to-Hire: Process excellence reduces the time required to fill critical positions by eliminating bottlenecks and redundant tasks, enabling organizations to respond swiftly to market demands and opportunities.
ii. Skill Development and In-House Talent

In-house skill development is essential for an organization’s long-term competitiveness and adaptability. Process excellence facilitates this development in several ways:
a. Training and Development Frameworks: Organizations with well-defined training and development processes can systematically identify skill gaps, design relevant programs, and upskill their employees to meet evolving industry requirements.
b. Performance Management: Process excellence contributes to effective performance management systems that align individual goals with organizational objectives, fostering continuous skill development and improvement.
c. Cross-functional collaboration: Efficient processes encourage collaboration across departments, allowing employees to learn from each other and develop a broader skill set that supports innovation and adaptability.
d. Succession Planning: Process excellence aids in identifying high-potential employees and grooming them for leadership positions, ensuring a pipeline of skilled talent to drive future growth opportunities.
iii. Rapid Technology Adoption

The ability to embrace and integrate new technologies quickly is a hallmark of agile organizations. Process excellence facilitates this by:
a. Technology Assessment: Efficient processes enable organizations to assess emerging technologies, evaluate their potential impact, and make informed decisions about adoption.
b. Change Management: Well-structured change management processes ensure employees embrace new technologies with minimal disruption and resistance, expediting the integration process.
c. Continuous Improvement: Process excellence promotes a culture of continuous improvement, allowing organizations to refine their technology adoption strategies based on lessons learned and changing market dynamics.
d. Data Utilization: Effective data management processes enable organizations to harness the power of data analytics, which can guide technology adoption decisions and enhance competitiveness.
iv. Satisfying Unmet Customer Needs
Process excellence enables organizations to identify and satisfy unmet customer needs by:
a. Fostering Innovation: By juxtaposing customer requirements against available products or service provisions, organizations often uncover unmet customer needs, leading to the development of new products, services, or delivery methodologies that can better serve customer needs.
b. Improving Customer Service: At the heart of process excellence lies an enhanced customer experience. Businesses can improve customer satisfaction by ensuring timely deliveries, consistent product quality, and swift resolution.
v. Optimizing Supply Chain
Process excellence in supply chain management can be a potent tool for enabling opportunities by:
a. Realizing Cost Efficiencies: Organizations can significantly reduce supply chain costs associated with inventory holding, warehousing, transportation, and production. By employing lean methodologies and just-in-time delivery, businesses can reduce wastage, minimize stockouts, and lower carrying costs, enabling the organization to capitalize on opportunities.
b. Enhancing Agility and Responsiveness: Process excellence equips the supply chain to respond promptly to external changes, including sudden demand spikes or unexpected supply interruptions. Tools like demand forecasting and flexible sourcing strategies ensure that organizations can quickly adapt to the market’s ever-changing dynamics.
In conclusion, process excellence is a linchpin for organizations striving to seize opportunities and stay competitive in today’s rapidly evolving business landscape. By optimizing personnel hiring processes, fostering in-house skill development, and facilitating rapid technology adoption, among others, organizations can position themselves to respond effectively to emerging opportunities.
As we shall establish in subsequent courses, process excellence is not a one-time effort but an ongoing commitment to continuous improvement and adaptation. Organizations that embed process excellence into their culture and operations create a dynamic foundation for success, enabling them to identify, pursue, and capitalize on opportunities for growth, innovation, and sustained excellence in their respective industries.
Case Study
German Vaccine Production-to-Delivery Process
The Problem
COVID-19 vaccine distribution has several requirements, like temperature control and refrigeration, which necessitate continual monitoring to prevent quality flaws. There are severe consequences for wastage (e.g., increased mortality rates), hence the need to minimize wastage.
As multiple stakeholders are involved in the process (e.g., vaccine manufacturers, government departments, charitable organizations, etc), information was dispersed across various organizations, making planning capacity challenging.
As new data about the impact of the coronavirus on different groups of people (e.g., older or pregnant people, those with an underlying health condition, etc.), there was constant re-prioritization to ensure that those who most needed the vaccine received it promptly. However, this increased the complexity of the process.
The Opportunity Enabled
A team built and tested a digital map for the end-to-end process using sample data from various locations throughout the supply chain. This solution provided:
o Transparency throughout the process, from production to vaccination, made it possible to identify gaps and improve the execution of the vaccination programme.
o All parties participating in the process, from the manufacturers to the immunisation facilities and the public, were connected to highlight dependencies and to enable congestion in the process to be spotted early.
o A global view of the process and the ability to drill into specific, local-level information. These enabled local administrators to locate and resolve any local problems the process may be experiencing.

Figure 5.3 – German Vaccine Production-to-Delivery Process Dashboard
Exercise 4.3:

Course Manual 5: Customer Experience
5.1 Introduction
Customer experience is a pivotal element that can enable or impair organizational success. As discussed in the previous course manual, factors such as technological advancement and more sophisticated customer requirements have reduced barriers to entry for competitors and reduced switching costs, making it easier for dissatisfied customers to switch to alternative products and services which better serve their needs.
Customer experience (often abbreviated as CX) is the sum total of all customer interactions and touchpoints with a brand or organization throughout their journey, from initial awareness to post-purchase support. It is a holistic concept that considers the quality of products or services and the emotional, psychological, and sensory aspects of the customer’s interaction with the brand. CX is the customer’s brand perception, formed through every engagement, whether online, in-person, or through various communication channels.
CX is intrinsically linked to organizational success as it influences customer perceptions, loyalty, and overall satisfaction. In the remainder of this course, we will examine what customers value in their experiences, an analytical tool that facilitates a better understanding of customer needs, how CX can be measured and the relationship between process excellence and CX.
5.2 What Customers Value
To consistently deliver exceptional customer experiences, organizations must thoroughly grasp what their customers value. Though these may vary depending on customer segmentation, nature of the product or service and change over time, these values can be broadly categorized into the following:
i. Quality: Customers inherently expect the products or services they receive to meet or exceed their expectations. Quality is the foundation of a positive CX and should never be compromised.
ii. Personalization: Customers appreciate tailored experiences demonstrating an organization’s understanding of their preferences and needs. Personalization can range from personalized recommendations to customized communication.
iii. Convenience: In our fast-paced world, convenience is a significant factor. Customers value easy navigation, quick service, and seamless transactions that save them time and effort.
iv. Trust and Transparency: Building trust is vital for establishing long-term relationships. Customers value organizations that are transparent, honest, and proactive in addressing their concerns.
v. Emotional Connection: A strong emotional connection can foster customer loyalty. Organizations that evoke positive emotions and engage customers personally tend to be more successful.
vi. Consistency: Customers expect consistent experiences across all touchpoints. Inconsistencies can erode trust and lead to dissatisfaction.
vii. Accessibility and Support: Customers value accessible customer support and assistance when needed. Timely and practical support can turn a negative experience into a positive one.
5.3 Kano Analysis and CX
Kano analysis is a valuable analytical tool for understanding customer preferences and prioritizing efforts to deliver an exceptional CX. Developed by Professor Noriaki Kano, this analysis categorizes customer needs into five categories:
i. Basic (or ‘Must-Be’) Needs: These are the fundamental requirements that customers expect. Meeting these needs is essential for customer satisfaction but does not necessarily lead to delight. Consider, for example, a customer who purchases a new car. If the car engine starts when the ignition switch is turned, the customer is unlikely to be delighted as this is a minimal expectation. However, they are unlikely to be very dissatisfied if the engine fails to start. Reviewing Figure 5.1, we observe that optimizing ‘Must-Be’ requirements does not improve customer satisfaction.
ii. Performance (or One-Dimensional) Needs: These needs represent what customers desire, and the better the organization delivers this, the more satisfied the customer becomes. Meeting or exceeding these expectations can lead to higher satisfaction and loyalty. In the example above, fuel efficiency is a performance need – in general, the more miles-per-gallon (mpg) the car delivers, the more satisfied customers are. Figure 5.1 shows that delivery of performance (also known as “one-dimensional”) requirements is directly proportional to customer satisfaction.
iii. Excitement (or Attractive) Needs: Also known as “delighters” or “wow factors,” these are unexpected features or experiences that can surprise and delight customers, going beyond their explicit desires. For example, the car dealership might include an extended warranty (at no additional cost) with the purchase of the car, which is likely to delight the customer. Examining Figure 5.1 reveals that, as a general rule, the more excitement (also referred to as “attractive”) requirements the organization delivers, the more satisfied the customer becomes.
iv. Indifferent Needs: These aspects neither significantly contribute to satisfaction nor detract from it. They are often related to elements that customers do not particularly care about. For the above example, car features, such as social media messaging integration or gesture recognition, may not be utilized by the customer and do not adversely impact any features the customer cares about.
v. Reverse Needs: These are aspects that, when present, can lead to dissatisfaction, but their absence may not necessarily result in satisfaction. Addressing these needs is crucial to prevent negative experiences. To extend the example above, if the indifferent features adversely impact those features the customers care about (e.g., if the social media features clutter the display menu, making it challenging to find navigation features), these indifferent features will likely become reverse features. Figure 5.1 indicates that the presence of reverse requirements is inversely proportional to customer satisfaction.i.e., the more reverse features there are, the less satisfied the customer is and vice versa.
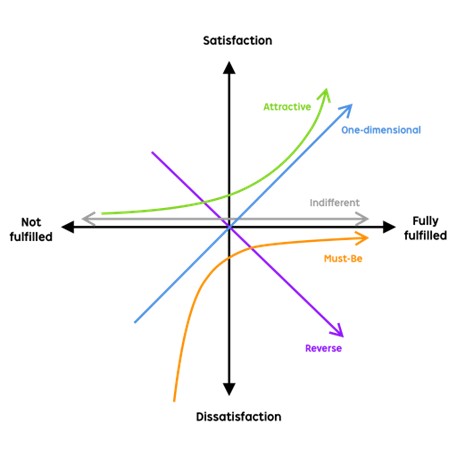
Figure 5.1 – Kano Analysis
Source: mindmesh.com
Below is a brief outline of how to complete a Kano Analysis from a process excellence perspective:
i. Identify Potential Features or Requirements
Start by listing all the Critical-to-Quality (CTQ) features or requirements and translate these into performance metrics. For example, for the Credit Card Application-to-Activation process, the CTQ for rapid response times might translate into the following metric: “Applicants should receive a decision within 48 hours of their application receipt”. These performance metrics (e.g. Response Time) could be obtained from current or proposed SLAs, industry benchmarks, etc.
ii. Design the Kano Questionnaire
For each feature, create a pair of questions: one to measure the functional form (how the customer feels if the performance standard is met) and one to measure the dysfunctional form (how the customer feels if the performance standard is not met).
For example:
Functional: How would you feel if you received a response to your credit card application within 48 hours?
Dysfunctional: How would you feel if you did not receive a response to your credit card application within 48 hours?
The usual answers provided for respondents are:
o I like it that way.
o It must be that way.
o I am neutral.
o I can live with it that way.
o I dislike it that way.
iii. Conduct the Survey
Distribute the questionnaire among a representative sample of your target customers or users. The sample size should be large enough to capture a variety of perspectives. If data exists, stratifying customers into segments is recommended such that the analysis is performed on a homogenous customer segment to prevent dilution of requirements. For example, a customer segment may prioritize speed, while others may value accuracy.
iv. Analyze the Results
Each customer can be classified into one of the categories below based on their response to the questions above as follows :
o Basic Needs: “It must be that way”.
o Performance Needs: “I can live with it that way”.
o Delighters: “I like it that way”.
o Indifferent: “I am neutral”.
o Reverse: “I dislike it that way”.
For example, if most customers respond, “It must be that way”, to the question, “How would you feel if you received a response to your credit card application within 48 hours?” this represents a basic need.
v. Prioritize Features
Based on the categorization, prioritize the requirements. Basic Needs should always be met as they form the foundation of customer satisfaction. Performance Needs should be optimized based on resources and competition. Delighters can be incorporated to differentiate the product in the market.
vi. Iterate and Validate
As markets, technologies, and customer preferences change over time, it’s crucial to periodically revisit the Kano Analysis to ensure alignment with current customer desires.
In conclusion, by applying Kano analysis, businesses can identify which aspects fall into each customer category, permitting them to prioritize efforts on delivering basic, performance, and excitement needs while minimizing or eliminating the reverse needs. The ultimate goal is to create a memorable CX that meets expectations while surprising and delighting customers.
Exercise 5.1:
(Note: nominate some participants to stand in as proxies for customers. Preferably, nominate participants who have used the product or service as customers or who regularly interact with customers).
5.4 Measuring Customer Experience
Measuring the customer experience in a structured manner allows organizations to gain insights into customer satisfaction and loyalty and identify opportunities for improvement. Below, we will explore how to measure customer experience effectively and provide examples of what happens when CX initiatives succeed and fail.
Measuring CX is a multi-faceted process that involves both quantitative and qualitative methods. Below are some of the common approaches used to assess CX:
i. Net Promoter Score (NPS): NPS measures customer loyalty by asking a simple question: “On a scale of 0 to 10, how likely are you to recommend our company to a friend or colleague?” Respondents are categorized into Promoters (9-10), Passives (7-8), and Detractors (0-6). The NPS is calculated by subtracting the percentage of Detractors from the percentage of Promoters.
ii. Customer Satisfaction (CSAT): CSAT measures overall satisfaction by asking customers to rate their satisfaction with a product, service, or interaction on a scale (e.g., 1-5 or 1-10). The average score represents the level of satisfaction.
iii. Customer Effort Score (CES): CES assesses the ease with which customers can achieve their goals when interacting with a company. It typically asks, “How easy was it to [complete a task]?” on a scale.
iv. Online Reviews and Feedback: Monitoring online reviews, comments, and feedback on social media, review sites, and surveys provides valuable qualitative insights into customer sentiment and issues.
v. Customer Journey Mapping: Creating detailed customer journey maps helps identify pain points and opportunities for improvement throughout the customer’s interaction with the brand. To illustrate, the customer journey map in Figure 5.2 below displays the various channels and paths traversed by customers in their interaction with a travel agency. Some of these paths appear undesirable. For example, the path highlighted below reveals some customers visit the website, call customer support (perhaps because they could not locate the information required), return to the website and then contact customer support again. This circuitous customer journey is unlikely to contribute to a positive customer experience, and bespoke metrics could be created to measure and address this issue.
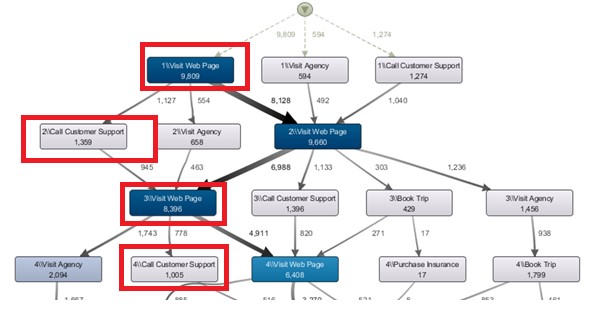
Figure 5.2 – Customer Journey Map
Source: dataminingapps.com
Exercise 5.2:
5.5 Examples of CX Success and Failure
To bring the principles we have discussed thus far to life, we briefly explore a few examples of excellent and poor CX together with the impact on the organization.
Excellent CX Examples
Apple Inc.: Apple is renowned for its exceptional CX. The seamless hardware, software, and customer support integration has created a loyal customer base. Apple’s retail stores offer a unique in-person experience, and their products consistently receive high NPS scores.
Amazon: Amazon’s customer-centric approach, epitomized by its fast shipping, personalized recommendations, and responsive customer service, has made it a CX leader. Its success is evident in its consistently high CSAT scores and customer loyalty.
Zappos: Zappos, an online shoe and clothing retailer, built its reputation on exceptional customer service. They are known for going above and beyond to satisfy customers, and their CES scores reflect the ease of shopping on their platform.
Poor CX Examples
United Airlines: United Airlines faced a significant CX failure when a passenger was forcibly removed from an overbooked flight in 2017. The incident was captured on video, went viral, and led to a PR disaster, a sharp drop in NPS scores, and damage to the airline’s reputation.
Wells Fargo: The Wells Fargo scandal in 2016 revealed unethical practices of opening unauthorized customer accounts to meet sales quotas. This breach of trust led to a plummet in NPS, customer satisfaction, and significant legal and financial consequences for the bank.
Blockbuster: Blockbuster’s failure to adapt to changing consumer preferences and the shift to digital media resulted in bankruptcy. The company failed to measure customer experience effectively, leading to its demise.
The main lesson from these examples is that measuring customer experience is not merely an exercise in data collection but the cornerstone of building and sustaining successful businesses. CX measurement tools like NPS, CSAT, CES, and customer feedback are essential for gaining insights into customer satisfaction and loyalty. Successful CX initiatives, as exemplified by Apple, Amazon, and Zappos, lead to customer loyalty, positive word-of-mouth, and sustained growth. Conversely, poor CX failures, such as those illustrated above, can result in damaged reputations, loss of customers, and even bankruptcy. In today’s competitive business environment, understanding and actively managing customer experience are critical for long-term success and sustainability.
5.6 How Process Excellence Enhances Customer Experience
In this section, we will establish that process excellence – the systematic approach to designing, managing, and improving organizational processes – plays a pivotal role in enhancing CX. Below, we explore how process excellence enables a superior customer experience and examine the key elements driving this synergy.
Relationship Between Process Excellence and Customer Experience
Process excellence and customer experience are inherently interconnected. When an organization focuses on achieving process excellence, it strives to provide consistently positive customer process outcomes, resulting in high-quality experiences. The following aspects elucidate the relationship:
i. Efficiency and Consistency: Process excellence involves streamlining and optimizing workflows, reducing inefficiencies, and eliminating bottlenecks. When processes are efficient and standardized, customers experience consistent service delivery. They know what to expect, which fosters trust and reliability.
ii. Minimized Errors and Delays: A well-designed process minimizes the likelihood of errors, delays, and breakdowns in service, reducing customer frustration and dissatisfaction and resulting in a more positive experience.
iii. Employee Empowerment: Process excellence often includes empowering employees with the tools, training, and autonomy to address customer needs effectively. Empowered employees can provide personalized and responsive service, enhancing the customer experience.
iv. Data-Driven Insights: Process excellence relies on data collection and analysis to identify areas for improvement. Organizations can pinpoint pain points by analyzing customer feedback and journey data and make informed changes that directly benefit the customer. During Workshop 6, we will explore how process mining enables process outcomes to be linked with CX measures and thus establish a correlation between process outcomes (e.g. cycle time, quality) and customer satisfaction scores. We will extend this further in Workshop 7 as we utilize causal inference techniques to identify and quantify the factors contributing to CX.

Key Elements of Process Excellence Driving CX
i. Customer-Centric Design: Process excellence begins with a customer-centric approach. Organizations must understand their customers’ needs, expectations, and pain points. By designing processes around these factors, companies can ensure that every activity aligns with delivering a superior CX. Tools such as Kano analysis (see section 5.3) can facilitate understanding of these customer needs.
ii. Continuous Improvement: Process excellence is an ongoing journey, not a one-time endeavor. Continuous improvement methodologies like Lean, Six Sigma, and Kaizen enable organizations to adapt to changing customer preferences and market dynamics. Regularly refining processes ensure that CX remains optimized.
iii. Automation and Technology Integration: Leveraging technology to automate repetitive tasks and integrate systems can significantly enhance CX. It reduces manual errors, accelerates response times, and allows staff to focus on higher-value customer interactions.
iv. Cross-Functional Collaboration: Process excellence encourages collaboration between departments, breaking down silos and ensuring a seamless, end-to-end customer journey. Collaborative teams can address issues more effectively and proactively.

Examples of Process Excellence Driving CX
We bring these concepts alive as previously done in section 5.5 by providing examples of organizations where process excellence has driven excellent CX as follows:
Disney: Disney is known for its exceptional customer experience. Behind the scenes, their process excellence is evident in meticulous planning, employee training, and efficient operations, ensuring visitors have a magical and hassle-free experience.
Amazon: Amazon’s relentless focus on process excellence, from supply chain management to order fulfilment, results in fast, reliable, and consistent service. Their ability to anticipate customer needs, optimize delivery routes, and resolve issues swiftly contributes to their outstanding CX.
Zara: Zara’s “fast fashion” approach relies on efficient processes, such as quick inventory turnover and just-in-time production. These processes allow Zara to provide trendy, affordable clothing that aligns with customer preferences.
The examples above demonstrate that process excellence and customer experience are intrinsically linked. Organizations can deliver a superior CX that fosters customer loyalty, positive word-of-mouth, and long-term success by implementing and continuously improving efficient, customer-centric processes. In today’s competitive business landscape, investing in process excellence is not just a strategy; it is an imperative for companies seeking to thrive and differentiate themselves through exceptional customer experiences.
Case Study
External Incident-to-Close, Cisco
The Problem
Cisco is a multinational digital communications corporation that provides networking, cloud and cybersecurity technology.
These components are mission-critical and critical for their customer’s operations. Every minute of network outage that Cisco can avoid for a customer could save them thousands of dollars.
As such, Cisco needs to respond swiftly to outages to ensure their customers can “keep the lights on” and satisfy their customers.
The company provides two premium service packages with two- and four-hour SLAs within which the service will be restored.
Even though over 90% of outages were resolved within the SLA, given the significant adverse impact on their customers, the company launched an initiative to increase its Service Delivery Performance (SDP), i.e., the proportion of outages resolved within the SLA.
How Process Excellence Improved Customer Experience
Analysis of the current state process provided transparency, revealing that the incident resolution process was highly manual and labor-intensive.
A Single Point of Contact (SPOC) labelled the ‘Process Quarterback’ was assigned to personally coordinate and manage the incident resolution process. While this provided certain advantages, e.g., removing uncertainty around whom to contact and speeding up information flow, this concentrated a lot of responsibility on a single person and introduced a measure of risk.
Additionally, the process’s manual nature involved many non-value-added activities, e.g., copying and pasting between applications.
The analysis revealed significant scope to automate many of the activities intelligently to improve customer outcomes. For example, an opportunity was identified to automate the communication between the field and logistics teams to ensure prompt and accurate information at every process stage.
Results
Seventeen crucial activities were automated for the incident resolution process with the two-hour SLA, resulting in a 54% automation rate. Further analysis suggests that scope remains for additional automation, and the aim is to increase the automation rate to 70%, which is expected to improve process efficiency and accuracy.
The initiative’s next major goal is to provide real-time service delivery root cause reporting to understand better where and how service delivery issues arise and prevent them.
Source: celonis.com
Exercise 5.3:

Course Manual 6: Employee Engagement
6.1 Introduction
Employee engagement is a multidimensional concept encompassing employees’ emotional, psychological, and behavioral connection with their work, colleagues, and organization. Engaged employees are not merely satisfied with their jobs; they are passionate, committed, and motivated to contribute to achieving the organization’s goals. Employee engagement goes beyond job performance and reflects a sense of purpose, belonging, and alignment with the company’s mission and values.
As employees are typically involved in executing all aspects of organizational strategy, high employee engagement is closely linked to increased productivity and organizational success. This course delves into the concept of employee engagement, exploring its connection to the employee lifecycle, what employees value most in their work environments and the link between process excellence and employee engagement.
6.2 The Employee Lifecycle and Employee Engagement
Employee engagement is a dynamic process that evolves throughout the employee lifecycle, even before an employee is recruited, right through to exit from the organization. Below, we explore how engagement manifests at each stage of the employee lifecycle:
Organizational Perspective:
i. Attraction: Before an individual joins an organization, their engagement begins with the company’s employer brand and reputation. An attractive workplace culture, a compelling mission statement, and positive reviews on platforms like Glassdoor can engage potential candidates. Offering a glimpse of professional growth, work-life balance, and other perks can set positive expectations and drive interest among top talent.
ii. Recruitment: The recruitment process is a potential employee’s first tangible interaction with an organization. Swift and transparent communication, respect for the candidate’s time, and a fair evaluation process can foster engagement. A cumbersome or prolonged recruitment process can disengage even the most enthusiastic candidates, leading them to pursue other opportunities.
iii. Onboarding: The onboarding phase sets the tone for an employee’s tenure. A structured onboarding program covering training, team introduction, and clarity of roles and responsibilities can significantly boost engagement. Feeling welcomed, valued, and equipped to contribute from the outset fosters immediate engagement and commitment.
iv. Development: As employees settle into their roles, continuous opportunities for professional growth are crucial for sustained engagement, including training programs, workshops, mentoring, and clear paths to advancement. Employees who see a future for themselves within the organization and believe in their personal growth tend to be more engaged and productive.
v. Retention: Retaining top talent is as much about engagement as recruitment is. Engaged employees often equate to satisfied employees. Regular feedback loops, performance reviews, competitive compensation, recognition, and a healthy work environment contribute to retention. Addressing concerns, celebrating achievements, and ensuring work-life balance can bolster loyalty and decrease turnover.
vi. Separation: Whether due to retirement, a new job opportunity, or other reasons, the separation phase is as critical as any other. Offboarding processes that include exit interviews can provide insights into the employee experience. Treating departing employees with respect and gratitude ensures they leave on good terms and leaves the door open for potential rehires. Their post-employment sentiments can influence the company’s reputation and future attraction efforts.
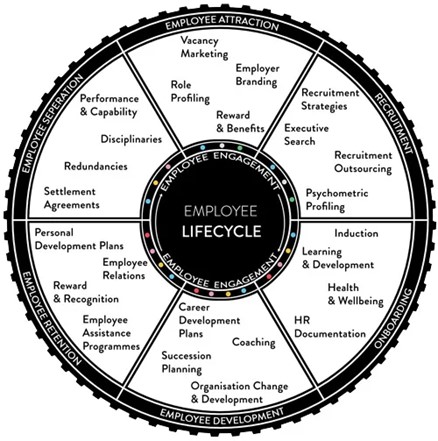
Figure 6.1 – Employee Lifecycle
Source: outthererpo.com
6.3 What Employees Value
Organizations must understand what employees value to foster engagement at every stage of the employee lifecycle. Although these may vary depending on organizational and local culture, key elements include:
i. Purpose and Meaning: Employees seek meaningful work aligning with their values and the organization’s mission. Understanding how their role contributes to larger goals fosters a sense of purpose. Course Manuals 11 & 12 explore how the organization can harness that sense of purpose to create and maintain a culture that promotes process excellence.
ii. Recognition and Appreciation: Regular recognition and feedback, both formal and informal, reinforce the value of an employee’s contributions. Acknowledgment boosts morale and motivation.
iii. Development and Growth: Skills development, career advancement, and continuous learning opportunities are highly valued. Employees want to see a path for personal and professional growth within the organization.
iv. Work-Life Balance: Maintaining a healthy work-life balance is crucial for employee well-being. Organizations that support flexible schedules, remote work options, and stress management contribute to engagement.
v. Positive Work Culture: A positive work culture characterized by respect, trust, and inclusivity enhances engagement. Employees want to work in environments where they feel respected and heard. Course Manuals 11 & 12 examine how an engaging organizational culture can be cultivated and maintained by implementing a system that encourages self-expression, experimentation and “serious play”.
vi. Effective Leadership: Engaged employees look to their leaders for inspiration and guidance. Effective leadership fosters trust and transparency, which are essential for engagement. Course Manuals 11 & 12 introduce the concept of servant (or humble) leadership and demonstrate how this fosters employee engagement.
vii. Fair Compensation and Benefits: While not the sole driver of engagement, competitive compensation and benefits packages are important in attracting and retaining talent.
6.4 Measuring Employee Engagement
It is essential to measure the levels of employee engagement to effectively monitor it and take actions to maintain or move it in the desired direction. Measuring employee engagement involves assessing the emotional, cognitive, and behavioral aspects of an employee’s connection to work and the organization.
Several methods and tools are commonly used to gauge employee engagement:
i. Surveys and Questionnaires: Employee engagement surveys typically consist of questions designed to evaluate satisfaction, commitment, and alignment with the organization’s mission and values. These surveys should be administered periodically to track changes over time.
ii. One-on-One Interviews: Personal interviews with employees can provide qualitative insights into their engagement levels. These discussions allow for a deeper exploration of individual concerns and motivations.
iii. Pulse Surveys: Short, frequent surveys, often conducted on a monthly or quarterly basis, provide real-time feedback on engagement levels and allow for quicker responses to emerging issues.
iv. 360-Degree Feedback: This method involves collecting feedback from employees, peers, supervisors, and subordinates to gain a holistic view of an employee’s engagement and performance.
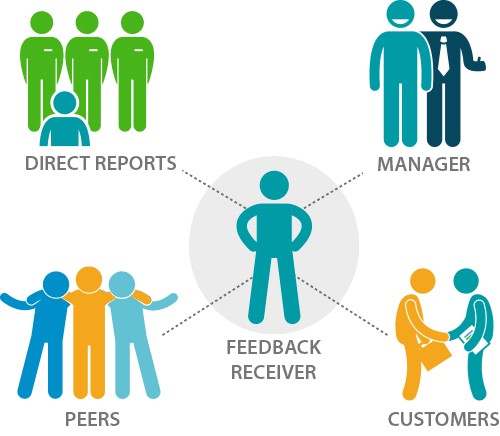
Figure 6.2 – 360 Degree Feedback
Source: cognology.com
These tools can be used to collect one or more of the following employee engagement metrics:
i. Absenteeism Rate:
The absenteeism rate quantifies the number of unexcused absences employees take over a specific period, typically expressed as a percentage. It is calculated using the following formula:
(Number of Unexcused Absences / Total Workdays) X 100
A high absenteeism rate can indicate disengagement, job dissatisfaction, or other underlying workplace issues. Conversely, a low rate suggests employees are engaged and find meaning in their work.
ii. Employee Satisfaction Index (ESI):
The Employee Satisfaction Index measures the degree to which employees are content with their job roles and the workplace environment. It’s usually derived from a comprehensive survey on various aspects of the job experience.
The formula for calculation varies based on the specific survey questions and structure, but typically it is calculated as:
(Total Satisfaction Score / Maximum Possible Score) x 100
A high ESI indicates high job satisfaction among employees, while a low score suggests areas of concern that require managerial attention.
iii. Employee Net Promoter Score (eNPS):
The eNPS measures employees’ likelihood to recommend the organization as a good place to work. It’s derived from the question, “On a scale of 0-10, how likely are you to recommend this company as a workplace to a friend or colleague?”
It is calculated using the formula: % of Promoters (those who answered 9-10) – % of Detractors (those who answered 0-6). The score ranges from -100 to +100.
A positive eNPS indicates that more employees are promoters (satisfied) than detractors (dissatisfied). A negative score suggests the opposite, indicating potential employee engagement or satisfaction issues.
iv. Employee Turnover Rate:
The Employee Turnover (or Attrition) Rate quantifies how many employees leave an organization over a specified period, typically expressed as a percentage.
It is calculated using the following formula:
(Number of Employees who Left during Period / Average Number of Employees during Period) x 100
A high turnover rate may suggest job dissatisfaction, issues with organizational culture, or other workplace problems. A low turnover rate suggests employees are satisfied and retention efforts are successful.
Exercise 6.1:
6.5 Consequences of Employee Engagement and Disengagement
To further reinforce the importance of employee engagement, we will discuss below what happens when employees are engaged and disengaged.
When employees are engaged, it enables:
i. Higher Productivity: Engaged employees are more motivated and committed to their work, increasing productivity and higher-quality output. In Chapter 5 of ‘Alive at Work, Daniel Cable presents a case study about an Italian white goods manufacturing plant where the introduction of Lean manufacturing practices not only energized and motivated the employees but also resulted in increased productivity by 25%, demonstrating the link between employee engagement and higher productivity.
ii. Lower Turnover: Engaged employees are less likely to leave their jobs, reducing recruitment and training costs. Additionally, because they are engaged, they are likely to be highly motivated and contribute significantly to achieving organizational objectives.
iii. Innovation: Engaged employees are more likely to contribute creative ideas and innovations that benefit the organization. As they are often “at the coalface”, they are acutely aware of the nature of the problems occurring and possess valuable suggestions for addressing these effectively. Course Manual 10 explores the brain mechanism (referred to as the seeking system), which is activated when employees are engaged and that drives innovation.
iv. Better Customer Service: Engaged employees provide better customer service, increasing customer satisfaction and loyalty. As employees often interact with customers, they usually possess unique insights into their needs and have suggestions about how these can be better met. Chapter 7 of “Alive at Work” contains the case study of a UK food delivery company that took active steps to engage their delivery drivers, resulting in many customer-centric suggestions such as new product lines that customers had requested and new ways to report stock shortages quickly so that customers were not left without the groceries they ordered.
v. Positive Workplace Culture: Engaged employees contribute to a positive workplace culture characterized by collaboration, trust, and high morale. Fostering such a culture is essential as younger, digitally native employees who value empathy and a deeper connection with their colleagues enter the workforce.
When employees are disengaged, several negative consequences can occur, including:
i. Quiet Quitting: This refers to employees who, while physically present, mentally disengage from their work. They may go through the motions but lack enthusiasm and commitment. Quiet quitters often become disenchanted with their roles and may withdraw from active participation in their teams or projects. It may be argued that quiet quitting is worse for the organization than employee exit, as these employees still consume resources (e.g., labor cost, management time, etc.) while delivering the bare minimum they can get away with.
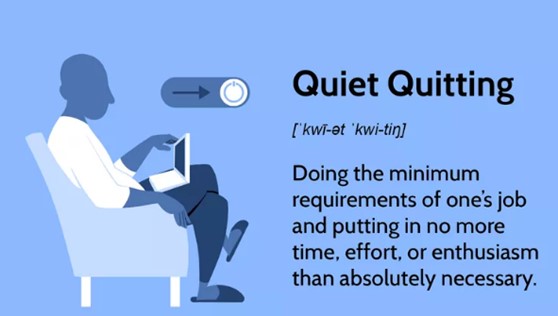
Source: Investopedia.com
ii. Learned Helplessness: In a disengaged environment, employees may experience learned helplessness, a state in which they believe their actions have no impact on their circumstances. They thus become passive and resign themselves to a sense of powerlessness, leading to reduced initiative and creativity.
iii. Decreased Productivity: Disengaged employees often perform at a lower level, resulting in reduced productivity and missed deadlines.
iv. Increased Turnover: Employees who feel disconnected from their work are more likely to leave the organization, leading to higher turnover rates.
v. Negative Workplace Culture: Disengaged employees can contribute to a toxic workplace culture characterized by apathy, cynicism, and low morale.
vi. Loss of Innovation: Disengaged employees are less likely to contribute innovative ideas, hindering the organization’s ability to adapt and grow. Even when employees come up with good ideas for solving problems, they are likely to keep it to themselves.
6.6 How Process Excellence Fosters Employee Engagement
As previously established, organizations increasingly recognize that employee engagement is not just a buzzword but a fundamental factor influencing productivity, innovation, and overall success. Simultaneously, process excellence has emerged as a strategic approach to improving operational efficiency and effectiveness. In this section, we explore the intersection of process excellence and employee engagement, emphasizing how a culture of process excellence can foster higher levels of engagement among employees.
The relationship between process excellence and employee engagement is multifaceted and symbiotic. Below, we discuss how process excellence fosters employee engagement:
i. Clarity and Purpose: Well-defined processes provide employees with a clear understanding of their roles and responsibilities. Employees who understand their contributions to the broader organizational goals feel a stronger sense of purpose and engagement.
ii. Efficiency and Reduced Frustration: Streamlined and efficient processes eliminate unnecessary tasks and reduce workplace frustrations. Employees are less likely to encounter roadblocks or experience undue stress, leading to higher job satisfaction and engagement.
iii. Empowerment and Ownership: Process excellence often encourages employee involvement in improvement initiatives. As demonstrated by the case study from the Italian manufacturer later in the manual, when employees can contribute to designing and optimizing their workflows, they feel a sense of ownership and empowerment, which positively impacts engagement.
iv. Data-Driven Recognition and Feedback: The data-driven nature of process excellence allows organizations to track and measure employee performance accurately, enabling fair recognition and feedback and reinforcing a culture of appreciation and engagement.
v. Professional Growth Opportunities: A commitment to continuous improvement promotes a learning culture. As employees engage in process improvement projects and develop new skills, they have more professional growth and career development opportunities.
vi. Enhanced Collaboration: Well-defined processes create a common organizational collaboration and communication framework. When employees can rely on consistent processes, teamwork becomes more efficient and effective, enhancing their sense of belonging and engagement.
In conclusion, we bolster the points above with the example of Toyota, an organization which provides a prime example of how process excellence can drive employee engagement and organizational success. The company’s renowned Toyota Production System (TPS) emphasizes continuous improvement, waste reduction, and employee involvement. Toyota has achieved world-class operational efficiency by involving employees in problem-solving and process improvement initiatives and nurturing a culture of engagement and empowerment among its workforce.
Case Study
Ideation-to-Implementation Process, Shell
Problem
With over 100,000 workers and almost a century of history, Shell is the kind of company where it is challenging to foster creativity and innovation. Capital access is strictly regulated, barriers to obtaining investment are formidable and novel concepts either stagnate or advance very slowly.
However, with growing pressure from various stakeholder groups, including shareholders, customers and society around climate change, among others (see ‘Shell faces shareholder challenge over climate change approach’), it was essential the organization actively fostered innovation to ensure it was well positioned to address the potential threats to its business model.
How Process Excellence Improved Employee Engagement
To address this issue, Shell’s Director of Research and Technical Services tried to foster creativity in the technical branch of the company’s exploration division. To spark innovative thinking, he encouraged employees to work on side projects and ideas outside their regular duties that they found interesting. However, the outcomes were lacklustre because most employees were locked into their status quo.
The Game-Changer programme was established to improve these outcomes, which authorised a small group of employees to apportion $20 million to ideas that achieve positive results by thinking outside the box and challenging accepted norms. It was assumed that ideas would not originate from pre-defined functions but from anywhere inside the firm. However, this monetary incentive alone was insufficient to motivate employees to engage, and the flow of ideas trickled in.
The approach was thus revisited, resulting in the set-up of a three-day ideation lab attended by 72 “intrapreneurial” employees. The lab involved a discovery process for the participants, emphasising disruptive transformation in Shell’s industry and internal environment. They worked on figuring out how the company could use this breakthrough to upend the market.
This process motivated and enthused participants, which piqued the interest of those not involved. The enthusiasm in the lab attracted so many people that it was necessary to lock the conference room doors to prevent excessive interruption.
The group generated 240 ideas by the second day’s conclusion, some of which were brand-new ventures and others innovative approaches to existing products and services. Participants were encouraged to cluster around the ideas that best resonated with them.
However, a subsequent issue was ensuring these concepts survived and were implemented. By now, a group of enthusiastic and driven employees had been assembled, but they did not know what to do next.
A process was required to develop these intriguing concepts into a business plan. Shell created Action Lab, a rigorous 5-day programme, to assist participants in turning their ideas into solid venture plans for starting new businesses. Participants learned how to define the parameters of their concepts, find collaborations, assess the concepts’ competitive advantage, and compute the financial ramifications. They received coaching in creating 100-day action plans that included strategies for testing and prototyping their concepts in the real world. They also received coaching on using storytelling to make their ideas come to life.
Upon the conclusion of the lab, the concepts were brought before a venture board comprised of high-ranking Shell officials and experts in financing and promoting advanced technologies.
Grants were awarded for approved ideas, typically $100,000 to $600,000, within eight to ten days. Every idea then underwent a proof-of-concept evaluation, where the team aimed to secure more financing by proving that their implantation approach was feasible. At this point, the venture board assisted potentially profitable businesses in locating a long-term home within Shell.
Result
While some Game Changer efforts have continued as research and development projects, 25% have found a home in a Shell Operating Unit or one of the company’s numerous growth initiatives.
For the remainder, learning from the projects has been assimilated and diffused within the organization, ensuring that, even though these projects were wound down, they are still viewed as successful.
Though not all ideas receive funding, and not all of those that do end up becoming profitable ventures, the program’s ability to encourage exploration and learning has been its most crucial contribution to the organization because it encouraged participants to play to their interests and skills, resulting in benefits both to the organization and the employee.
Exercise 6.2:

Course Manual 7: Regulatory Compliance
7.1 Introduction
Regulatory compliance refers to an organization’s adherence to laws, regulations, standards, and guidelines relevant to its operations, industry, and jurisdiction. These rules are established by various government agencies, industry bodies, and international organizations to promote fair practices, protect stakeholders, and maintain order in various sectors. Compliance involves following the letter and spirit of these regulations, often necessitating developing and implementing policies, procedures, and internal controls.
In this course manual, we explore the concept of regulatory compliance, its significance, what regulators value when overseeing organizations’ adherence to these rules and how process excellence enhances regulatory compliance.
7.2 Importance of Regulatory Compliance
Regulatory bodies enact laws, regulations, and industry standards that organizations must adhere to for several reasons, as follows:
i. Legal Obligation: Compliance is a legal requirement. Failure to adhere to regulations can result in severe penalties, fines, legal actions, and reputational damage for organizations and their leadership.
ii. Risk Mitigation: Compliance helps organizations identify and manage regulatory violations, financial losses, and reputational harm risks. By adhering to regulations, businesses can mitigate these risks and protect their long-term viability.
iii. Consumer Protection: Compliance ensures that products and services meet safety, quality, and ethical standards, safeguarding consumers from harm and fraud. Agencies such as The Federal Trade Commission in the USA and the Trading Standards in the UK enforce consumer protection laws that prevent fraud and unfair business practices.
iv. Data Protection and Privacy: In an era of increasing data breaches and privacy concerns, regulatory compliance, such as GDPR (General Data Protection Regulation) in Europe, is essential for safeguarding individuals’ personal information.
v. Financial Stability: Compliance in the financial industry, such as Basel III regulations for banks, plays a vital role in maintaining financial stability and preventing systemic crises. Failures in compliance can lead to financial crises, as seen in the 2008 global financial crisis, highlighting the critical role of regulatory oversight.
vi. Ethical Business Practices: Compliance promotes ethical business conduct, fostering trust among customers, investors, and stakeholders. It is a critical component of corporate social responsibility.

Figure 7.1 – Regulatory Compliance Decomposed
Exercise 7.1:
7.3 What Regulators Value in Compliance
Regulators value several critical aspects when overseeing compliance:
i. Transparency: Regulators expect organizations to be transparent about their operations, financial dealings, and adherence to regulations. This transparency enables regulators to assess compliance accurately. Certain sectors, such as financial services, pharmaceutical, legal and food manufacturers, have specific regulatory reporting requirements. For example, financial service providers, including banks, insurance providers, and securities firms, must provide periodic reports supplying information regarding their business’s risk management procedures, financial performance, and legal compliance. Regulators expect these reports to be provided on time and be accurate.
![]()
ii. Accountability: Organizations are responsible for their actions and compliance efforts. Regulators value clear lines of accountability, including designated compliance officers and reporting structures.
iii. Documentation: Proper record-keeping is vital. Regulators value comprehensive documentation of compliance efforts, including policies, procedures, training materials, audit reports, and evidence of due diligence.
iv. Proactive Measures: Regulators value organizations that take proactive steps to identify and address compliance issues before they become significant problems. This includes conducting risk assessments and internal audits.
v. Continuous Improvement: Compliance is not a one-time effort but an ongoing commitment to improvement. Regulators appreciate organizations regularly reviewing and updating their compliance programs to adapt to changing regulations and risks.
vi. Ethical Culture: Regulators value organizations that foster an ethical culture where employees understand the importance of compliance and are encouraged to report violations or concerns.
7.4 Measuring Regulatory Compliance
Measuring regulatory compliance involves assessing various aspects of an organization’s operations to determine its alignment with relevant regulations and standards. Measuring regulatory compliance is essential for assessing an organization’s adherence to these standards, evaluating its effectiveness in meeting regulatory requirements, and understanding the impact of ineffective compliance practices.
Several methods and tools are commonly used for this purpose:
i. Regulatory Audits: Internal or external audits are conducted to assess an organization’s compliance with specific regulations. Auditors examine processes, documentation, and evidence of compliance.
ii. Key Performance Indicators (KPIs): Organizations establish KPIs related to regulatory compliance, such as the number of violations, timely reporting, and completion of required training. Monitoring these metrics helps gauge compliance levels.
iii. Compliance Checklists: Checklists outline specific regulatory requirements and guide organizations to ensure compliance in various areas.
iv. Surveys and Questionnaires: Surveys and questionnaires can be administered to employees, suppliers, or customers to gather feedback on an organization’s compliance efforts.
v. Regulatory Technology (RegTech): RegTech solutions use technology, such as data analytics and automation, to streamline compliance processes, monitor regulatory changes, detect potential violations, and collect and analyse data regarding regulatory compliance.
vi. Internal Controls: Organizations establish internal control systems to ensure compliance. These controls may include policies, procedures, training programs, and reporting mechanisms.
These tools can be used to collect one or more of the following regulatory compliance metrics:
i. Compliance Costs Per Issue:
This metric quantifies the financial costs of addressing and resolving each compliance-related issue during a specified period.
It is calculated using the following formula:
Total Compliance-related Costs / Total Number of Issues
A higher cost per issue might indicate inefficiencies in the compliance process or the presence of complex or high-risk issues that require significant resources to address.
ii. Mean Time to Issue Discovery (MTTID):
MTTID represents the average time taken to identify a compliance issue from the moment it arises.
It is calculated using the following formula:
Total Time Taken to Discover All Issues / Total Number of Issues
A shorter MTTID suggests effective monitoring and detection mechanisms, while a longer MTTID may indicate gaps or inefficiencies in the compliance detection process.
iii. Mean Time to Issue Resolution (MTTIR):
MTTIR measures the average time taken to resolve a compliance issue once it has been identified.
It is calculated using the following formula:
Total Time Taken to Resolve All Issues / Total Number of Issues
A shorter MTTIR indicates efficient resolution processes and proactive compliance management. Conversely, a longer MTTIR might suggest procedural inefficiencies or challenges in addressing issues.
iv. Number of Breaches:
This metric counts the total number of violations of compliance regulations or standards during a specified period.
A higher number might indicate a need for improved training, better processes, or enhanced monitoring. Conversely, a decrease in the number of breaches over time could suggest effective compliance strategies.
v. Risk Mitigation Timeframe:
This metric measures the average time to mitigate identified compliance risks from the moment of discovery to the implementation of corrective measures.
A shorter timeframe indicates agility in addressing and mitigating risks. A prolonged timeframe might suggest challenges in mobilizing resources or inefficiencies in the risk management process.
vi. Severity Gap Between Predicted and Actual Risks:
This metric evaluates the difference between the anticipated severity of compliance risks and the actual outcomes when those risks materialize.
A significant severity gap suggests discrepancies in risk assessment and forecasting. If actual risks consistently become more severe than predicted, it may indicate a need for improved risk evaluation tools or expertise.
Exercise7.2:
7.5 The Impact of Regulatory Compliance
To buttress the significance of regulatory compliance, we discuss the impact of satisfactory and unsatisfactory regulatory compliance below.
The Impact of Satisfactory Regulatory Compliance
When regulatory compliance is satisfactory, it enables:
i. Operational Efficiency: Compliance often requires the implementation of best practices, streamlining processes, and enhancing operational efficiency, implying that rather than being viewed as an unnecessary burden, regulatory requirements should be viewed as beneficial to the organization. For example, clear documentation, such as policies and training materials which regulators require (see Section 7.3), contribute to operation efficiency and should be available (even if it is not a regulatory requirement).
ii. Stakeholder Trust: Good compliance practices build trust among stakeholders, including regulators, customers, investors, and partners. Trust is vital for long-term relationships and business growth. For example, if regulators trust that an organization is compliant and transparent, certain regulatory requirements might be lessened (e.g., reporting frequency). However, if the converse is true, regulators are often at liberty to increase the regulatory burden (e.g., by appointing monitors to act on their behalf), which often diverts significant resources that would otherwise be spent innovating or serving customers.
iii. Competitive Advantage: Organizations that excel in compliance can use it as a competitive advantage by showcasing their commitment to safety, quality, and ethical conduct. A consequence of increased regulatory oversight is that it will likely put the organization at a disadvantage to its competitors,
iv. Financial Stability: Compliance reduces the likelihood of regulatory fines, penalties, or legal actions that can significantly impact an organization’s financial stability.
v. Legal and Ethical Standing: Good regulatory compliance ensures that an organization operates within legal boundaries and adheres to ethical standards, enhancing its reputation and reducing legal and reputational risks.
The Impact of Unsatisfactory Regulatory Compliance
When regulatory compliance is unsatisfactory, it results in:
i. Loss of Customers: Regulatory non-compliance may lead to customer attrition and decreased market share. Regulators can limit market access, e.g., by withdrawing operating licenses, instructing an organization to withdraw certain products or, due to increased compliance costs, making certain products or service offerings unprofitable.
ii. Financial Losses: Non-compliance can result in financial losses due to fines, legal fees, increased insurance costs, and reduced revenue (see Figure 7.2)
iii. Legal Consequences: Non-compliance can result in legal actions and penalties, damaging an organization’s finances and reputation.
iv. Reputation Damage: Instances of non-compliance tarnish an organization’s reputation, eroding stakeholder trust.
v. Operational Disruptions: Regulatory violations can lead to operational disruptions, such as production stoppages, product recalls, or business closures.
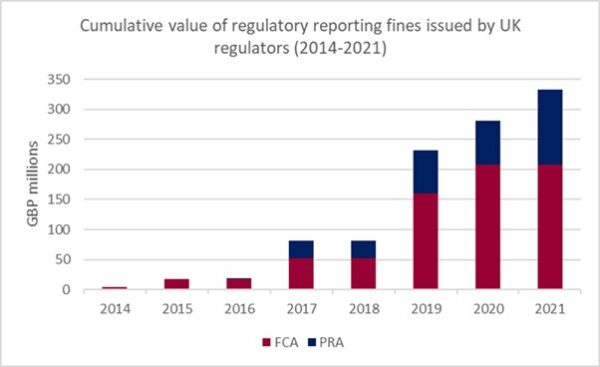
Figure 7.2 – Value of Regulatory Reporting Fines (UK Regulators)
Source: Deloitte.com
7.6 Process Excellence and Regulatory Compliance
Process excellence and regulatory compliance are intertwined, as the former enables the latter. Below, we explore how process excellence serves as a catalyst for achieving and maintaining regulatory compliance.
i. Clarity and Standardization: Process excellence involves defining, documenting, and improving organizational processes. When processes are clearly defined and standardized, aligning them with regulatory requirements becomes easier. Employees can readily understand their roles in ensuring compliance reducing the likelihood of errors or omissions.
ii. Data-Driven Insights: Process excellence often relies on data collection and analysis to identify areas for improvement. This data-driven approach can also be applied to regulatory compliance, with organizations using data to monitor and measure their adherence to regulatory standards. Descriptive Process Mining approaches, specifically conformance checking (which will be covered in Workshop 6), enable organizations to detect deviations from defined processes automatically. See Figure 7.3 for an example of how process mining contributes to effective GDPR implementation.
iii. Risk Identification and Mitigation: Process excellence methodologies, such as Lean and Six Sigma, emphasize identifying and mitigating risks within workflows. By conducting thorough process analysis, organizations can identify potential compliance risks and develop strategies to address them proactively. As mentioned in Course Manual 2, controls can be associated with risks as part of the process definition. In addition, Process Mining can optimize the testing of these controls, as shown in Figure 7.4 below.
iv. Efficiency and Consistency: Streamlining processes through process excellence improves efficiency, reduces operational costs, and minimizes variability. Consistent processes ensure that regulatory requirements are consistently met, reducing the risk of non-compliance due to inconsistencies in execution.
v. Documentation and Audit Trails: Regulatory compliance often requires comprehensive documentation of processes, activities, and decisions. Process excellence methodologies promote thorough record-keeping, making the production of audit trails easier and demonstrating compliance when needed. In addition, Process Mining utilizes the data from Process Aware Information Systems (PAIS) to facilitate regulatory compliance.
vi. Continuous Improvement: Both process excellence and regulatory compliance require a commitment to continuous improvement. Organizations that embrace process excellence are more likely to proactively review and adapt their processes to align with changing regulatory requirements.
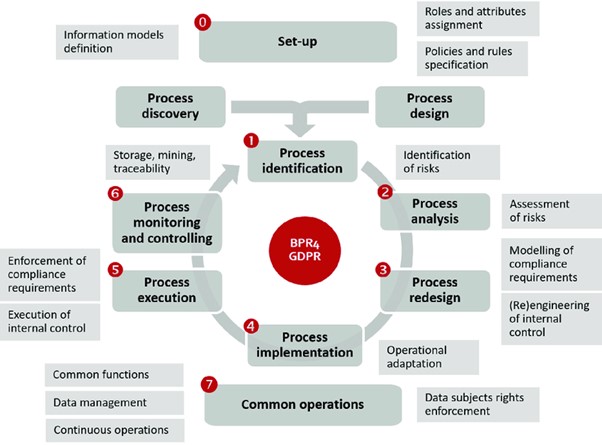
Figure 7.3 – Process Mining Contribution to GDPR Implementation
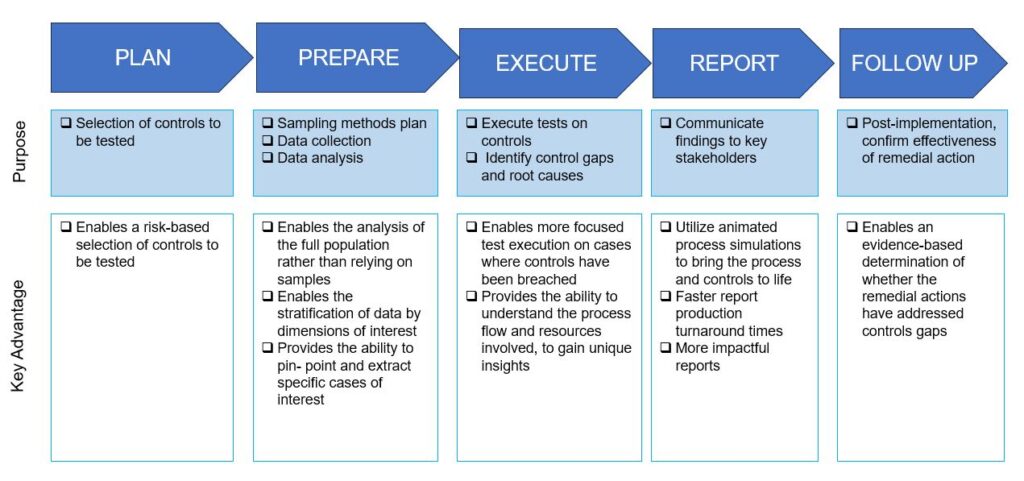
Figure 7.4 – Advantages of Using Process Mining for Controls Testing
To illustrate the foregoing, we consider the pharmaceutical industry, which provides a compelling example of how process excellence and regulatory compliance are linked. This sector is subject to stringent regulations to ensure the safety and efficacy of medications. Pharmaceutical companies must adhere to Good Manufacturing Practices (GMP) and other regulations to maintain product quality and safety.
Process excellence methodologies, such as Lean and Six Sigma, are widely adopted in the pharmaceutical industry. These methodologies help organizations optimize their manufacturing and quality control processes. By aligning their processes with GMP requirements and using data-driven insights, pharmaceutical companies can consistently produce high-quality products while meeting regulatory standards.
In summary, the benefits of Process Excellence-Driven Compliance are as follows:
i. Reduced Compliance Risks: Organizations that embrace process excellence are more likely to identify and mitigate compliance risks before they escalate. This proactive approach reduces the likelihood of regulatory violations.
ii. Cost Savings: Streamlined and efficient processes lead to cost savings, which can be reinvested in compliance efforts and quality assurance measures.
iii. Enhanced Reputation: Demonstrating a commitment to process excellence and regulatory compliance enhances an organization’s reputation, fostering trust among stakeholders and customers.
iv. Improved Operational Efficiency: The optimization of processes through process excellence not only supports regulatory compliance but also enhances overall operational efficiency and competitiveness.
Case Study
Security Order-to-Record Consolidation Process, Degusa Bank
Problem
Degussa is a German bank established in 1873 that employs about 600 people and has assets worth roughly €6.1 billion under management.
They are well known for enabling customer access by locating themselves close to (or inside) the businesses they service so that workers can visit the bank during working hours or brief breaks.
To comply with German regulations (e.g., MiFID II and WpHG), German banks must record all security orders placed over the phone. However, as the orders and regulatory records were logged in different IT systems, it was often difficult to reconcile these items, especially as a common identifier across these systems was lacking.
In addition, the process was manual and time-intensive, lacking transparency.
How Process Excellence Improved Regulatory Compliance
The bank integrated the process data using a process mining tool, which quickly reconciled orders with regulatory records.
In addition, the tool provided transparency into the automation rate and the resultant waste. With the aid of process simulation, the impact of potentially automating suitable activities was visible, which motivated relevant stakeholders to welcome the change.
The changes to the process enabled process performers to be provided early warning for potential problems, document these and resolve them before the problem materialised.
Results
The bank increased its recording reconciliation rate by 12%.
Additionally, the increased automation rate lightened employee workload.
Exercise

Course Manual 8: Shareholder Value
8.1 Introduction
Shareholder value refers to the economic worth and returns that shareholders derive from their ownership of a company. It represents the net present value of all future cash flows, dividends, and capital gains expected from owning shares in a corporation. Shareholder value is a fundamental measure of a company’s success and is closely monitored by investors, analysts, and boards of directors.
Shareholder value encompasses the idea that a corporation should enhance its shareholders’ wealth and financial well-being. Below, we delve into the concept of shareholder value, exploring what shareholders value, how to measure shareholder value and the relationship between process excellence and shareholder value.
8.2 What Shareholders Value
Shareholders value several vital elements when assessing a company’s performance and prospects:
i. Financial Performance: Shareholders are primarily concerned with a company’s financial performance, including revenue growth, profitability, and return on investment. They want a consistent track record of generating profits and delivering positive returns.
ii. Dividends and Capital Gains: Shareholders appreciate regular dividend payments, representing a direct return on their investment. Capital gains resulting from an increase in the stock’s market price are also highly valued.
iii. Risk Management: Shareholders value companies that effectively manage risk, including strategies to mitigate market risk, operational risk, and financial risk to protect shareholder wealth.
iv. Corporate Governance: Good corporate governance practices, such as transparency, accountability, and ethical conduct, are critical to shareholders. They want assurance that the company’s management and board act in their best interests.
v. Innovation and Growth: Shareholders recognize the importance of innovation and growth strategies to drive future profits and enhance the company’s competitiveness.
vi. Efficient Capital Allocation: How a company allocates its capital, including investments in projects, acquisitions, and stock buybacks, is closely scrutinized by shareholders. Efficient capital allocation should yield positive returns.
vii. Long-Term Sustainability: Shareholders increasingly value sustainability and responsible business practices. They want companies to consider environmental, social, and governance (ESG) factors that can impact long-term value.
viii. Communication and Transparency: Effective communication with shareholders and transparency about the company’s financial health, strategy, and challenges are essential. Shareholders value open and honest communication from management.
Exercise 8.1:
To illustrate the points above, consider the example of Warren Buffett, one of the most successful investors of all time, who strongly emphasises shareholder value. Berkshire Hathaway (his company) is known for its disciplined approach to investing and acquisition, primarily aiming to increase shareholder value over the long term. Buffett values financial performance, efficient capital allocation, transparency, and risk management in the companies he invests in to create wealth for Berkshire Hathaway’s shareholders.
8.3 Measuring Shareholder Value
Measuring shareholder value provides insights into how effectively an organization generates returns for its investors. Below, we explore methods for measuring shareholder value and the impact of actively growing shareholder value versus stagnation or decline.
While many metrics cater to specific needs and nuances, three broad areas stand out for their impact on shareholder value: revenue growth, operating margin, and capital efficiency (see Figure 8.1). By examining the components within these areas, we gain a comprehensive insight into a firm’s financial health and potential for long-term success.
1. Revenue Growth:
Revenue growth is a fundamental indicator of a company’s expanding market presence. It can be driven by increasing volume, elevating prices, or combining both.
Volume: Growth in sales volume demonstrates that a company is successful in penetrating the market, perhaps due to effective marketing, a superior product, or expanding into new geographies or demographics. Increasing volume often reflects a growing demand for the company’s offerings.
Sales growth measures sales increase (or decrease) over a specified period. It’s an essential metric for determining the effectiveness of sales and marketing initiatives and gauging the company’s overall growth trajectory.
It is calculated using the formula:
(Current Period Sales − Previous Period Sales) / Previous Period Sales × 100
Price: Raising prices can reflect a company’s strong brand reputation, product differentiation, or limited competition. However, it’s a delicate balance, as excessive price hikes can alienate customers. But when executed correctly, it can indicate pricing power and enhance margins.
2. Operating Margin:
Operating margin reveals how much profit a company retains from its revenue after subtracting operating expenses. Two major components are Cost of Goods Sold (COGS) and Selling, General & Administrative expenses (SG&A).
COGS: The cost of goods sold represents the direct costs attributable to the production of the goods. A high COGS relative to revenue indicates lower production efficiency or higher material costs, which can squeeze margins.
The COGS Margin Ratio (often referred to as Gross Margin Ratio) is used to quantify this and measures the difference between total sales and the cost of goods sold (COGS) relative to total sales. It’s essentially the percentage of sales dollars left after subtracting the cost of goods sold, and it provides insight into the basic profitability of a company’s core business activities.
It is calculated using the formula:
Gross Profit / Total Sales (where Gross Profit = Total Sales – COGS)
SG&A: Selling, General & Administrative expenses encompass the indirect costs associated with selling products and the overall administration of the business. Efficient management of SG&A is crucial. Rising SG&A costs without proportional revenue growth can be concerning, implying inefficiencies or overspending.
SG&A expenses include salaries, commissions, advertising costs, rent for office space, utilities, office supplies, legal consultancies, and other overhead costs not directly tied to production.
3. Capital Efficiency:
Capital efficiency gauges how effectively a company uses its capital to generate profits.
PP&E: Property, plant, and equipment investments are essential for companies to maintain and grow operations. However, excessive or unproductive investments can drag down the return on capital. Regularly assessing these investments’ efficiency and utility ensures they yield the desired results.
Net PP&E represents the carrying amount of property, plant, and equipment on a company’s balance sheet. It’s the original acquisition cost of these tangible long-term assets minus accumulated depreciation, depletion, amortisation, and impairment.
It is calculated using the formula:
Gross PP&E + Capital Expenditures – Accumulated Depreciation
Inventory: Efficient inventory management is critical as excessive inventory can tie up capital and increase holding costs, while too little can lead to stockouts and lost sales. An optimal inventory level demonstrates a company’s ability to predict demand accurately and manage its resources effectively.
Inventory Management Costs are the costs associated with storing, tracking, insuring, and managing inventory. It includes warehousing costs, labor costs for handling inventory, insurance, taxes, costs related to perishability, and any costs associated with obsolete or excess inventory.
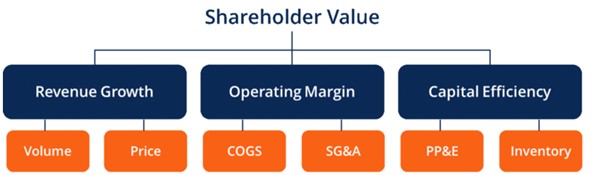
Figure 8.1 – Shareholder Value Metrics
Source: cio-wiki.org
8.4 The Impact of Actively Growing and Stagnating Shareholder Value
When shareholder value is actively grown, it results in:
i. Positive Returns: Actively growing shareholder value results in positive returns on investment, rewarding shareholders with capital gains and dividends.
ii. Investor Confidence: A company that consistently increases shareholder value gains investor confidence, leading to a higher stock price and attracting more investors.
iii. Competitive Advantage: Companies that prioritize shareholder value tend to be more competitive and innovative, as they have access to capital for investments in research, development, and expansion.
iv. Attracting Capital: A track record of growing shareholder value makes it easier for companies to raise capital through stock offerings or debt financing.
v. Talent Attraction and Retention: Growing companies often attract top talent as employees see opportunities for career advancement and financial rewards.
vi. Sustainability: A focus on growing shareholder value fosters a sustainable business model, ensuring long-term success and resilience in a dynamic market.
Conversely, when shareholder value stagnates or declines, several negative consequences may occur, including:
i. Investor Dissatisfaction: Shareholders become dissatisfied with their investments, potentially leading to divestment and decreased stock price.
ii. Lack of Investment: A decline in shareholder value can make it challenging to attract new investors or secure financing for growth and expansion.
iii. Reputation Damage: A company’s reputation can suffer if it fails to deliver value to shareholders, potentially impacting customer and stakeholder trust.
iv. Reduced Employee Morale: Stagnation or decline in shareholder value can lead to uncertainty and decreased employee morale.
v. Risk of Takeover: A struggling company with declining shareholder value may become a target for acquisition or hostile takeovers.
To illustrate the points above, consider the Apple Inc. case, a notable example of a company that has actively grown shareholder value over the years. Apple has consistently delivered value to its shareholders through innovation, strong product launches, and a focus on customer experience. Its market capitalization, stock price, and dividend payments have all grown significantly, attracting investors and ensuring a robust financial position.
8.5 Process Excellence: A Catalyst for Maximizing Shareholder Value
Process excellence plays a critical role in delivering returns and creating wealth for the shareholders of an organization. Below, we examine how process excellence is a stimulant for maximizing shareholder value.
i. Enhanced Efficiency: Process excellence streamlines operations, reducing inefficiencies and unnecessary costs. As shown in Figure 8.2, this efficiency leads to cost savings, directly contributing to higher profit margins and increased shareholder value. Reduced costs can free up resources for investments in innovation or dividend payouts. Process excellence can also enable revenue growth by optimizing sales processes, e.g. the Lead-to-Deal Closure process.
ii. Improved Quality: Organizations enhance the quality of their products and services by eliminating process defects and errors. Higher-quality products often command premium pricing, which can boost revenues and profitability, as demonstrated by Figure 8.2.
iii. Faster Time-to-Market: Efficient processes enable organizations to bring products and services to market more quickly. This agility can translate into a competitive advantage, increasing market share and shareholder value.
iv. Risk Mitigation: Effective process management minimizes the risk of compliance violations, operational disruptions, and other setbacks that can negatively impact shareholder value. This risk mitigation fosters investor confidence.
v. Customer Satisfaction: Streamlined processes often lead to improved customer experiences. Satisfied customers are more likely to remain loyal, increasing customer retention and the lifetime value of each customer, which benefits shareholders.
To bring the preceding points alive, we examine Amazon, a prime example of a company that has leveraged process excellence to maximize shareholder value. Its efficient supply chain and distribution processes have enabled the company to offer customers quick delivery and low prices. This operational excellence has driven revenue growth, increased market share, and attracted investors, leading to a substantial increase in shareholder value over the years.
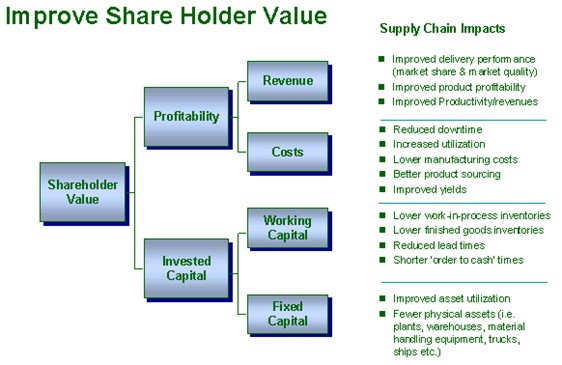
Figure 8.2 – Process Excellence and Shareholder Value
Case Study
Order-to-Cash Process, Malvern Panalytical
Problem
Malvern Panalytical produces instruments and services which combine advanced engineering, data analytics, and AI to improve product quality.
However, there was an opportunity to optimise the process, which enabled it to receive payments. For example, it took a lot of work to quickly determine which customers had outstanding payments and prioritise them accordingly, e.g., by payment amount or days outstanding. As a result, working capital was tied up as the organization failed to follow up with these customers promptly.
In addition, there appeared to be a significant amount of waste in the process, which could be eliminated.
How Process Excellence Enhanced Shareholder Value
The optimization initiative enabled process transparency, revealing that it took process performers c.12 minutes to compose differing versions of the same email to customers. Customers were not typically contacted regarding payment collection progress for about 120 days. The team could also clearly identify where the process bottlenecks occurred so they could effectively address these.
Improvements made to the process included the ability to quickly and easily send templated emails to customers and the implementation of a dashboard which categorised and displayed customers with outstanding payments with a RAG (Red-Amber-Green) status, enabling process performers to prioritise their work effectively. The team were also able to monitor collection progress daily.
Results
Days Sales Outstanding (DSO) was reduced by 50%, which released millions of pounds in working capital.
The team subsequently explored the feasibility of employing similar techniques to optimize their Lead-to-Order process, which facilitated reaching their billion-pound revenue goal in two years.
Finally, the process team was more engaged as they worked “smarter rather than harder”.
This case study illustrates how process excellence can contribute to shareholder value by freeing up working capital (see Figure 8.2).
Exercise 8.2

Course Manual 9: Social Responsibility
9.1 Introduction
Corporate Social Responsibility (CSR) refers to organizations’ ethical and voluntary initiatives to address social, environmental, and ethical issues beyond their legal obligations. It encompasses a company’s commitment to conducting its operations ethically and socially responsibly, beyond mere profit generation. CSR involves a proactive approach to contribute positively to society, stakeholders, and the environment. Key aspects of CSR include:
i. Ethical Conduct: Ensuring business activities are conducted with integrity and ethical principles.
ii. Environmental Stewardship: Implementing sustainable practices to minimize the ecological footprint of operations.
iii. Social Responsibility: Engaging in activities that benefit communities, employees, and society.
iv. Transparency and Accountability: Maintaining transparency in business operations and being accountable for the social and environmental impacts of the organization.
To better understand CSR, it is worth exploring Environmental, Social and Governance (ESG), a closely interconnected concept.
Environmental: ESG factors encompass environmental concerns, such as climate change, resource management, and pollution. CSR initiatives often address these issues through sustainable practices, carbon reduction efforts, and environmental conservation projects.
Social: The “S” in ESG covers social considerations, including employee welfare, diversity and inclusion, labor practices, and community engagement. CSR initiatives align with these aspects by promoting fair labor practices, charitable activities, and community development programs.
Governance: Governance principles are integral to both CSR and ESG. CSR involves adhering to ethical governance practices, ensuring transparency, and maintaining ethical behavior in corporate leadership.
This course manual provides a comprehensive understanding of CSR, why it holds paramount importance in contemporary business practices, how to measure the CSR position of the organization and how process excellence enables CSR.
9.2 Importance of Corporate Social Responsibility
Below, we discuss the significance of CSR and how it enables organizational objectives:
i. Enhanced Reputation: Companies with a strong CSR record often enjoy a positive reputation, which attracts customers, investors, and talent. This reputation can lead to a competitive advantage. As customers become more sophisticated and enlightened, ethical considerations have become critical buying criteria, leading many companies to highlight these as they promote their goods and services. Additionally, as we shall discuss in Course Manuals 11 and 12, a sense of purpose is a strong intrinsic motivator for employees, unleashing their creativity and drive. As such, top talent are likely to be drawn to organizations with an excellent CSR reputation and be motivated to contribute significantly towards achieving their objectives.
ii. Risk Mitigation: CSR helps identify and mitigate risks associated with ethical violations, environmental issues, or social controversies. Proactive CSR measures reduce the likelihood of costly legal and reputational crises.
iii. Sustainability: CSR fosters sustainable business practices, helping organizations thrive long-term. Sustainable practices conserve resources, reduce waste, and drive innovation. For example, many CSR initiatives minimise resource consumption, waste, and energy use, resulting in significant cost savings.
iv. Attracting Investment: Many investors prioritize ESG factors when making investment decisions. For example, green funds are investment vehicles that finance socially and environmentally friendly ventures. Companies with robust CSR programs are more likely to attract socially responsible investors.
v. Stakeholder Trust: CSR builds trust among stakeholders, including customers, employees, communities, and regulators, which is vital for business stability and growth.
vi. Social Impact: CSR initiatives can have a positive impact on society, contributing to poverty alleviation, education, healthcare, and community development.
vii. Innovation: CSR initiatives often drive innovation, leading to product or service enhancements that meet emerging sustainability demands.
viii. Market Opportunities: A commitment to sustainability can open up new markets and customer segments for a company.
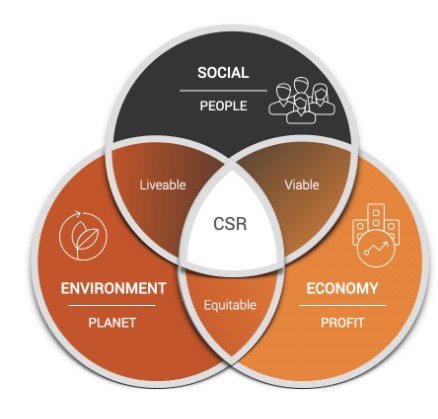
Figure 9.1 – Intersection of Economic, Environmental and Social Goals
Source: tgs-global.com
To reinforce these points, we briefly consider the example of Unilever, a company renowned for its robust CSR initiatives, including its Sustainable Living Plan launched in 2010 (see Figure 9.2). The company has committed to reducing its environmental footprint, promoting sustainable sourcing, and addressing social issues. Unilever’s CSR efforts enhance its reputation, drive innovation, reduce costs, and attract consumers who value ethical and sustainable products (see Unilever Sustainable Living Plan).
Exercise
9.3 What Key CSR Stakeholders Value
In this section, we explore the expectations and priorities of CSR stakeholders, encompassing a wide range of entities and interests.
i. Customers:
Ethical Products and Services: As discussed earlier, customers increasingly value companies that offer ethically produced goods and services, such as organic, fair trade, or environmentally friendly products.
Transparency: Customers seek transparency in business operations, from supply chain practices to product labeling. They want to know that the companies they support align with their values.
Social Responsibility: Customers appreciate companies actively engaging in social causes and community development. Supporting initiatives like poverty alleviation, education, and healthcare can resonate with customers.
ii. Employees:
Ethical Workplace: Employees value a workplace that upholds ethical standards, including fair wages, equal opportunities, and a safe environment.
Work-Life Balance: Companies that support work-life balance, employee wellness programs, and mental health initiatives demonstrate a commitment to employee well-being.
Community Engagement: Employees often value opportunities to engage in corporate-sponsored volunteering and philanthropic activities.
iii. Investors:
Sustainable Practices: Investors increasingly seek companies with sustainable business models and robust environmental, social, and governance (ESG) practices.
Transparency: Investors value transparent reporting of CSR efforts and their impact on financial performance and risk mitigation.
Long-Term Value: Investors prioritize companies that demonstrate a focus on long-term value creation rather than short-term profits.
iv. Communities:
Community Investments: Local communities appreciate companies investing in their well-being through job creation, educational support, and infrastructure development initiatives.
Environmental Stewardship: Communities value companies that take measures to reduce environmental impacts and minimize pollution.
Public Health and Safety: Companies prioritising public health and safety, especially in industries with potential hazards, garner community support.
v. Suppliers:
Fair Trade Practices: Suppliers value fair trade practices, including timely payments, transparent negotiations, and ethical sourcing.
Sustainability: Suppliers appreciate efforts to reduce waste, promote sustainable sourcing, and minimize the environmental impact of supply chain activities.
Collaboration: Collaboration with suppliers on CSR initiatives, such as reducing carbon emissions or ensuring ethical labor practices, is highly valued.
vi. Regulators and Government Bodies:
Compliance: Regulators value companies that adhere to legal requirements and industry regulations, ensuring a level playing field.
Transparency: Transparent reporting of CSR activities and adherence to disclosure regulations are highly regarded.
Positive Impact: Companies collaborating with regulators to achieve societal goals, such as environmental protection, receive regulatory support.
vii. NGOs and Activist Groups:
Alignment with Causes: NGOs and activist groups value companies that align with their causes and actively contribute to addressing social and environmental issues.
Collaboration: Collaborative efforts between companies and NGOs to address shared concerns demonstrate a commitment to meaningful change.
Exercise 9.2:
9.4 Measuring CSR Impact
Measuring the impact of CSR initiatives is crucial for assessing their effectiveness and distinguishing between genuine commitment and “greenwashing,” where companies falsely claim to be socially responsible. This section explores methods for measuring CSR impact, which requires a comprehensive and multi-dimensional approach.
Several methods and indicators are commonly used:
i. Key Performance Indicators (KPIs): Organizations establish KPIs related to CSR goals, such as carbon emissions reduction, community engagement, or diversity and inclusion metrics. These KPIs serve as benchmarks for measuring progress.
ii. Sustainability Reporting: Comprehensive sustainability reports provide a snapshot of CSR efforts, including data on environmental impacts, social initiatives, and governance practices. Reporting frameworks like GRI (Global Reporting Initiative) and SASB (Sustainability Accounting Standards Board) guide the disclosure of CSR data. See Figure 9.2 for an example of a Sustainability Impact Report.
iii. Social Impact Metrics: For social initiatives, metrics may include the number of jobs created, educational programs launched, or contributions to community development.
iv. Environmental Impact Assessment: To measure the environmental impact, organizations assess their carbon footprint, energy consumption, water usage, waste reduction, and adherence to environmental regulations.
v. Financial Performance: CSR initiatives can influence financial performance. Profit margins, return on investment (ROI), and stock performance are indicators of CSR’s impact on the bottom line.
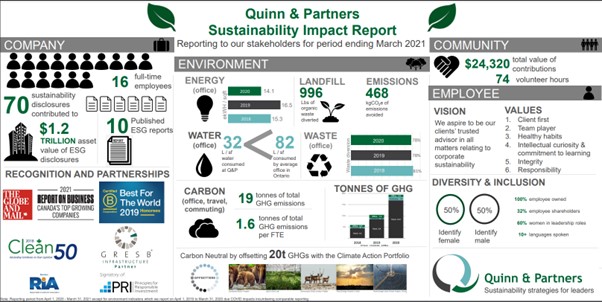
Figure 9.2 – Example of a Sustainability Impact Report
Source: quinnandpartners.com
These methods and tools are typically used to evaluate CSR initiatives using metrics such as the following:
i. Carbon Footprint:
This metric measures the total amount of greenhouse gases emitted from human activities, usually expressed in equivalent tons of carbon dioxide (CO2e).
It is calculated using the formula:
Sum of (Activity Data x Emission Factor) for each emission source.
A smaller carbon footprint indicates that a company is taking effective measures to reduce its contribution to global warming. This metric is vital in industries with significant emissions, such as manufacturing and transportation.
ii. Water Usage:
This tracks the total volume of water consumed or used by the company in its operations.
It is calculated using the formula:
Total Volume of Water Inflow – Total Volume of Water Treated & Released.
Reducing water usage showcases a company’s commitment to preserving natural resources, which is especially critical for businesses in water-intensive industries. This metric also resonates with consumers who are increasingly conscious of water conservation.
iii. Employee Volunteer Hours:
This metric measures the total number of hours employees dedicate to volunteer activities, often as a part of the company’s community service programs.
It is calculated using the formula:
Sum of all recorded volunteer hours by employees during a given period.
High volunteer hours indicate a corporate culture that emphasizes giving back to the community. It shows that the business supports and actively encourages its employees to make a social difference.
iv. Supplier Sustainability Score:
This metric evaluates a company’s suppliers based on their environmental, social, and governance (ESG) practices.
There isn’t a one-size-fits-all formula for calculating it, but companies typically create weighted scores based on factors like environmental impact, fair labor practices, and ethical sourcing.
A high sustainability score implies a supply chain that upholds robust ESG standards. It indicates that the company is ensuring that its business practices, even indirectly through suppliers, are responsible and sustainable.
v. Diversity and Inclusion (D&I) Metrics:
These metrics measure the diversity of a company’s workforce and its efforts to create an inclusive environment, including gender ratio, ethnicity representation, and inclusivity training program metrics.
There are multiple metrics under D&I, each with its calculation formula. However, one common metric is Gender Ratio, calculated as:
(Number of Female Employees / Total Employees) x 100%.
Greater diversity and better D&I scores suggest that a company values representation and actively works to eliminate biases and promote inclusivity in the workplace.
9.5 When CSR Goes Wrong
Section 9.2 examined the significance of CSR initiatives and how they enable an organization to achieve its objectives. In this section, we consider the reverse. i.e. the impact of poor CSR Practices. These include;
i. Reputational Damage: One of the most widely reported forms of poor CSR practice is greenwashing—making false or exaggerated CSR claims. When this is exposed, it can severely damage a company’s reputation, resulting in a loss of credibility and trust.
Greenwashing diminishes a company’s credibility and trustworthiness, making stakeholders skeptical of future CSR claims. For example, in the US, an environmental campaign group launched a lawsuit against Terracycle (a recycling company), which had partnered with several consumer goods firms to encourage potential customers to buy from these firms based on the premise that the plastic packaging would be recycled. However, free recycling was limited to specific customers. As part of the settlement package, Terracycle agreed to pay the environmental firm’s legal fees and provide transparency about how products are recycled.
ii. Customer Disillusionment and Potential Market Rejection: Customers and investors who feel deceived by greenwashing may abandon the brand, causing revenue losses and potentially impacting market share.
For example, consider Keurig Green Mountain (a beverage company) that marketed its K-Cups range as recyclable. However, consumers sued it in a class-action suit, which was reported settled for $10M.
iii. Legal Consequences: Misleading CSR claims can result in legal actions, regulatory fines, and penalties. Regulators may investigate companies suspected of greenwashing, leading to legal consequences and regulatory action. For example, Italian regulators slapped a EUR 5m fine on Eni (an Italian oil company) for false advertising claims about its green diesel.
iv. Competitive Disadvantage: Companies engaged in greenwashing may face competitive disadvantages as customers and investors favor genuinely responsible organizations.
v. Operational Disruptions: Ineffective CSR practices may lead to operational disruptions, protests, and supply chain issues.
vi. Market Volatility: Stock prices of companies exposed for greenwashing often experience volatility and adverse reactions from investors.
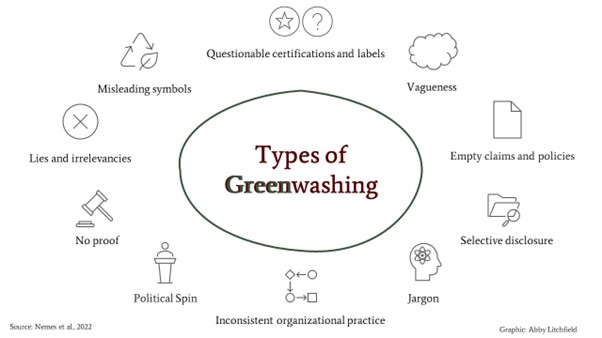
Figure 9.3 – Types of Greenwashing
Source: nbs.net
9.6 Process Excellence and CSR
This manual’s concluding section examines how process excellence enables and enhances CSR initiatives, creating a harmonious relationship that fosters sustainable business success.
i. Efficiency and Resource Conservation:
Streamlined Operations: Process excellence methodologies emphasize identifying and eliminating process inefficiencies, leading to reduced resource consumption, lower waste generation, and more efficient use of materials and energy. Figure 9.5 shows a process mining dashboard which displays the carbon footprint associated with a production process, providing the transparency required to prioritize optimization to reduce emissions.
Environmental Impact Reduction: Efficient processes often reduce carbon emissions, energy usage, and water consumption. These reductions align with CSR’s goals of minimizing environmental impacts.
ii. Quality and Ethical Standards:
Consistency: Process excellence promotes consistency and standardization in operations, reducing the likelihood of quality-related issues. Ensuring product or service quality aligns with ethical responsibility to customers.
Compliance: Ethical practices and compliance with industry standards are integral components of CSR. Process excellence helps ensure that all processes adhere to ethical standards and relevant regulations.
iii. Transparency and Reporting:
Data Collection and Reporting: Process excellence methodologies encourage data-driven decision-making. Organizations can leverage this data for transparent CSR reporting, demonstrating their commitment to stakeholders. Process mining optimises data collection and analysis and produces actionable insights as operational data is captured in Process-Aware Information Systems (PAIS). Figure 9.6 shows an executive dashboard which summarizes the carbon footprint associated with a production process created by a process mining tool. See “How Process Mining can turn Sustainability Targets into Action” for some real-life examples.
Stakeholder Engagement: Efficient processes free up resources that can be allocated to CSR initiatives. Engaging stakeholders in CSR efforts becomes easier when processes are well-managed and resources are available.
iv. Employee Engagement and Well-being:
Workplace Efficiency: Process excellence improves efficiency and reduces stress associated with redundant or inefficient tasks. Employees working in well-optimized processes are often more engaged and satisfied.
Health and Safety: Ethical responsibility includes ensuring the health and safety of employees. Well-managed processes help identify and address safety risks, contributing to employee well-being.
v. Supply Chain Management:
Ethical Sourcing: CSR initiatives often involve responsible sourcing practices. Process excellence helps organizations trace and monitor supply chains to ensure ethical sourcing, labor practices, and responsible procurement.
Supplier Collaboration: Efficient processes facilitate collaboration with suppliers, encouraging them to adopt CSR practices aligned with the organization’s values.
To illustrate the preceding points, consider Toyota, a pioneer in process excellence who demonstrate the synergy between process excellence and CSR through its Toyota Production System (TPS). TPS emphasizes waste reduction, efficiency, and continuous improvement to enable “car manufacturing..make more with less”. Toyota has leveraged these principles to achieve significant environmental and social impacts, including reducing greenhouse gas emissions, conserving resources, and improving worker safety. These efforts align seamlessly with Toyota’s commitment to CSR and sustainability.
Case Study
Fuel-to-Order Process, Lufthansa CityLine
Problem
The flight crew receives an Original Flight Plan (OFP) containing each flight’s planned route, forecasted weather, and estimated fuel consumption. Fuel consumption is calculated using a highly optimized algorithm that outputs the minimum fuel required. This figure includes a safety buffer to cater for unforeseen events and ensure maximum safety. As part of the preparation, fuel is ordered by the cockpit crew using the OFP estimation, which is then loaded on the plane. Waste in this process is additional fuel ordered but not required for the flight (fuel overload), which increases the flight’s carbon emissions. Fuel overload has two causes:
1. OFP estimation is too high (overestimation).
2. Over-ordering by crew who may decide to order more than the OFP estimate based on crew experience (overordering)
How Process Excellence Improved Environmental Sustainability
A digital process twin was built based on historical data for eight months and 58,000 flights, providing transparency into changes, the ability to drill down into individual flights, overestimation and overordering percentages.
It was discovered that closer to the departure time, more changes to the OFP occurred. Pilots did not have up-to-date information, so they typically ordered more fuel than required. An improvement opportunity was identified to share up-to-date information with the crew closer to when the fuel was ordered.
Results
The organization managed a reduction of the CO₂ footprint of its airline operation using the process optimization techniques described above.
Source: Celonis.com
Exercise 9.3

Course Manual 10: Implementing Excellence
10.1 Introduction
As we have established in the preceding courses, achieving process excellence is paramount for organizations seeking to thrive in competitive markets. However, while technology, tools, and methodologies play significant roles in this journey, it is essential not to overlook the pivotal element of people.
This course explores the process excellence journey and underscores the importance of the people element in achieving sustained success.
10.2 The Process Excellence Journey
The process excellence journey is a systematic and disciplined approach to improving an organization’s processes, aiming to deliver consistent and superior outcomes. The journey towards process excellence can be visualized as a continuum, starting with scattered improvements and culminating in continuous innovation (see Figure 10.1). This section will chart this journey, highlighting the key stages and their inherent characteristics.:
i. Scattered Improvements
At this initial stage, improvements are ad hoc and sporadic. They arise primarily from individual initiatives rather than being driven by an organizational strategy. The changes might address immediate problems but often lack cohesion with broader organizational goals.
The piecemeal nature of improvements at this stage often leads to inconsistencies across the organization. Without a clear framework or guiding strategy, efforts may overlap or contradict each other.
Despite its limitations, this stage is crucial as it reflects the organization’s recognition of the need for change and fosters a culture of improvement.
ii. Systematic Improvements
Progressing from scattered efforts, organizations now adopt a more structured approach. Systematic improvements involve planned, coordinated efforts that align with the company’s objectives. Process improvement methodologies such as Six Sigma or Lean might be adopted to identify inefficiencies and develop solutions.
Implementing systematic improvements requires a shift in mindset. Organizations must ensure that staff are trained, buy-in from leadership is secured, and the chosen methodologies suit the company’s unique needs.
This stage yields more predictable and consistent results. With a structured approach, organizations can better measure the impact of their efforts and ensure alignment with their strategic goals.
iii. Continuous Improvements
At this stage, the focus shifts from episodic changes to an ongoing commitment to excellence. Continuous improvements involve regular evaluations, feedback loops, and iterative enhancements. Techniques like Kaizen, which emphasizes small, daily changes, have become predominant.
Maintaining momentum is a common challenge. The organization must instil a culture where every employee feels responsible for identifying and implementing improvements.
Continuous improvements lead to sustainable growth. As processes are constantly refined, organizations can quickly adapt to changing market conditions and customer demands, ensuring long-term success.
iv. Continuous Innovation
At the pinnacle of the process excellence journey is continuous innovation. Here, organizations not only seek to refine existing processes but also to reimagine and reinvent them. The mindset shifts from mere enhancement to transformative change, leveraging emerging technologies and novel methodologies.
Balancing the pursuit of groundbreaking innovations with the need to maintain day-to-day operations can be tricky. Organizations must have the infrastructure and culture to support and nurture innovative ideas.
Organizations that achieve continuous innovation can position themselves as industry leaders, setting the pace for competitors and consistently delivering exceptional value to stakeholders.
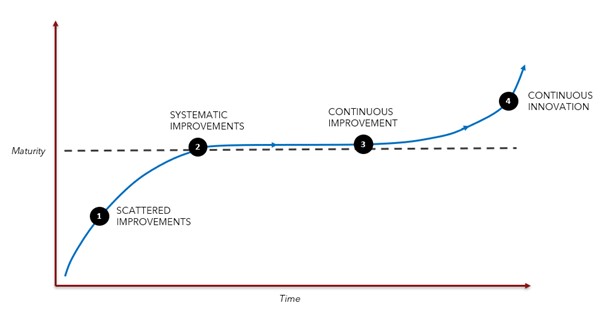
Figure 10.1 – The Process Excellence Journey
Exercise 10.1
10.3 The Importance of the People Element
At each phase of the process excellence journey, the people element is the linchpin that holds the entire journey together. Below, we explore why:
i. Leadership and Culture: Effective leadership is vital in driving the process excellence journey. Leaders set the tone, communicate the vision, and inspire their teams to embrace change. A culture that values innovation, learning, and collaboration is essential for success.
ii. Change Management: Implementing new processes or changes to existing processes often disrupts the status quo. People naturally resist change; without proper change management, the process can encounter resistance and fail. Skilled change managers can help employees navigate transitions smoothly.
iii. Skill and Training: People need the necessary skills and knowledge to execute processes effectively. Training programs ensure employees understand their roles and responsibilities within the new processes, reducing errors and improving efficiency.
iv. Continuous Improvement: The process excellence journey relies on the insights and feedback of employees who work directly with the processes. They are often the best source of ideas for optimization and innovation, making their involvement crucial.
v. Motivation and Engagement: Engaged employees are likelier to take ownership of their roles and contribute to process improvements. Recognizing and rewarding employees’ contributions to the journey can boost morale and motivation.
vi. Flexibility and Adaptability: In a rapidly changing business environment, the ability of employees to adapt to new processes and technologies is paramount. Organizations must invest in developing a workforce that can embrace change and stay agile.

Figure 10.2 – Interaction of People, Process and Technology in the Process Excellence Journey
Source: blog.insresearch.com
We revisit the Italian white goods manufacturer mentioned in Course Manual 6 (Section 6.5) to illustrate the points mentioned above. The employees from a selected production line were trained in Lean process improvement methods to eliminate waste from the process. Among others, they learnt how to improve the flow of work-in-process by implementing pull (as opposed to push mechanism). They worked with Lego cars in the training, creating a safe learning zone.
By the end of the two-day training session, the team had improved their Lego car-building process by reducing defects and inventory while increasing productivity.
Subsequently, the management team gave the production line team the latitude to redesign and implement their process in two weeks. The workers were so energized some came in over the weekend to finalize their plans. Additionally, the employees designed innovative ways to improvise and overcome challenges, e.g., using trolleys from the local supermarket as a production cart to move required inventory.
Within two weeks, the process had been re-designed and was operational. In addition, the team was so motivated that when the union attempted to block the changes, the workers stood up to them, and the union relented. Within three months, the Lean production line reduced internal defects by 30%, increased productivity by 25% and reduced in-plant inventory by 90%
By contrast, defect rates and inventory in the other production lines which didn’t implement Lean remain unchanged.
10.4 Leveraging Neuroscience for Process Excellence
Organizations often focus on methodologies, tools, and data analysis in the pursuit of process excellence. However, as we established in the previous section, people are critical to that journey. To optimize the people aspect, we examine the field of neuroscience, which explores the inner workings of the human brain. By delving into the brain’s mechanisms, particularly the seeking system, organizations can implement process excellence more effectively, obtain buy-in from leaders, and foster higher levels of employee engagement.
The Seeking System
The human brain is a complex organ, and understanding its functions can provide valuable insights into the challenges of implementing process excellence. One crucial aspect of the brain’s functionality is the human brain’s seeking system, a neural network that runs between the prefrontal cortex & ventral striatum (see Figure 10.3). Coined by neuroscientist Jaak Panksepp, the seeking system is a fundamental neurobiological mechanism that drives humans to explore, learn, and innovate. It’s essentially the brain’s built-in curiosity and motivation engine.
The seeking system operates through the release of neurotransmitters like dopamine, which reward the brain for exploring new territories, acquiring knowledge, and achieving goals. This system plays a pivotal role in various aspects of human behavior, including decision-making, creativity, and engagement. In the context of process excellence, tapping into the seeking system can be highly beneficial.

Figure 10.3 – The Mesolimbic Neural System
Source: openbooks.lib.msu.edu
Obtaining Buy-In from Leaders
It is essential to secure buy-in from organizational leaders to make progress on the process excellence journey. This is essential because senior management sets the tone for the organization, and they must be committed to the process.
Neuroscience research has offered insight into how to get buy-in from senior management. Below, we explore how understanding the workings of the human brain, particularly the seeking system, can help achieve this in several ways:
i. Leadership Sense of Purpose and Legacy
Leaders are typically concerned about their legacy. As we shall explore in succeeding course manuals, research has demonstrated that organizations that create a framework that activates their employees seeking systems positively impact their health and well-being and ensure that the organization remains relevant and flexible. Assisting leaders to realize this encourages them to shift their personal mission to locating opportunities to trigger rather than inhibit employee’s seeking systems.
We will explore mechanisms for activating the seeking system in the remaining course manuals for this workshop. As leaders establish these mechanisms and assist their employees in finding purpose at work, they experience more significant meaning and purpose in their roles.
.
ii. Servant (Humble) Leadership
As illustrated by the case study for this course manual, leadership style has a role in activating employee’s seeking system. Servant leadership – a leadership philosophy in which the leader’s primary goal is to serve others – is significantly more effective than emphasising hierarchy when leaders are trying to activate employee’s seeking system. Servant leaders listen to, and understand the needs of their team and are receptive to learning from them. These leaders encourage others to develop fully and try new concepts at work. Servant leaders don’t simply “talk the talk”; they set an example for their team, emphasising the value of learning and trying new things, enabling them to grow by being willing to make mistakes, accept their limitations, and be receptive to observation and hands-on learning.
iii. Highlighting the Reward:
As we shall establish in the succeeding course manual, it is sub-optimal to utilise KPIs and metrics to motivate employees as it activates the fear system (which suppresses the seeking system). However, for the leaders of an organization, these KPIs can be motivating as they demonstrate progress towards organizational objectives to relevant stakeholders (e.g., shareholders) and, in some cases, are required (e.g., by regulators). As such, leaders are more likely to embrace process excellence initiatives if they are shown how these can lead to tangible rewards such as improved efficiency, cost savings, and competitive advantages.
Obtaining Employee Buy-In
Employee engagement and buy-in are other critical factors in the success of process excellence initiatives as they often represent the “brains” and “hands” that propel the journey forward. Understanding the seeking system can be instrumental in fostering higher levels of engagement among employees:
i. Fostering Intrinsic Motivation:
The seeking system is associated with intrinsic motivation, the internal drive to engage in an activity for its inherent satisfaction. It differs from extrinsic motivation, where employees are motivated by a reward or to avoid punishment (see Figure 10.4). When employees perceive their work as an opportunity to explore, learn, and make a meaningful contribution, their intrinsic motivation is activated, leading to higher engagement and commitment to process improvement.
Additionally, employees are more likely to support initiatives that pique their curiosity and align with their innate desire to explore and innovate. Presenting the process excellence journey as an opportunity for exploration and growth can captivate their interest.
ii. Experimentation
Establishing experimental safe spaces is another method to stimulate people’s seeking systems. As demonstrated by the case of the Italian white goods manufacturer (see Section 10.3), these safe spaces can be set up using objects like Lego or in virtual reality spaces. Serious play (so-called because it is related to business operations) is essential because it activates the seeking system, reducing activity in the brain system that controls negative emotions. Because they foster innovation, experimental safe zones also foster intrinsic motivation, which is more potent than extrinsic motivation (see Figure 10.4 below). When workers are motivated by their excitement and interest (intrinsic) rather than pay rises or promotions (extrinsic), their attitude about the change will likely be more positive.
iii. Framing Changes as Learning Opportunities:
Process performers will likely need to learn new working methods during the process excellence journey. They are also likely to encounter challenges and setbacks during the journey. By framing these changes as opportunities for learning and growth, employees are more likely to be open to adopting them.
This is essential as, although employees typically claim to be receptive to new ideas and change, they are often resistant to them. To illustrate, Chapter five of Alive at Work) reports the findings of a study by Amy Edmondson from Harvard University, who researched why a medical team failed to adopt a novel approach to open heart surgery, even though it was less intrusive, painful and required less recovery time. It turns out that even highly skilled doctors were apprehensive about the treatment because it was novel and required specialised equipment to access the heart. There was a risk of failure with the new method. The study’s key lesson is that framing changes to previous ways of working as opportunities for experimentation and learning are crucial to activate the seeking system.
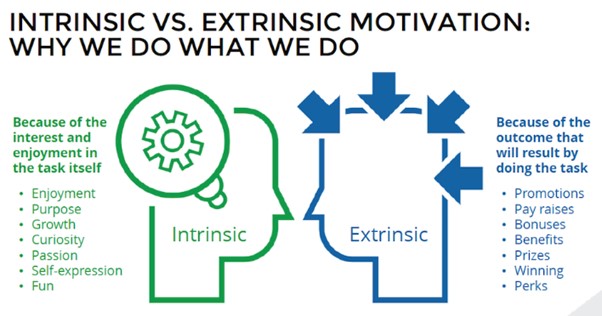
Figure 10.4 – Intrinsic versus Extrinsic Motivation
Case Study
Consumer Banking Division, Standard Chartered Bank, China
Problem
Due to the prevailing cultural norms, the executives in the organization were viewed as “superior commanders”, a leadership style in which hierarchy and power distance were stressed. This resulted in elevated anxiety levels during leadership visits to the various branches, and experimentation and creativity were suppressed. Employees tended to keep their improvement ideas to themselves, and the bank’s employee attrition rate was one of the highest among foreign banks in China.
How Servant Leadership Improved Customer Satisfaction and Employee Engagement
The new Head of Consumer Banking decided that the previous leadership approach was not productive and decided to actively signal a change to a servant leadership style during branch visits. The changes included:
1. Leadership visits to branches would be unannounced
2. Executives would serve branch employees breakfast at the start of the visit
3. The executive would meet with branch employees in small groups to listen to their ideas about their pain points and how service provision could be improved
Many innovative ideas resulted from these visits. For example, in one branch located in a shopping mall, the branch employees suggested that the opening hours be changed to mirror that of the mall, even though that would result in weekend work. After this change, the income generated on weekends exceeded that generated during weekdays. In another branch, the staff identified an untapped pool of local, highly skilled talent that the bank could target. After receiving approval, the employees enthusiastically implemented the suggestions, resulting in that branch having the highest direct sales productivity in the entire China network.
Additionally, employees began posting pictures and news about the visits on Weibo (a popular Chinese Social Media site), ensuring the authentic and organic spread of this initiative’s positive impact.
Results
Over the two years this initiative was in place, customer satisfaction increased by 54%.
During the corresponding period, there was a 29% decrease in customer complaints.
The bank’s employee attrition rate was reduced to the lowest among all the foreign banks in China.
Source: Alive at Work (Chapter 7)
Exercise 10.2

Course Manual 11: Change Culture
11.1 Introduction
Change is an inherent aspect of the process excellence journey. As organizations progress toward consistently delivering positive process outcomes, they must adapt to new technologies, market dynamics, and competitive landscapes. The culture within an organization plays a pivotal role in determining its readiness and ability to embrace change. This course manual explores the concept of organizational change culture, provides a spectrum of cultures that either support or stifle change and examines how to move an organization towards a change-ready culture.
11.2 Definition of Organizational Change Culture
Organizational culture refers to the shared values, beliefs, norms, customs, and practices that shape the behaviors, attitudes, and interactions of members within an organization. It influences how employees relate to one another, make decisions, and approach their work, thereby defining the character and personality of an organization.
Edgar Schein posited that organisational culture exists at three levels – artifacts, espoused values and underlying assumptions (see Figure 11.1 below). These levels influence each other in both directions.
Artifacts are the most visible level of organizational culture and include physical items (e.g., dress codes, office logos), behaviours (e.g., team practices) and verbal interactions (e.g., jokes, anecdotes and stories).
Espoused values include the goals, standards, norms and rules that organizational members care about. For example, we highlighted in Course Manual 9 that employees in many organizations typically care about ethical workplaces, work-life balance and community engagement.
Finally, underlying assumptions are the least visible aspect of organization culture, which influences how employees perceive and interpret activities, events and stimuli within the organization. An example of an assumption is the degree to which competition or collaboration between individuals, internal teams or external organizations is preferred.
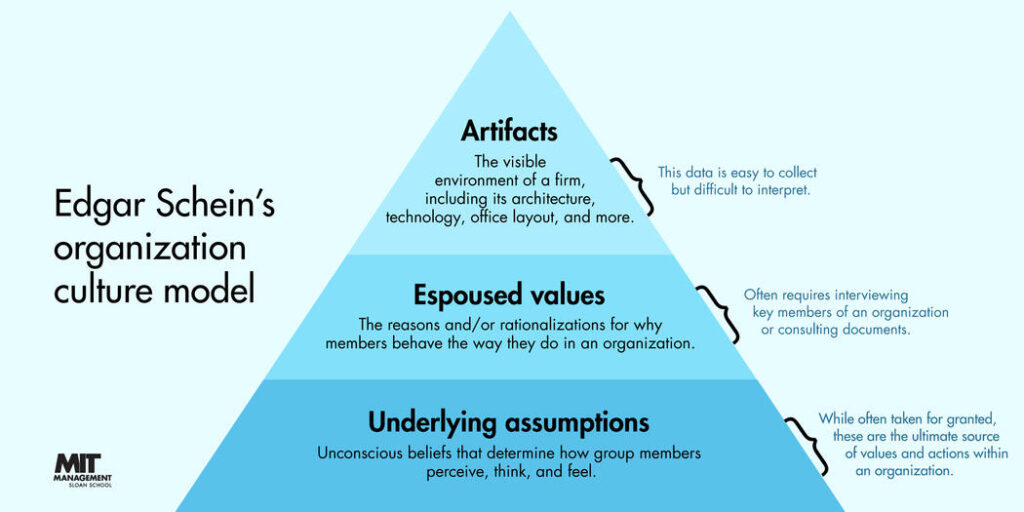
Figure 11.1 – Schein’s Organizational Culture Model
Source: mitsloan.mit.edu
Extending the concept above, organizational change culture refers to the shared values, beliefs, attitudes, and behaviors within an organisation regarding change. It reflects the organization’s capacity to recognize the need for change, effectively plan and implement it, and sustain it over time. A healthy change culture is characterized by an organization’s ability to embrace change as a natural part of its evolution, viewing it as an opportunity for growth and development rather than a threat to stability.
11.3 Spectrum of Organizational Change Cultures
Although many models exist to classify organizational culture (e.g., Harrisons and Stokes Typology, Jones and Goffee’s Typology and Cameron and Quinn’s Competing Value Framework, etc.), we shall adopt the Integrated Culture Framework model proposed by Boris Groysberg et al. (see “The Leader’s Guide to Corporate Culture”) due to its explicit focus on organizational response to change.
The authors classify organization culture along two main dimensions: how people respond to change (ranging from Flexibility to Stability) and how they interact (ranging from Independence to Interdependence – see Figure 11.2)
Based on the organization’s position in one of the four quadrants, they propose eight organizational culture types as follows:
i. Caring Culture:
Mutual trust and relationships are emphasized in organizations with a Caring culture. Workplaces are friendly, cooperative, and hospitable places where people support and care for one another and leaders strongly emphasise building connections and teamwork.
ii. Purpose Culture:
Purpose cultures are driven by idealism and selflessness. Workplaces are welcoming, caring spaces where individuals strive to improve the world’s long-term prospects.
Focusing on sustainability and global communities unites employees, and executives emphasise sharing common values and contributing to a larger purpose.
iii. Learning Culture:
Creativity, discovery, and expansiveness are the hallmarks of organizations with a Learning culture. People spark fresh ideas and consider alternatives in creative, accepting work environments. Workers are unified by inquisitiveness; leaders prioritise creativity, learning, and exploration.
iv. Enjoyment Culture:
Organizations with this type of culture encourage employees to act in a lighter manner and pursue their happiness in work contexts. Playfulness and stimulation bring employees together, and executives value humour and spontaneity.
v. Results Culture:
Results-driven organizations tend to emphasize success and achievement. People strive to achieve peak performance in outcome-oriented, merit-based work environments. The desire for success and capacity is a driving force, and leaders strongly emphasise reaching objectives.
vi. Authority Culture:
Boldness, decisiveness, and strength are characteristics of the Authority culture. People compete in work situations to obtain a personal advantage. Strong leadership is prevalent that emphasises confidence and domination.
vii. Safety Culture:
Preparation, prudence, and foresight are emphasized in organizations with a Safety culture. People who work in these organizations are typically cautious about taking risks, as this is discouraged by the organization overtly or otherwise. Leaders stress the importance of being realistic and planning forward, while employees exhibit behavior intended to protect themselves.
viii. Order Culture:
Employees in organizations with an Order culture typically follow the rules and strive to blend in. Leaders encourage standardization and proven working methods, and employees are discouraged from deviating.
It is worth noting that an organization may have a primary and secondary culture type (e.g., purpose and caring). However, these are typically close on the chart (see Figure 11.2), and organizations are unlikely to exhibit “opposing” cultural styles, e.g., safety and learning, which are farther apart.
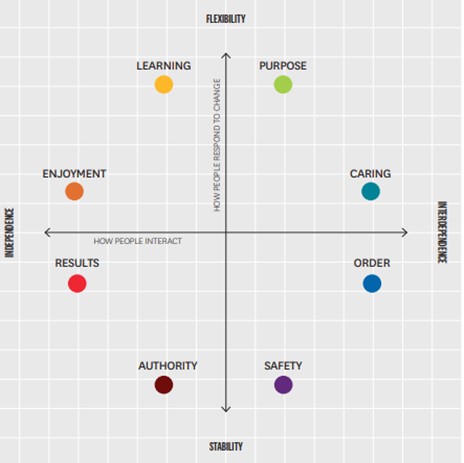
Figure 11.2 – Integrated Culture Framework
Exercise 11.1
We further extend the Integrated Culture Framework model to define an organization’s change culture spectrum as described below:
i. Change-Resistant Culture: On one end of the spectrum, we find organizations with a deeply ingrained resistance to change. In these cultures, employees may view change as disrupting their routine and threatening job security. There’s a strong attachment to existing processes and a reluctance to embrace new ideas or technologies. Change-resistant cultures stifle innovation and hinder progress, often leading to organizational stagnation. Organizations with Safety and Authority cultures often lie at this end of the spectrum.
ii. Compliance-Oriented Culture: Moving slightly along the spectrum, some organizations have a culture that is not inherently resistant to change but tends to view it as a mandate from leadership. In these cultures, employees comply with changes primarily because they are told to do so. While change may occur, it often lacks enthusiasm and is met with passive resistance. Such cultures may adapt to change when necessary but miss the full benefits of innovation and agility. Organizations with Order and Authority cultures tend to align with this change culture type.
iii. Traditional Culture: Organizations with traditional cultures possess a mix of stability and adaptability. They are often open to change, but it tends to be gradual and cautious. Employees in these cultures may be more willing to embrace change if it aligns with established norms and values. However, radical or disruptive changes might face resistance. Organizations classified as Results or Order-oriented will likely be in this change culture category.
iv. Change-Ready Culture: In the middle of the spectrum, we find organizations with a culture characterized by readiness and openness to change. Employees in these cultures understand the importance of innovation and continuous improvement. They actively seek opportunities to implement changes and view challenges as learning experiences. Change-ready cultures thrive in dynamic environments and are more likely to excel in innovation-driven industries. Caring and Enjoyment organizational cultures are closely associated with change readiness.
v. Change-Enabling Culture: At the far end of the spectrum is the change-enabling culture. These organizations not only embrace change but actively nurture and encourage it. Employees are empowered to suggest and drive change initiatives. There’s a culture of experimentation and risk-taking, where failure is viewed as a stepping stone to success. Change-enabling cultures excel in rapidly evolving industries and are often industry disruptors themselves. Organizations with Learning and Purpose cultures will likely be at this end of the change culture spectrum.
Exercise 11.2
11.4 Assessing an Organization’s Position on the Change Culture Spectrum
Understanding an organization’s position on the change culture spectrum is a crucial first step in managing and implementing successful organizational change initiatives. The change culture spectrum spans from change-resistant organizations, where innovation is met with resistance, to change-enabling organizations that actively foster and encourage change. In this section, we explore the methods and strategies for assessing where an organization stands on the change culture spectrum.
i. Surveys and Questionnaires:
One of the most common methods to assess an organization’s change culture is through surveys and questionnaires. These tools can be designed to gauge employees’ attitudes, beliefs, and perceptions regarding change. Questions may focus on their comfort with change, past experiences, and their perception of the organization’s willingness to change. Analyzing the responses can provide valuable insights into the prevailing change culture.
ii. Interviews and Focus Groups:
Conducting interviews and focus groups with employees, managers, and leaders can provide a more qualitative understanding of the organization’s change culture. Open-ended questions can uncover hidden beliefs, concerns, and insights that quantitative surveys might miss. Leaders and managers can also share their perspectives on the organization’s readiness for change.
iii. Observation and Behavioral Analysis:
Observing how employees and leaders react to change initiatives in real time can offer valuable insights into the organization’s change culture. Look for signs of resistance, enthusiasm, or apathy during the implementation of changes. Analyze how quickly employees adapt to new processes and technologies and assess the organisation’s innovation and risk-taking level.
iv. Review of Past Change Initiatives:
Examining the organization’s history of change initiatives can reveal patterns and trends. Analyze the success or failure of previous changes, the speed of adoption, and the level of employee engagement during those initiatives. This historical perspective can indicate whether the organization leans toward a more resistant or enabling change culture.
v. Benchmarking Against Industry Peers:
Benchmarking involves comparing the organization’s change culture to industry peers or competitors. Industry research and surveys can provide valuable data on common practices and attitudes toward change. This external perspective can help assess whether the organization is ahead, behind, or in line with industry norms.
These methods and tools are typically used to evaluate CSR initiatives using metrics such as the following:
i. Change Readiness Assessment:
This metric measures an organization’s preparedness for change, considering factors like leadership support, stakeholder buy-in, and resource availability.
Typically, this is a qualitative metric based on surveys or interviews, often scored on a scale (e.g., 1-10).
High readiness scores indicate an organization has the infrastructure and mindset necessary to manage change effectively. Conversely, low scores suggest areas of improvement or potential resistance to change.
ii. Employee Turnover Rate Post-Change:
The metric indicates the percentage of employees leaving the organization after significant change initiatives.
It is calculated using the following formula:
(Number of employees who left post-change / Average number of employees during the change period) x 100%.
High turnover post-change can indicate a culture resistant to change or ineffective change management. It suggests employees might be uncomfortable or dissatisfied with the changes made.
iii. Stakeholder Engagement Score:
This quantifies the level of involvement and buy-in of key stakeholders during change initiatives.
It is often derived from surveys, where stakeholders rate their engagement on a scale.
High engagement scores indicate that stakeholders feel involved and committed to the change, which can significantly drive a successful change initiative. Low scores may suggest apathy or resistance among critical players.
iv. Change Adoption Rate:
This metric measures the pace and extent to which the intended users adopt and use a new system, process, or behavior after a change initiative.
It is calculated using the following formula:
(Number of users adopting the change / Total number of intended users) x 100%.
A high adoption rate implies that the change was well-received, understood, and integrated by the employees. A slow or low adoption rate may indicate a lack of understanding, training, or resistance to the new system or process.
v. Post-Change Performance Metrics:
These are a set of Key Performance Indicators (KPIs) that measure the success of a change initiative in terms of organizational performance. These metrics include post-change sales growth, change in customer satisfaction or operational efficiency scores.
Improvements in these metrics post-change indicate that the change initiative positively impacted performance. Declines or stagnation might suggest that the change did not have the desired effect or that there are implementation issues.
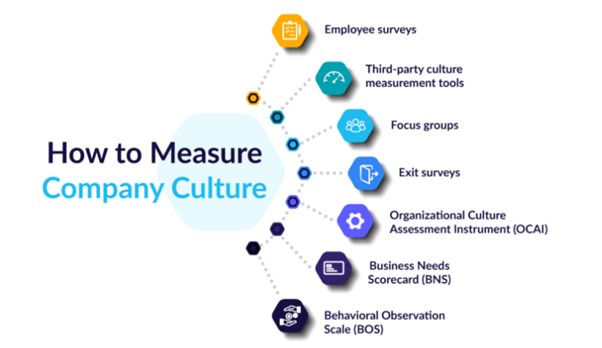
Figure 11.3 – Organizational Change Culture Measurement
Source: aihr.com
11.5 Moving Towards a Change-Enabling Culture
As previously established, organizational change culture is critical in determining an organization’s ability to adapt, innovate, and thrive. The spectrum of change cultures, ranging from change-resistant to change-enabling, illustrates organisations’ diverse attitudes and behaviors. However, few organizations possess a pure change-enabling culture, resulting in a need to nudge the culture in that direction. Below, we discuss several recommendations for moving the organisation’s culture towards the change-enabling end of the spectrum.
i. De-emphasize Target Metrics and KPIs
This recommendation might appear counter-intuitive as previous course manuals have emphasized the importance of metrics. We reiterate the point that metrics are critical. As highlighted in Course Manual 10, they demonstrate progress towards organizational objectives to relevant stakeholders (e.g., shareholders) and, in some cases, are required (e.g., by regulators). However, neuroscience research has demonstrated that using target KPIs and metrics to motivate employees activates the fear system, especially if these targets are associated with deadlines and repercussions for missing them. Our fear system is activated in response to threats, and the amygdala—an almond-shaped structure located in the brain’s temporal lobe—sends messages to our autonomic nervous system. Fear causes physiological reactions; for instance, it sharpens our senses of smell, hearing, and touch, causing us to focus more intently and filter out irrelevant information. However, the seeking system is suppressed when the fear system is activated. The following recommendations are proven to motivate employees better, and these also move critical metrics in the right direction.
ii. Servant (Humble) Leadership
Neuroscientific research has demonstrated that the critical factors that drive significant changes and ensure they persist are emotional rather than logical. Real change is not accomplished by merely rewarding people and appealing to their logic. As we shall establish, organizations that engage their employee’s emotions by appealing to their sense of purpose and innate need for self-expression facilitate and enable change. As humans are natural problem solvers, employees are inherently creative and adaptable. Organizations need to activate their employee’s seeking system, resulting in better goods and services. The case study for Course Manual 10 demonstrates that a servant leadership style achieves this objective.
iii. Sense of Purpose
A sense of purpose is sparked when employees recognize the connection between their contributions and outcomes (especially when these are positive). Their sense of purpose increases when they can provide feedback on improvement opportunities or experience firsthand how important their work is to others.
There are two main ways to assist employees in creating a sense of purpose. First, creating opportunities for them to observe how their work affects other people (e.g., end customers, society at large) and secondly, assisting them to create a narrative for their role.
However, it is essential to note that enabling a sense of purpose in employees can be challenging since it is very personal and emotional – two individuals may assign different meanings to the same experience. For example, an employee might interpret an opportunity to interact with end customers as manipulative, whilst another might view the experience as inspirational. This highlights the need to ensure congruence at the three culture levels (see Section 11.2), e.g., informal jokes, anecdotes, recognition and rewards systems, formal communication, etc.
iv. Implementing a Strengths-Based System
A strengths-based approach focuses on identifying and nurturing individual employees’ talents and strengths rather than randomly assigning them roles or tasks (which may or may not align with these strengths). By recognizing and utilizing employees’ unique capabilities, organizations can empower them to explore new areas and take on roles that align with their strengths. This approach increases job satisfaction and activates the seeking system, as employees are more likely to engage in tasks they excel at and find fulfilling. Managers and leaders should regularly engage in discussions with employees to identify their strengths and provide opportunities for them to apply them to their work.
v. Self-Reflective Titles:
Traditional job titles often limit employees’ perceptions of their roles, locking them into predefined expectations. To activate the seeking system, organizations can adopt self-reflective titles (alongside formal titles) that encourage employees to think beyond their current job descriptions. For example, a “Software Developer” could become a “Digital Innovator,” signaling a broader scope of responsibilities, including exploring new technologies and creative solutions. These titles inspire a sense of purpose and convey the organization’s commitment to supporting employee growth and innovation.
Self-reflective titles are more than just catchy – they promote psychological safety by fostering open communication and altering the organisational culture to encourage knowledge sharing and original ideas. Self-reflective titles promote self-expression and introspection, which nurtures good feelings and a stronger sense of purpose.
vi. Promoting Serious Play and Experimentation
As discussed earlier, serious play refers to structured activities that encourage creativity, experimentation, and problem-solving. Organizations can incorporate serious play into their culture by providing dedicated spaces or time for employees to brainstorm, prototype, and explore ideas without the fear of failure. This could involve innovation labs, hackathons, or cross-functional workshops. Encouraging playfulness and experimentation in a controlled environment activates the seeking system, as employees feel free to explore unconventional approaches and generate innovative solutions.
Experimentation allows employees to explore within guardrails and devise low-risk, low-cost methods for testing and prototype ideas. Employees must also feel ownership and implementation are not outsourced, as demonstrated by the case of the Italian white goods manufacturer discussed in Course Manual 10 (Section 10.3).
In Workshop 8, we shall explore simulating process scenarios and experimenting with various parameters to analyze the potential impact of process changes on performance metrics, resource utilization, and other vital factors, providing a powerful tool to assess the effectiveness of process improvement solutions in a controlled environment.
Case Study
Raw Materials-to-Tyre Production Process, Nokian Tyres
Problem
Though the company provided a generous remuneration package including free refreshments and healthcare, a fantastic canteen with a variety of food options and even the opportunity to buy company-built homes at a price lower than market value, some of the employees were losing their motivation for a variety of reasons, e.g., mastering their roles and requiring more work satisfaction.
How a Purpose Experience Contributed to a Change-Ready Culture
To mark the launch of its new winter tyre, the organization selected and sponsored a group of employees to attend the launch event. At the event, they got the opportunity to interact with a test driver for the company, who was also the official world record holder for the fastest car on ice. The driver shed light on how the winter types enabled him and his vehicle to achieve optimal performance. The employees also had an opportunity to try out the tyres on a pure ice surface.
For many of the employees who had previously only focused on the specifics of their jobs, the experience enabled them to observe how their work added value, enhancing their sense of meaning and purpose.
Results
Following the event, the increased sense of purpose felt by the launch event attendees spread to other employees, impacting the overall organizational culture. A dramatic improvement was evident in 5S practices (see Figure 11.4 below), together with a reduction in defect rates and absenteeism levels.
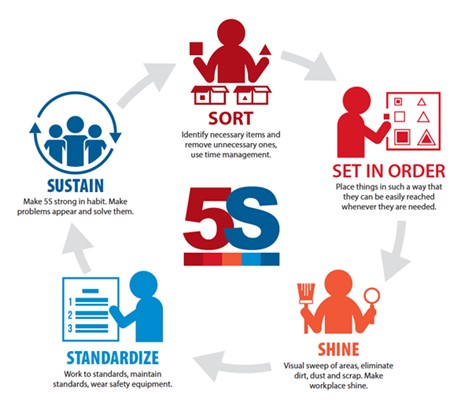
Figure 11.4 – Lean 5S Principles
Source: Alive at Work (Chapter 8)
Exercise 11.3

Course Manual 12: Sustaining Excellence
12.1 Introduction
As established in Course Manual 10, Process Excellence is a continuous journey that organizations embark upon to improve operations, reduce defects, and consistently produce high-quality output. The journey contains four stages – Scattered Improvements, Systematic Improvements, Continuous Improvements and Continuous Innovation. However, as organizations move within and across stages, they are likely to experience changes in momentum, including losses and gains in mass, direction, and speed of change initiatives. In this course manual, we explore the concept of process excellence momentum, including why and how momentum changes, concluding with recommendations to sustain process excellence initiatives.
12.2 Process Excellence Momentum

Figure 12.1 – Physical Momentum
By drawing parallels to physical momentum—defined as the product of an object’s mass, speed, and direction—we can develop a rich analogy better to understand the dynamics of process excellence momentum in organizations, as described below:
i. Speed: The Pace of Change Initiatives
In physics, the speed of an object demonstrates how quickly it is moving. Analogously, in organizational change, speed represents how swiftly changes are initiated and executed.
Positive Momentum: Rapid change can be advantageous. By quickly adapting to new market conditions or swiftly implementing innovative technologies, organizations can capture competitive advantages and stay ahead of the curve. Agile organizations that can pivot rapidly exemplify this positive momentum.
Negative Momentum: However, moving too quickly can also be detrimental. Rushing can lead to poor planning, oversight, and insufficient stakeholder buy-in. Without adequate preparation and consideration, the potential for mistakes increases, leading to wasted resources and lost opportunities. However, while planning and governance are important, organizations must avoid “analysis paralysis”, where excessive time is spent in the analysis stage.
ii. Mass: The Scale of People Bought Into Change
In the physical world, an object’s mass measures its substance—the amount of matter it contains. In change initiatives, mass represents the number of people engaged and committed to the change effort.
Positive Momentum: The more people on board with a change initiative, the more substantial the collective energy driving it. When a critical mass of stakeholders is committed, overcoming resistance, sharing the workload, and generating excitement about the change becomes easier. A united front can create unstoppable momentum.
Negative Momentum: Conversely, if only a small group is engaged in the change while the majority remain disengaged or actively resistant, the change initiative’s momentum can be slowed or even halted. Like a massive object that requires significant energy to move, a large group of resistant individuals can stall change efforts.
iii. Direction: Forward or Backward Movement
Just as momentum in physics has a direction, so too does change momentum. The direction indicates whether the organization is progressing towards its desired state or regressing backwards to its old ways.
Positive Momentum: The direction is moving forward when change initiatives align with the organization’s overarching vision and objectives. Positive feedback loops can emerge, where early successes breed further enthusiasm and commitment, propelling the organization closer to its goals.
Negative Momentum: The organization can drift backwards if change initiatives are misaligned or poorly executed. Old habits can resurface, skepticism can spread, and the collective energy can move in the opposite direction of the intended goal.
The trends of the metrics discussed in Course Manual 11 (e.g., Change Adoption Rate and Stakeholder Engagement Score) can be used to assess the organization’s process excellence momentum.
In addition, the following metrics are also helpful:
Behavioral Shift Index
This metric measures the extent to which desired behaviors are being exhibited within the organization.
It is calculated using the formula:
(Instances of desired behaviors observed / Total observations) × 100
A high index value shows that employees are internalizing and exhibiting the desired behaviors central to the change, which is a positive indicator of momentum. A low value indicates that old habits persist and further intervention may be needed.
Change Initiative ROI (Return on Investment)
This metric evaluates the financial benefits of the change initiative compared to its costs.
It is calculated using the formula:
(Net benefits of the change initiative / Cost of the change initiative) × 100
A positive ROI suggests that the change initiative delivers tangible value to the organization, which can be a strong momentum booster. A negative ROI might indicate that the change isn’t producing the expected benefits and may even be causing disruptions or inefficiencies, thereby reducing momentum.
12.3 Key Factors Affecting Process Excellence Momentum:
Organizational change initiatives are often met with varying degrees of enthusiasm from employees. While some employees embrace change with open arms, others may initially show enthusiasm but later lose interest and motivation. Understanding the reasons behind this phenomenon is crucial for organizations aiming to sustain enthusiasm throughout the process excellence journey. This section explores the factors contributing to employees losing interest and motivation in change initiatives they were initially enthusiastic about.
i. Lack of Clarity and Communication
One of the primary reasons employees lose motivation is a lack of clear communication regarding the change initiative. Initially, they may be excited about the prospect of change, but enthusiasm can quickly fade if the organization fails to provide a clear vision, objectives, and a roadmap for implementation. Employees must understand why the change is happening, how it will affect them, and their role in the process.
ii. Uncertainty and Fear
As illustrated by the findings of the study by Amy Edmondson reported in Course Manual 10, change often brings uncertainty, and employees may fear the unknown. Even when they are initially enthusiastic, this fear can erode motivation over time. If employees perceive that the change will jeopardize their job security, their enthusiasm may turn into resistance as they focus on self-preservation rather than embracing the change.
iii. Resistance from Peers and Superiors
Employees may lose interest in change initiatives when they encounter resistance from their peers or superiors. Social dynamics play a significant role in shaping employee attitudes, and if influential individuals within the organization express skepticism or negativity, it can quickly dampen enthusiasm. Employees may also become disheartened if their superiors fail to support or champion the change.
iv. Change Fatigue
Change initiatives often require additional effort and adaptation. If employees are already stretched thin with their regular duties, the added burden of change can lead to burnout. As enthusiasm wanes due to exhaustion, employees may disengage from the change process, feeling overwhelmed by the demands it places on them.
v. Lack of Empowerment and Involvement:
Employees who feel they have no control or influence over the change process will likely lose interest. Enthusiasm wanes when employees perceive their voices and ideas are not valued or have no agency in shaping the change. As highlighted by the case of the Italian white goods manufacturer (see Course Manual 10; Section 10.3), their motivation is maintained when organizations actively involve employees in decision-making and implementation.
vi. Failure to See Progress or Benefits:
Employees’ enthusiasm can dwindle if they do not see tangible progress or benefits from the change. Employees may become disillusioned and lose motivation when the promised improvements do not materialize as quickly as expected or when the change process encounters setbacks.
Exercise 12.1
12.4 Sustaining Process Excellence Momentum
Having established in the previous section the various reasons why process excellence momentum sometimes stalls in organizations, we explore strategies to sustain creativity and innovation in this section. These strategies include:
i. Allocate Time for Self-Initiated Projects
One effective way to sustain creativity and innovation is to allocate a portion of employees’ workweek to self-initiated projects which contribute to organizational objectives. This dedicated time, often called “innovation time”, allows employees to pursue ideas and projects outside their regular job responsibilities. Companies like Google have famously implemented this approach, where employees were encouraged to spend 20% of their time on personal projects. Organizations tap into their intrinsic motivation by giving employees the autonomy to work on what inspires them, which is a powerful driver of creativity and innovation.
ii. Encourage Cross-Functional Collaboration
Sustaining creativity and innovation often thrive on diverse perspectives. Encouraging cross-functional collaboration brings together individuals from different departments and backgrounds, fostering the exchange of ideas and the cross-pollination of knowledge. Collaborative projects can lead to innovative solutions that might not emerge within siloed teams. Organizations should create spaces and platforms where employees can easily connect, share insights, and embark on joint projects.
iii. Create Purpose Experiences:
Employees are more likely to remain creative and innovative when they can see the real-world impact of their work. Organizations should facilitate opportunities for employees to interact with end-users, customers, or beneficiaries of their products or services. This firsthand experience connects employees with the significance of their contributions and motivates them to seek innovative solutions that directly address user needs.
This point was highlighted in Course Manual 11 as the role of a sense of purpose in creating a change-enabling culture was discussed. However, a strong sense of purpose is also essential for sustaining process excellence momentum, making employees more resilient and persistent when encountering challenges.
To illustrate, consider two individuals manually digging a hole for the same purpose – to serve as the foundation for their home. If one construes the task as simply digging a hole, while the other focuses on the higher purpose, the latter person will likely persist with the job longer than the former. This highlights that employees are likely to continue to innovate in the face of obstacles and rejection if they are reminded of the “why” of their endeavors.
Figure 12.2 illustrates the alignment of organizational and individual (.i.e., shared purpose)
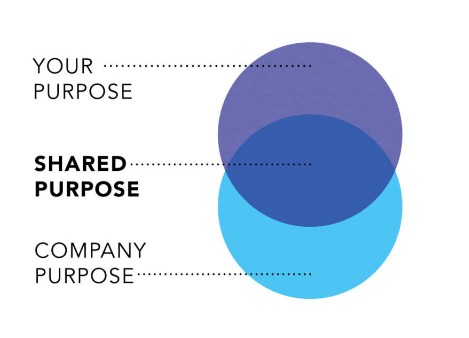
Figure 12.2 – Shared Purpose
iv. Recognize and Celebrate Innovation:
Acknowledging and celebrating innovation within the organization reinforces the importance of creative thinking. Recognize and reward employees for their contributions to innovation. This recognition can take the form of awards, incentives, or public acknowledgment, and it serves as a powerful motivator to sustain creativity and drive further innovation. As illustrated by the case study for this course manual, while this recognition is an extrinsic form of motivation, organizations have found that it works well in motivating employees.
v. Experiment with Experimenting
As illustrated by the case study at the end of this course manual, the strategies that initially worked to motivate employees may no longer work with time. As such, the organization must keep “experimenting with experimenting” and constantly tweaking the framework. Earlier in this section, Google’s 20% time policy was discussed as an exemplar for allocating time for self-allocated projects. Whilst it spawned successful products such as Gmail and AdSense, in 2013, Google stopped the initiative. To maximise the profit from its current product lines, Google sought to exploit more and innovate less as it grew from a startup to a major international corporation. The lesson to be learned from this is not to rigidly borrow specific concepts from other organizations but to adapt ideas to the organizational size and local culture.
Case Study
Ideation-to-Solution Development Process, Dealogic
Problem
As the company grew from a start-up to a multinational corporation, it had to adopt its processes such that they could be standardized and measured. However, this shift began to noticeably impact employee motivation, resulting in key employees disengaging or moving to other competitors where they could learn new skills and continue their self-development.
There was fierce competition for the skills these employees possessed, so it was not difficult for them to find new jobs, and employee attrition was high.
How Innovation Was Sustained
To address this trend, an event labelled “Creative Capital” was organized, which provided 40 engineers in London and Budapest 24 hours to work on any idea they chose provided it related to Dealogic. The event had a 92.5% take-up rate and energized the participants and others who knew it. Successful ideas were given a ‘time’ investment where the team were given a block of time off their day jobs to implement the idea. Among others, the event delivered a website displaying the current status of test systems and an app that scanned the internet and emailed someone when a company they were interested in started trending. The event received very favourable feedback.
However, employees were not as engaged in subsequent events as it came to be viewed as another business process. Efforts to tie the event with specific product challenges failed to increase the engagement level.
The company continued experimenting with the format, making changes based on employee feedback at various locations. These changes included running the event less frequently, rewarding the top three ideas with a gift voucher (as opposed to just the top idea), establishing a steering group for each location, and creating a five-person judging panel with easy-to-follow judging criteria.
Results
The latest Creative Capital event held in New York had its peak participation (30% more than any other event). However, the team is conscious that they must continue experimenting with the events’ format and frequency to maintain momentum.
Source: Alive at Work (Chapter 6)
Exercise 12.2
Project Studies

Project Study (Part 1) – Customer Service
The Head of this Department is to provide a detailed report relating to the Competitive Advantage process that has been implemented within their department, together with all key stakeholders, as a result of conducting this workshop, incorporating process: planning; development; implementation; management; and review. Your process should feature the following 12 parts:
01. What is a process?
02. Process Definition
03. Process Excellence
04. opportunity Enablers
05. Customer Experience
06. Employee Engagement
07. Regulatory Compliance
08. Shareholder Value
09. Social Responsibility
10. Implementing Excellence
11. Change Culture
12. Sustaining Excellence
Please include the results of the initial evaluation and assessment.

Project Study (Part 2) – E-Business
The Head of this department is to provide a detailed report which demonstrates that the learnings from Competitive Advantage has been implemented and is fully operational within their department. The report should describe how it was implemented, which resources were utilized, challenges that were encountered and how they were resolved, as well as implementation results.
01. What is a process?
02. Process Definition
03. Process Excellence
04. opportunity Enablers
05. Customer Experience
06. Employee Engagement
07. Regulatory Compliance
08. Shareholder Value
09. Social Responsibility
10. Implementing Excellence
11. Change Culture
12. Sustaining Excellence
Please include the results of the initial evaluation and assessment.

Project Study (Part 3) – Finance
The Head of this department is to provide a detailed report which demonstrates that the learnings from Competitive Advantage has been implemented and is fully operational within their department. The report should describe how it was implemented, which resources were utilized, challenges that were encountered and how they were resolved, as well as implementation results.
01. What is a process?
02. Process Definition
03. Process Excellence
04. opportunity Enablers
05. Customer Experience
06. Employee Engagement
07. Regulatory Compliance
08. Shareholder Value
09. Social Responsibility
10. Implementing Excellence
11. Change Culture
12. Sustaining Excellence
Please include the results of the initial evaluation and assessment.

Project Study (Part 4) – Globalization
The Head of this department is to provide a detailed report which demonstrates that the learnings from Competitive Advantage has been implemented and is fully operational within their department. The report should describe how it was implemented, which resources were utilized, challenges that were encountered and how they were resolved, as well as implementation results.
01. What is a process?
02. Process Definition
03. Process Excellence
04. opportunity Enablers
05. Customer Experience
06. Employee Engagement
07. Regulatory Compliance
08. Shareholder Value
09. Social Responsibility
10. Implementing Excellence
11. Change Culture
12. Sustaining Excellence
Please include the results of the initial evaluation and assessment.

Project Study (Part 5) – Human Resources
The Head of this department is to provide a detailed report which demonstrates that the learnings from Competitive Advantage has been implemented and is fully operational within their department. The report should describe how it was implemented, which resources were utilized, challenges that were encountered and how they were resolved, as well as implementation results.
01. What is a process?
02. Process Definition
03. Process Excellence
04. opportunity Enablers
05. Customer Experience
06. Employee Engagement
07. Regulatory Compliance
08. Shareholder Value
09. Social Responsibility
10. Implementing Excellence
11. Change Culture
12. Sustaining Excellence
Please include the results of the initial evaluation and assessment.

Project Study (Part 6) – Information Technology
The Head of this department is to provide a detailed report which demonstrates that the learnings from Competitive Advantage has been implemented and is fully operational within their department. The report should describe how it was implemented, which resources were utilized, challenges that were encountered and how they were resolved, as well as implementation results.
01. What is a process?
02. Process Definition
03. Process Excellence
04. opportunity Enablers
05. Customer Experience
06. Employee Engagement
07. Regulatory Compliance
08. Shareholder Value
09. Social Responsibility
10. Implementing Excellence
11. Change Culture
12. Sustaining Excellence
Please include the results of the initial evaluation and assessment.

Project Study (Part 7) – Legal
The Head of this department is to provide a detailed report which demonstrates that the learnings from Competitive Advantage has been implemented and is fully operational within their department. The report should describe how it was implemented, which resources were utilized, challenges that were encountered and how they were resolved, as well as implementation results.
01. What is a process?
02. Process Definition
03. Process Excellence
04. opportunity Enablers
05. Customer Experience
06. Employee Engagement
07. Regulatory Compliance
08. Shareholder Value
09. Social Responsibility
10. Implementing Excellence
11. Change Culture
12. Sustaining Excellence
Please include the results of the initial evaluation and assessment.
Project Study (Part 8) – Management
The Head of this department is to provide a detailed report which demonstrates that the learnings from Competitive Advantage has been implemented and is fully operational within their department. The report should describe how it was implemented, which resources were utilized, challenges that were encountered and how they were resolved, as well as implementation results.
01. What is a process?
02. Process Definition
03. Process Excellence
04. opportunity Enablers
05. Customer Experience
06. Employee Engagement
07. Regulatory Compliance
08. Shareholder Value
09. Social Responsibility
10. Implementing Excellence
11. Change Culture
12. Sustaining Excellence
Please include the results of the initial evaluation and assessment.

Project Study (Part 9) – Marketing
The Head of this department is to provide a detailed report which demonstrates that the learnings from Competitive Advantage has been implemented and is fully operational within their department. The report should describe how it was implemented, which resources were utilized, challenges that were encountered and how they were resolved, as well as implementation results.
01. What is a process?
02. Process Definition
03. Process Excellence
04. opportunity Enablers
05. Customer Experience
06. Employee Engagement
07. Regulatory Compliance
08. Shareholder Value
09. Social Responsibility
10. Implementing Excellence
11. Change Culture
12. Sustaining Excellence
Please include the results of the initial evaluation and assessment.

Project Study (Part 10) – Production
The Head of this department is to provide a detailed report which demonstrates that the learnings from Competitive Advantage has been implemented and is fully operational within their department. The report should describe how it was implemented, which resources were utilized, challenges that were encountered and how they were resolved, as well as implementation results.
01. What is a process?
02. Process Definition
03. Process Excellence
04. opportunity Enablers
05. Customer Experience
06. Employee Engagement
07. Regulatory Compliance
08. Shareholder Value
09. Social Responsibility
10. Implementing Excellence
11. Change Culture
12. Sustaining Excellence
Please include the results of the initial evaluation and assessment.

Project Study (Part 11) – Logistics
The Head of this Department is to provide a detailed report relating to the Competitive Advantage process that has been implemented within their department, together with all key stakeholders, as a result of conducting this workshop, incorporating process: planning; development; implementation; management; and review. Your process should feature the following 12 parts:
01. What is a process?
02. Process Definition
03. Process Excellence
04. opportunity Enablers
05. Customer Experience
06. Employee Engagement
07. Regulatory Compliance
08. Shareholder Value
09. Social Responsibility
10. Implementing Excellence
11. Change Culture
12. Sustaining Excellence
Please include the results of the initial evaluation and assessment.

Project Study (Part 12) – Education
The Head of this Department is to provide a detailed report relating to the Competitive Advantage process that has been implemented within their department, together with all key stakeholders, as a result of conducting this workshop, incorporating process: planning; development; implementation; management; and review. Your process should feature the following 12 parts:
01. What is a process?
02. Process Definition
03. Process Excellence
04. opportunity Enablers
05. Customer Experience
06. Employee Engagement
07. Regulatory Compliance
08. Shareholder Value
09. Social Responsibility
10. Implementing Excellence
11. Change Culture
12. Sustaining Excellence
Please include the results of the initial evaluation and assessment.
Program Benefits
Management
- Data-driven insights
- Operational transparency
- Performance optimization
- Cost reduction
- Process automation
- Risk mitigation
- Compliance assurance
- Resource allocation
- Decision support
- Continuous improvement
Finance
- Fraud detection
- Cash flow optimization
- Cost containment
- Financial compliance
- Revenue forecasting
- Working capital
- Expense analysis
- Invoice processing
- Financial visibility
- Budget control
Operations
- Process efficiency
- Bottleneck identification
- Resource optimization
- Lead time reduction
- Workforce productivity
- Quality improvement
- Inventory management
- Supplier collaboration
- Workflow automation
- Capacity planning
Client Telephone Conference (CTC)
If you have any questions or if you would like to arrange a Client Telephone Conference (CTC) to discuss this particular Unique Consulting Service Proposition (UCSP) in more detail, please CLICK HERE.