
Supercharged Performance – Workshop 1 (Situation Review)

The Appleton Greene Corporate Training Program (CTP) for Supercharged Performance is provided by Mrs. Stock Certified Learning Provider (CLP). Program Specifications: Monthly cost USD$2,500.00; Monthly Workshops 6 hours; Monthly Support 4 hours; Program Duration 24 months; Program orders subject to ongoing availability.
If you would like to view the Client Information Hub (CIH) for this program, please Click Here
Learning Provider Profile

Mrs Stock is a Certified Learning Provider (CLP) at Appleton Greene, and she has experience in Leadership, Management, Human Resources, Business Analysis, lifelong learning and development of expertise.
She has achieved an BSc, Post Graduate Diploma and Post Graduate Certificate. She has industry experience within the following sectors: Education, Government, and Construction. She has had commercial experience within the United Kingdom. Her program will initially be available in the following cities: London, United Kingdom; New York, USA; Milan, Italy; Amsterdam, Netherlands; Birmingham, UK. Her personal achievements include: Doubled business turnover; transformed a paper-based organisation to be almost entirely paper free and fully data led; Implementing quality assurance, and a culture of excellence; Improved staff skills and motivation whilst managing costs.
Her service skills incorporate: transformation leadership; process improvement; change management; executive coaching.

MOST Analysis

Mission Statement
A great plan requires two things – a detailed understanding of the current situation and a clear sense of direction for the future. In simple terms, in order to get from A to B we need to first know what both A and B look like. For this first session, we are starting with A, before moving onto defining the direction of travel in Workshop 2 next month.
If Team Performance Transformation appeals as a process to be applied to your organisation, then you will be well aware that not everything is running as perfectly as you would like. This is completely normal, especially in an organisation with ambitious standards and aspirations for the future. This first workshop is therefore designed to help you really dig into the data to start to uncover both the areas where there is the biggest gap between actual and desired performance, and to start to uncover the patterns and root causes of these gaps. We start with the data in order to remove a lot of emotion from this evaluation, this workshop is not about assigning blame, merely about understanding so that action can be taken.
This transformation will be multi-faceted, exploring angles which can be overlooked in other transformation processes, so we will be exploring the data from the organisation’s customer reviews, financial performance, comparative performance, staff satisfaction, staff performance, KPI achievement, and business culture as a methodology for grading and benchmarking team performance against key business objectives, both internally and against the competition. The root cause analysis will look at people, processes, technology, systems, management, product, quality assurance, and culture as a methodology for creating understanding.
This is an important exercise for creating a universal understanding of the current business situation and context. Information can easily get trapped in silos, and processes which work brilliantly in one department or for one level of management cause issues in other parts of the business. By exploring the impact of processes and technology on productivity and work satisfaction across departments we can understand which business performance questions it is not possible to answer with the existing data infrastructure. And in even the best run businesses, there is always room for improvement, and external forces which can interrupt the best laid plans, forcing a course correction.
This workshop will require the involvement of the business owners and senior management team, to both be presenting data showing the current situation in key areas but to also to have data presented to them from other parts of the organisation. This will start the conversation for Workshop 2 about the direction of travel, and the possible constraints which may impact progress. This senior level analysis and interpretation will be invaluable but is not the only valid perspective. This will be partly facilitated through the completion of both a SWOT and PESTLE analysis which will allow for the contemplation of both internal and external performance factors and constraints. It is not possible to evaluate business performance without considering the external perspective and the impact of wider social and political events.

Objectives
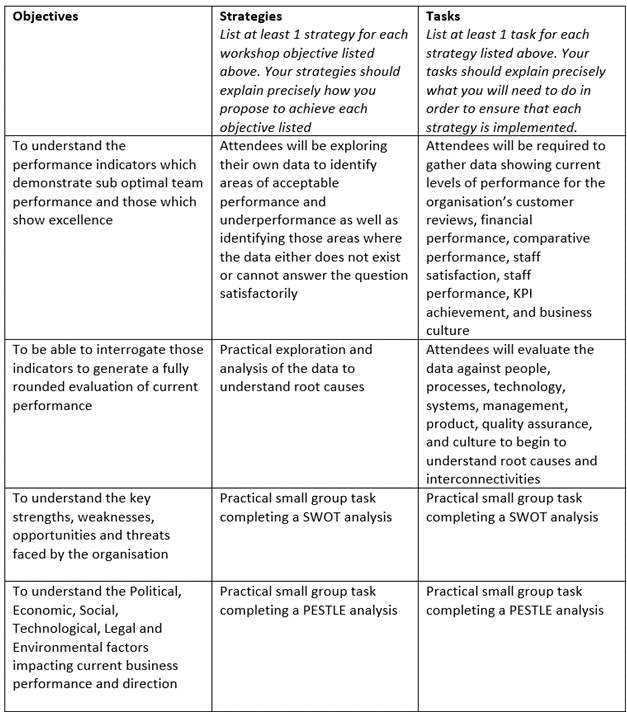
1. To understand the key performance indicators that are being measured, to establish whether they appropriately demonstrate both sub optimal and excellent team performance.
2. To be able to interrogate those indicators to generate a fully rounded evaluation of current performance.
3. To establish whether those indicators are conveying insightful information and if not, how they can be improved, or others introduced where appropriate.
4. To understand the key strengths, weaknesses, opportunities and threats faced by the each of the departments as well as the organisation, using the SWOT analysis model.
5. To gain further insight of the external factors affecting the organisation, by utilising the PESTLE model (Political, Economic, Social, Technological, Legal and Environmental factors) to analyse how they are impacting current business performance and direction.
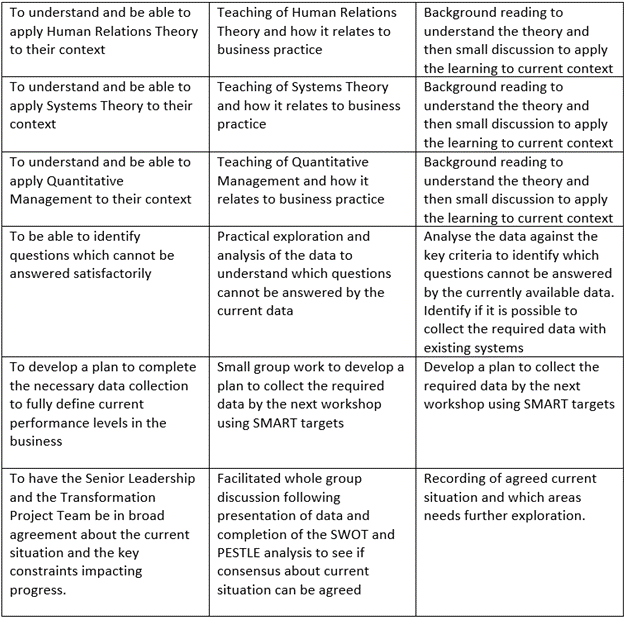
6. To then apply the Human Relations Theory to their context, gaining insight into how employee attitudes, interpersonal relationships, group dynamics and leadership styles are affecting organisational effectiveness.
7. To further apply Systems Theory to their context, to understand how smaller systems interact together to create a greater, more complex system and how that further advances the organisation.
8. To understand and be able to apply the Quantitative Management approach to their context, to help identify how decision making can be more informed and efficient.
9. To be able to identify questions which cannot be answered satisfactorily from the indicators and data that are already in place.
10. To develop a plan to complete the necessary data collection to fully define current performance levels of the individual departments and the business.
11. To establish a broad agreement between the Senior Leadership and the Transformation Project Team about the current situation and the key constraints impacting progress.

Strategies
1. To fully understand the range of indicators that are currently in place and the relevance of the information they produce, the attendees will be exploring their own and other’s data to identify how well they demonstrate acceptable performance and sub optimal performance.
2. For meaningful performance transformation to take place, the attendees need to further establish the practical exploration of that data, to analyse how it is collected, how objective it is and the information it is presenting, so to fully understand the current performance of the organisation.
3. There is a possibility that certain aspects of performance are not being measured adequately, so the attendees will need to examine and identify those areas where the data either does not exist or cannot answer questions satisfactorily, to then plan how that these indicators can be developed.
4. Small groups will then be formed to create SWOT analyses for the different departments, which they can share with the other groups. These will then be used to help create a SWOT analysis for the whole organisation.
5. External and environmental factors will play a huge part in the current performance of the different teams, so practical small group exercises will be set up to compile the PESTLE analysis for each of the departments.
6. A training of Human Relations Theory and how it relates to business will be delivered, to gain insight into how employee attitudes, interpersonal relationships, group dynamics and leadership styles are affecting organisational effectiveness, highlighting areas where they could be improved.
7. To further gain an understanding of how the smaller systems interact together to create a greater, more complex system, together with the relationships that can be formed from that, there will be a workshop teaching Systems Theory, practically how it relates to business practice.
8. Organisations are constantly striving to make more informed and insightful decisions, promoting efficiency in the decision-making process. Workshops teaching and demonstrating how Quantitative Management can be improved within the business practice will be held to improve this area.
9. Small group exercises will be set up to practically explore and analyse the data to understand the questions that cannot be answered from it. From these exercises, a strategy can then be built to establish how the date to answer these questions can be satisfactorily obtained.
10. SMART targets will be set, again in small group exercises for the next workshop to ensure this strategy is being followed and that this new data can be presented.
11. There will be a facilitated discussion for the while group following the presentation of existing data and completion of the SWOT and PESTLE analysis, to reach a consensus and agreement of the current situation.

Tasks
1. Each attendee will be required to gather data to bring to the workshop, showing current levels of performance for the organisation’s customer reviews, financial performance, comparative performance, staff satisfaction, staff performance, KPI achievement, and business culture. They will each present this data to the other attendees.
2. The attendees will evaluate the data against people, processes, technology, systems, management, product, quality assurance, and culture to begin to understand root causes and interconnectivities.
3. Small group exercises to examine and identify in each of the areas of people, processes, technology, systems, management, product, quality assurance, and culture, questions that cannot be answered by the data provided and determine how that missing data could be mined.
4. Complete departmental SWOT analysis in small group exercises, for presenting and creating a companywide SWOT analysis.
5. Complete an organisation PESTLE analysis in practical small group exercises.
6. Attendees to undertake background reading to gain a good understanding of Human Relations Theory, so they are prepared for a discussion of how that learning can currently be applied to the organisation.
7. Attendees to undertake background reading to gain a good understanding of Systems Theory, so they are prepared for a discussion of how that learning can currently be applied to the organisation.
8. Attendees to undertake background reading to gain a good understanding of Quantitative Management, so they are prepared for a discussion of how that learning can currently be applied to the organisation.
9. Small group exercise to analyse the data against the key criteria to identify which questions cannot be answered by the currently available data. Identify if it is possible to collect the required data with existing systems.
10. Small group exercises to develop a plan to collect the identifies required data by the next workshop, setting SMART targets to ensure goal is achieved.
11. A recording of agreed current situation by all parties and identify the areas needs further exploration.
Introduction

Planning Phase
The defining and launching the Planning Phase for the Team Performance Transformation Program – Workshop 1 is an essential process because it sets up the prerequisites that will drive the entire process. This phase consists of four steps, which need to be considered before this workshop take place. These are:
1. Understanding the “why”
2. Senior Management Commitment
3. Agreed Budget Commitment
4. The Identification of the Core Project Team
Understanding the “Why”
This first workshop is focused on discovering how the business is performing against both internal and external benchmarks and expectations. However, before this, the leadership team must start from a position of understanding and agreeing why radical change is required, and why business performance needs supercharging at this point. This leads to two key questions:
What is driving the thinking that we need the Team Performance Transformation Program?
Before we begin such an important and potentially transformative project as this, we need to have a good answer to the question of – Why? In such a busy world, and with so many other things to do the people involved with the organisation need to understand why this is the right plan and why they should make the Team Performance Transformation a major priority, devoting the time, focus, and commitment necessary to succeed.
What is driving the desire to want to make that change now?
Every stakeholder is challenged with too many tasks for the time they have available. The only way to manage these is to prioritise those tasks. For that priority to be set, the understanding of why the Team Performance Transformation program should be given a priority must be absolutely clear in the mind of all the leadership team.
Efficient teams are essential to the success of any business and this program is designed to increase the performance of those teams.
Within this, we must also understand the Key Business Objectives. Why does the organisation exist? What is it trying to achieve? What are the key values that underpin how it goes about doing business? These are often codified in Mission or Vision Statements, but there is often also a further unwritten set of objectives and values which needs to be unpicked and agreed upon. This helps us to understand what is truly important to the organisation as this will inform not just the focus of the transformation but also how the transformation process will be best undertaken in order to meet cultural and value needs. There is always more than one way to achieve lasting and effective change.
Sadly, there are many examples of once successful businesses that failed to transform their operations quickly enough to meet the needs of a changing world. Competitiveness is not a given, and those that fail to transform may lose their market share or even fail to exist. The need to change is governed by both internal and external factors including rapidly advancing technological opportunities which can be used to both improve how the business runs but also to create customer delight.
Well run businesses with a quality reputation have been shown to have higher trust, respect and profitability than those who don’t. They also have the ability to attract talent and investment not available to others. In a world where over 80% of mergers and acquisitions fail to generate sufficient return on investment high quality organic growth generated from internal transformation is the best value for money.
Even the best run companies have inefficiencies, and areas which don’t perform as well as they could do. They have crevices or departments which have not been evaluated for long periods of time, and aged decisions which are still unquestionably being followed. These add overhead, stress and complexity. All businesses benefit from periodic wide scale evaluation and investigations to inform operational changes. These can help to reduce operational or technology maintenance costs, explore the reasons for sub-optimal business growth or declining revenues, meet ever increasing customer expectations, and adapt to changing political climates.
Transformational success depends on certain things, the right timing, and integrated approach, the bandwidth to create effective change, and the right capabilities within the team for success.
Right Timing: Many organizations focus on ever more iterative change as part of a culture of continuous improvement, until it becomes ever clearer than this approach is no longer working. This is normally seen via weak revenue, customer dissatisfaction or increased competition. Significant change then becomes a priority, and the need for rapid results creates increased stress. Identifying the correct course of action takes time, so better results come from proactively engaging and planning for it before the damage has occurred.
Integrated Approach: By focusing on the 8 elements for effective transformation – people, processes, technology, systems, management, product, quality assurance and culture you have everything in place to create effective change to organizational design. Looking at all parts in the round as a whole ecosystem can be helpful to make big strides and avoid unnecessary work or micromanagement. This helps move away from solutions which feel more like moving the deckchairs on the Titanic to ones which change the course of the organisation and create lasting and effective change.
Bandwidth: The organisation is not going to stop operations during this transformation process. But overwhelmed and rushed executives do not make the best decisions, so properly staffing and resourcing the project team is a must.
The right capabilities: The people who are chosen to lead the transformation team must have the skills and capabilities to do the job well. This may require outsourcing or hiring in the right talent to make things happen in the right way to create success.
While this first session is all about identifying how the business is currently performing, there are several pre-conditions which need to be in place for the Team Performance Transformation process to work.
· Senior Management / Business Owner commitment
There must be a complete commitment from the senior management or the team for any form of transformation to take place. A change programme without the full commitment of time, effort and resources from the organisation’s leaders and owners, is likely to jeopardise robust, meaningful and positive change to be adopted by those further down in the organisation. This is a two-year commitment to invest in a process designed to supercharge business performance by equipping key members of the business with the necessary skills and knowledge to want to work differently. For this change to be disseminated through the business as a whole, so that staff are willing to operate in a significantly different manner, the senior management team must be the proponents of this change. To do this will require time, money, enthusiasm and effort from those at the top of the company and cannot be undertaken lightly.
• Pre agreed budget commitment
At this point, the business leaders will have an idea why they felt committing to the Team Performance Transformation process was a good plan. This may be a data led decision, a need prompted by external forces requiring a significant altering of how the organisation operates, or more intuitively, the understanding that the previous iterative changes have reached the end of the road and a more substantial re-imagining is required to unleash the next level of performance. In all cases, we are led to the same conclusions, that investment in not just skills and knowledge is going to be needed to create the level of desired change. At this point it is not possible to put together a detailed budget, but business owners and senior leadership teams do need to pre-agree an amount they are willing to invest in upgrading equipment and systems. This has to be seen as a necessary investment to further the success of the organisation.
· Identify a core project team and create the time and space for them to commit to implementing this change and the necessary decision-making authority
Such a substantial transformation opportunity does not just need investment in equipment and software, but also in making sure the core transformation team have the time and support needed to make a success of this opportunity. To create more efficiency in the project as it unfolds, key people within the project team must be given authority to make decisions. The transformation process will cannot afford to be hampered by a long process of ratification for decisions that are intrinsic to the success of the project. At this stage, leaders will have an idea of the key staff they would like to be involved. Therefore, the authority for clearing their diaries, altering job descriptions, and changing reporting and supervisory responsibilities are a key pre-requisite. This is an area where so many projects falter and can ultimately fail, all because this authority has not been given. If this doesn’t happen, the project staff not only struggle to find the time to commit but also find that other daily business tasks are given a higher priority.
There should be an internal Steering Committee that will be the key champions and cheerleaders for the transformation programme within the organisation. The lead of this Steering Committee will be the Central Point of Contact for the Client Company and will have full Decision-Making Authority. This lead will represent key stakeholders and program participants. Each Steering Committee should include an Executive Sponsor, who will be the link between Senior Management and key points of the transformation, mainly the Development, Delivery/Implementation, Management, and Review of the Program.
A key starting point will be to select other members of the Steering Committee to represent various stakeholders who would participate in the transformation or be key beneficiaries. Employee engagement is a critical factor for success and so staff should not just be informed of the transformation that is about to unfold, but this group should also be represented on the Steering Committee. Motivation research shows that people are most committed to those changes they have helped to influence.
In union-organized companies, finding the right union rep to be part of this team will have a significant impact on the potential success of the programme. This Steering Committee of insiders will work with us to Design, Develop, Delivery, Manage, and Review the Program. This team shares responsibility to bring the Team Performance Transformation process into their organization and help us adjust the strategies, content, processes, and delivery methodology to achieve success and exceed your expectations. This is an interactive process. Finally, the Steering Committee should contain at least one senior executive sponsor to make sure this transformation programme meets Leadership objectives and addresses their concerns.
Pro-activity is the key for the Steering Team when managing these key stakeholder and influencer relationships. This will lead to better results than reacting someone gets upset because they weren’t advised or consulted when a major decision was made. These relationships have to have a joint vision of the outcome for the transformation, be built on trust, have agreed performance expectations, and determine what information will be shared, created, and exchanged.
The Steering Committee also needs to start selecting either an internal delivery facilitator, or an Appleton Greene Consultant/Facilitator to work closely with the Steering Team and the Learning Provider.
· Understand the “why”.
This first workshop is all about finding out how the business is performing against both internal and external benchmarks and expectations. But we need to start from a position of understanding and agreeing why radical change is required, and why business performance needs supercharging at this point. This leads to two key questions:
What is driving the thinking that we need to change?
What is driving the desire to want to change now?
There is a final specific task to be completed prior to the first workshop. Each participant will need to complete a state-of-the-art talent diagnostic. There are several excellent reasons for this:
Firstly, these assessments help us get to know the key participants and their needs in a quick, painless manner leading to improved learning and performance outcomes. Then, we can use the results to support the implementation of the Team Performance Transformation process as much research has shown individual talent is not enough to succeed in today’s work environment. How the team as a whole performs is equally critical. Psychometrics reveal team dynamics in an easy to interpret visual format way, enabling a deep understanding of how teams interaction as well as how individual behaviours influence the achievement of team objectives.
We use psychometrics and talent diagnostics from Harrison Assessments and these help both Senior Leadership Teams and individual team members to gain a clear understanding of their own behaviours helping them to become more effective team members and leaders. This also includes understanding stress behaviours and how those impact both individual and team performance as well as helping people understand what can trigger these behaviours. The reports generate understanding of how to improve decision making within teams and whole organisations, improve the makeup of teams, inform succession planning, and assess the potential for cooperation or conflict.
Overall, we find that with these insights, managers can maximize team strengths while developing areas of deficiency in order to maximise performance, and in the context of a transformation project to inform decision making.
NEED BETTER QUALITY IMAGE FOR WORKSHOP 1 – SITUATION REVIEW IMAGE

Design & Development Phase
Approach
The Team Performance Transformation process is designed to be unlike any other management or leadership programme out there. By expanding traditional management thinking and combining it to incorporate key themes from business analysis we are equipping general managers who will use IT every day but have little experience in specifying on a large scale the best systems and processes needed for running the business. This course will push teams to understand the real root causes of business underperformance and to implement changes that address these rather than to paper over the symptoms.
This is a very practical undertaking. While there will be lots of teaching of the relevant knowledge gleaned from a variety of academic specialities; management, business analysis, lifelong learning, emotional intelligence, and change management, this is designed to be applied to the workplace context and used to inform new thinking and actions. New skills will be taught and developed, again with the specific intention of improving practice and informing the direction of this performance transformation.
Working with our partners
This training programme is not designed to deliver qualifications, but to push individuals to deliver the very best positive change they can for the business. Success lies in the acquisition of skills and knowledge, but it is much more about how those skill and knowledge are applied to the goal of improving business performance. With that in mind, it is important to recognise that there is always more than one way to get from A to B. Some techniques may not work in some organisations, and it may not be possible in some cases to implement every great idea. Flexibility is key, as is our ability to deliver robust feedback to help broker and support project teams to achieve success.
Data Collection
This first workshop is geared to fully understanding the current levels of business performance. This will require a large quantity of data collection and analysis by the project team. Where this data is not easily accessible or available, innovations will be required in order to achieve success. The project team will need to contemplate the questions they are trying to answer from this data. Just arriving at the first workshop with a compilation of numbers and data is not enough to provide a framework for development.
The project team will have needed to research a Data Dictionary for their business environment. The Data Dictionary will describe and record the existing Data Landscape for their business domain. This is important, to define the boundaries that they have to work within and the raw data materials that they are starting out from. They will be expected to have interrogated the information they have collected, so they have a good understanding of its robustness.
Progressing further they will use formal Data Model modelling techniques to describe the existing information model for their business domain. The model will be developed to include details of key flows around the business. The aim of this process is to develop a formalised understanding of the structure, that will present current opportunities for improvement. The aim is to develop complete and actual (As Is) representation of the information domain and provide opportunities to identify potential improvements in the desired (To Be) model to be developed later.
To develop these models the project team will need to deploy sophisticated research techniques, delving into all aspects of their business domain. They will become familiar with elements of the business that perhaps, they previously would not go anywhere near. They will need to observe business processes and the data that originates from and drives those processes. They will need to talk in depth to business stakeholders and their staff.
Once the process of data analysis is complete, they will need to produce a system architectural plan for the business domain. Documenting where information artifacts are used and for what purpose, and which business processes they are stored or transformed in.
Specific data will need to be collected to cover the 8 key elements of Team Performance, being people, process, technology, systems, management, product, quality assurance and culture. These are combined with the specific areas of focus around customer, reviews, financial performance, comparative performance, staff satisfaction, staff performance, KPI performance and business culture.
System Design
This is not just the design of business processes or requesting particular changes to IT systems. This is about designing the whole way the business goes about doing business. It involves how people will be recruited, trained, performance managed, and directed; the creation of a positive business culture which embodies how people want to work as well as what they are working for; and combining this with the conditions needed for business success.
Fundamentally a business exists to make profit, but how it goes about making profit matters to staff, customers, and wider stakeholders. When we re-design these key business systems it will embody all these factors as well as asking the most important question of all, “what is driving you nuts?” Then making sure the designs solve real life practical problems experienced by staff so they want to be involved in implementing the change successfully because it will make their lives better, remove tedious work arounds and generally free them up to do something more interesting instead – increasing their contribution and productivity.

Implementation phase
This workshop will comprise of three different parts. These being a ‘get to know you’ session, then expectation setting, and more importantly an opportunity to really interrogate the data which has been collected, evaluating how well it is able to answer the key business questions.
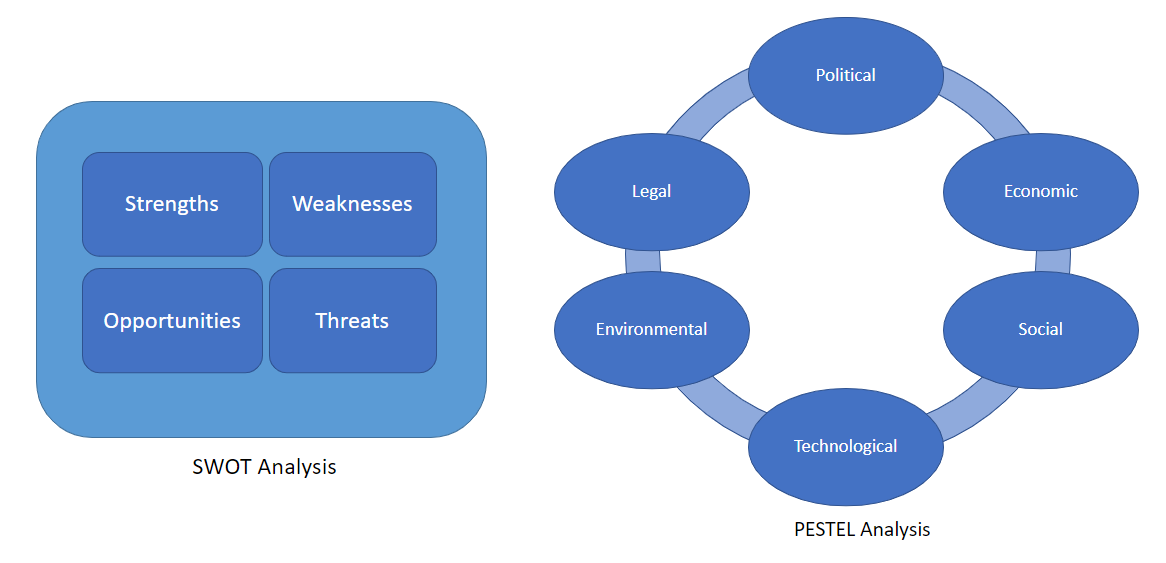
Participants will be conducting both a SWOT and PESTLE analysis to get everyone on the same page, and as a way for us to understand the key issues and context for the organisation. Project team members are likely to have been recruited from different parts of the organisation so may see the position of strengths and weaknesses differently. Both the SWOT and PESTLE will be data informed because decisions will need to be reached by more than just opinion, and benchmarking will be key to this. The candidates will be exploring what is a real strength as opposed to what is a “given” – a level of performance which is neither strength nor weakness but just expected.
An example of this can be seen when a bank claims it delivers great customer service. Is this really a strength or just what all customers would expect? How can the bank demonstrate that its customer service is better than the competition to justify the claim? Understanding the real strengths is important at this stage, to encourage criticality of thought, and the questioning of existing beliefs. One of the core tenets of the Team Performance Transformation process is for accurate problem diagnosis, and this is one of the key techniques for developing this skill.
Agreeing on the opportunities and threats facing the business can help both the project team and senior management to see the bigger picture, rather the just the day to day performance. While the daily performance is incredibly important it needs to be seen in the context of overall market opportunities and how the competition is progressing and possibly innovating. This bigger picture thinking is backed up with the PESTLE analysis where participants will be exploring the impact of the current political situation, the state of the economy, social issues, technological opportunities, environmental considerations, and the legal environment, to understand whether the external environment is helping or hindering the organisation to achieve its goals.
This external environment is never static, and businesses do not operate in a vacuum. Within this exercise, participants will be encouraged to reflect on both staff and customers opinions particularly within the social and environmental sections where external expectations may present excellent business opportunities or serious constraints on action.
This workshop then will set the scene for our future training and working relationship, where we can collectively sow the seeds to for the desired growth for in the future, probing to create understanding and improve aspirations, and working to improve both knowledge and skills. The workshops will be highly interactive learning spaces, building on existing knowledge and skills to raise performance and creating the right environment for participants to leave, equipped with new knowledge and tools that can be enhance their development and can be implemented to move the project forward to the next stage in good time for the next session.
Review
· Knowledge and skills acquisition
Testing of understanding will be built into key learning activities within the workshop sessions to not only ensure the retention of the learning but also how that new knowledge can be applied and refined over time.
· Completion of the necessary work during and between sessions
A true picture of learner understanding comes from their ability to assimilate the learning and apply key concepts and skills to their own practice in a quality manner. Generally, we see that learners who struggle to complete work have either failed to comprehend key areas of knowledge, need further practice to make consolidate new skills before they can apply them to their practice, or either mindset or life has gotten in the way. We need to understand the reasons why a learner has not progressed in the way we expected so that we can offer enhanced support. This is one of the key drivers behind the use of the Harrison Assessment both prior to and during the first workshop. These state of the art diagnostics give us a real insight into participants strengths and personalities – helping to inform how best to support their learning.
· Quality Assurance
Quality assurance includes two principles: “fit for purpose” (the product should be suitable for the intended purpose); and “right first time” (mistakes should be eliminated).
The Leadership Team need to create their definition of excellence and then establish the requirements that each area of the business needs to adopt and understand what the drivers are for excellent quality.
The quality management principles are:
· Customer Focus
How are we best serving our customers?
· Leadership
Is the leadership team providing the guidance the organisation needs to grow successfully?
· Engagement of People
Are the Leadership Team engaging with the workforce and customers in a way that generates enthusiasm?
· Process Approach
How can processes be adopted to enhance efficiency and simplicity?
· Continuous Improvement
What steps can be taken to ensure the ethos of continuous improvement is adopted?
· Evidence Based decision Making
What evidence is need for more informed decision making and where can that evidence be obtained?
· Relationship Management
What education and practices need to be assimilated to ensure both internal and external relationships, and at all levels, are managed successfully?

Methodology
For the Team Performance Transformation process to create robust and significant change in the organisation, the eight key elements need to be addressed in a systematic and objective way. These key elements are:
· People
· Processes
· Technology
· Systems
· Management
· Products
· Quality Assessment
· Culture
Therefore, the collection of high quality data and information is crucial, as has been outlined in the planning phase. The organisation will not only need to interrogate the obvious sources but also those that are somewhat hidden, such as spreadsheets and reports that may localised and not generally shared.
The stakeholders and the AG learning provider need to explore innovative methods to expand traditional management thinking, the way IT is used to inform decisions, the adaptation of systems to be informative and the modification of process to be more efficient.
The transformation process will require the leadership team to delve deeply into the real root causes of business underperformance and not rest at the surface levels of apparent explanations. A sticking plaster will not heal a fractured leg. Therefore, this is a very practical undertaking.
The teaching of the relevant knowledge, accumulated from academic specialities; management, business analysis, lifelong learning, emotional intelligence, and change management, is designed to be implemented in the workplace and used to inform new thinking and actions. These new skills are intended to be used for the specific intention of improving practice and informing the direction of this performance transformation.
It is only through this thorough implementation that the true return on investment will be realised.

Implementation phase
The Team Performance Transformation process is designed to challenge and expand traditional management thinking. By introducing key themes from business analysis we are equipping general managers with a deeper understanding of the benefits of large scale IT systems and how to research and identify the best systems and processes that can be utilised for running the business. This training will push teams to expand their understand the real root causes of business underperformance and how address those causes, as opposed to only looking at the surface affects.
This very practical training will involve expansive teaching of the relevant knowledge gleaned from a variety of academic specialities; management, business analysis, lifelong learning, emotional intelligence, and change management, designed to not only be applied to the workplace but also with the specific intention of measuring how their implementation is improving practice. These measurements will be used to inform the stakeholders the direction and success of this performance transformation.
Although this is not designed to deliver qualifications, as the individuals grow to deliver the very best positive change they can for the business, the improved business performance will demonstrate the success of those individuals as they implement the skills and knowledge delivered in the workshops.
It is also important to recognise that there is always more than one way to get to reach certain improvement goals. Some techniques may not work in some organisations, and it may not be possible in some cases to implement every great idea. Flexibility is key, as is our ability to deliver robust feedback to help broker and support project teams to achieve success.
In this first workshop, we need to gain a solid understanding of the current levels of business performance. Therefore, this will require a large quantity of data collection and analysis by the project team. However, in some cases, this data may not be easily accessible or available and this will require innovative thinking in order to achieve success. The project team will need to contemplate the questions they are trying to answer and ensure that the data they bring to the first workshop is useful to provide a framework for development.
The project team will need to understand the Data Dictionary required for their business environment. This will describe and record the existing Data Landscape for their business domain. This is important to set the boundaries that they are to work within and where the data they have collected fits in this dictionary. This collected information will be used in conjunction with formal Data Model modelling techniques to describe the existing information model for their business domain. The model will be developed to include details of key flows around the business. The aim of this process is to develop a formalised understanding of the structure and present opportunities for improvement.
The aim is to develop the representation of the information domain as it currently stands and provide opportunities to identify potential improvements in the to be model to be developed later.
To develop these models the project team will need to deploy sophisticated research techniques to extract all the information required by the models. They will become familiar with aspects of the business that they were not aware of, and they will need to observe business operations and the data that originates from and drives those processes. They will need to carry out in depth discussions with their business stakeholders and their staff.
Once the process of data analysis is complete, a system architectural plan for the business domain can be created, with precise documenting about where information elements are used and which business processes they are stored or transformed in.
This workshop will be part get to know you session, expectation setting, and more importantly an opportunity to really interrogate the data which has been collected, evaluating how well it is able to answer the key business questions. The project team will be understanding and in some cases, designing the whole way the business operates, including:
· Recruitment
· Training
· Performance Management
· Business Leadership and direction, and
· Business Culture
This will help inform the Leadership Team the conditions needed for business success, how it drives making a profit whilst also taking great care of their staff, customers and wider stakeholders. The new re-designed key business systems will embody all these factors, ensuring that those systems solve the practical challenges experienced by staff so they are motivated to be involved in implementing the change successfully, as it will lives better and remove tedious work arounds and free them up to increase their contribution and productivity.
Participants will be conducting both SWOT and PESTLE analysis as a way to get everyone on the same page, and as a way for us to understand the key issues and context for the organisation. Project team members are likely to have been recruited from different parts of the organisation so may see the position of strengths and weaknesses differently. Both the SWOT and PESTLE will be data informed, decisions will need to be informed by more than just opinion, and benchmarking will be key to this. We will be exploring what is a real strength as opposed to what is a “given” – a level of performance which is neither strength nor weakness but just expected. An example of this can be seen when a bank claims it delivers great customer service – is this really a strength or just what all customers would expect? How can the bank demonstrate that its customer service is better than the competition to justify the claim? This is important at this stage as a way to encourage criticality of thought, and pushing back. One of the core tents of the Team Performance Transformation process is for accurate problem diagnosis, and this is one of the key techniques for developing this skill.
Agreeing on the opportunities and threats facing the business can help both the project team and senior management to see the bigger picture from day to day performance. While the day to day is incredibly important it needs to be seen in the context of overall market opportunities and what the competition is up to. This bigger picture thinking is backed up with the PESTLE analysis where participants will be exploring the impact of the current political situation, the state of the economy, social issues, technological opportunities, environmental considerations, and the legal environment to see how what the organisation is trying to achieve is wither being helped or hindered by the external environment. The external environment is never static, and businesses do not operate in a vacuum. Within this exercise, participants will be encouraged to reflect on both staff and customers opinions particularly within the social and environmental sections where external expectations may present excellent business opportunities or serious constraints on action.
This workshop then will set the scene for our future training and working relationship – sowing seeds to gently grow for future use, probing to create understanding and improve aspirations, and working to improve both knowledge and skills. The workshops will be highly interactive learning spaces, building on existing knowledge and skills to improve performance and creating the right environment for participants to leave and both apply their learning and use it to move the project on to the next stage in good time for the next session.
NEED BETTER QUALITY IMAGE FOR ‘DURING WORKSHOP’ IMAGE (IMAGE NUMBER 3)
Immersive Approach
While the delivery of monthly workshops is central to the success of this transformation, the leadership team must immerse themselves in the process. The different and innovative thinking that is the result of the new learning must be implemented outside of the workshops. Collective commitment to implementation, engagement, discussion, planning, feedback, learning, metrics and diagnostics will be key for a complete transformation to take place within the organisation and its teams.
We have learned from experience that this embracing of the process helps organisations to be far more successful in the short run, create faster results, and ultimately establish a much more sustainable long-term impact.
Working with Motivated Organisations
As a Learning Provider, we look forward to working with organisations who actively engage in the process of bringing transformation to their teams and ultimately, to the way they do business.
We have years of experience in designing and developing a very wide variety of programs, that help organisations increase their efficiency and productivity, through a more proficient use of systems, processes and technology, that support an improved environment for management and their teams to work in. This helps to enhance a culture where people take pride in the quality of the products and services they deliver.
Innovators
Our roots in Team Performance Transformation are very different from many other training organisations in this sphere. We have been immersed in the practical experience of executive management, transforming our own teams, strategic planning, innovating systems and processes, adapting the utilisation of IT to help deliver complex projects efficiently and working within this process to achieve business excellence.
This experience, together with our own constant learning, has made us thought leaders in business development and team transformation. We understand the importance of data in an organisation and how the information it provides can be interrogated to provide deep insights into how team performance can be regenerated from mediocrity to excellence. The training we provide is practical, pragmatic but also thought provoking and creative. We also stress the importance of implementation, action, review and adaptation, giving a focus on continual improvement to all aspects of the organisation.
The Difference between Leading and Managing
There is an intrinsic difference between Leadership and Management, especially when it comes to team performance. Management focuses on the ability to create an environment where team players work together to accomplish a series of tasks or a set of common goals. The team manager’s role is to ensure that the varying jobs or projects are successfully completed.
Leadership encompasses this but takes that further to provide inspiration for the team. The leader will ensure that each member of the team is in the right role that is best suited for their particular skills and empowering them to not only further develop those skills but also to grow in character and maturity.
As the manager reaches more senior levels, most are not clear in their thinking about leadership, nor can they distinguish between the different leadership styles and when each is appropriate. In simple terms, managers are tasked to maintain stability, oversee efficiency, while minimising risk to the team and the organisation.
The leader’s quest must be for continuous improvement, adaptation to change, innovation, integration across organisational boundaries, and generating competitive advantage, while building high performance teams that take advantage of the collective skills and insights of everyone in the organisation.
The Team Performance Transformation process focuses on creating leadership thinking that will then lead to enhanced team performance.
Clarity of Vision
At the beginning of the process, each stakeholder will have their own vision of the organisation after the delivery of the whole process. They must all come to the workshop with an idea of that vison, so that collectively, a vison for the organisation can be clarified, agreed and then fixed. This fixed vison will be intrinsic to the mission, purpose and strategy of the organisation. Having these in yield the understanding of the leadership team of the direction the organisation will follow.
Benchmarking
What Is Benchmarking?
Benchmarking is a crucial process to measure an organisation’s success against that of other similar companies to discover if there is a where that company is placed in the market. This process can be carried out both internally, between departments and externally between different companies.
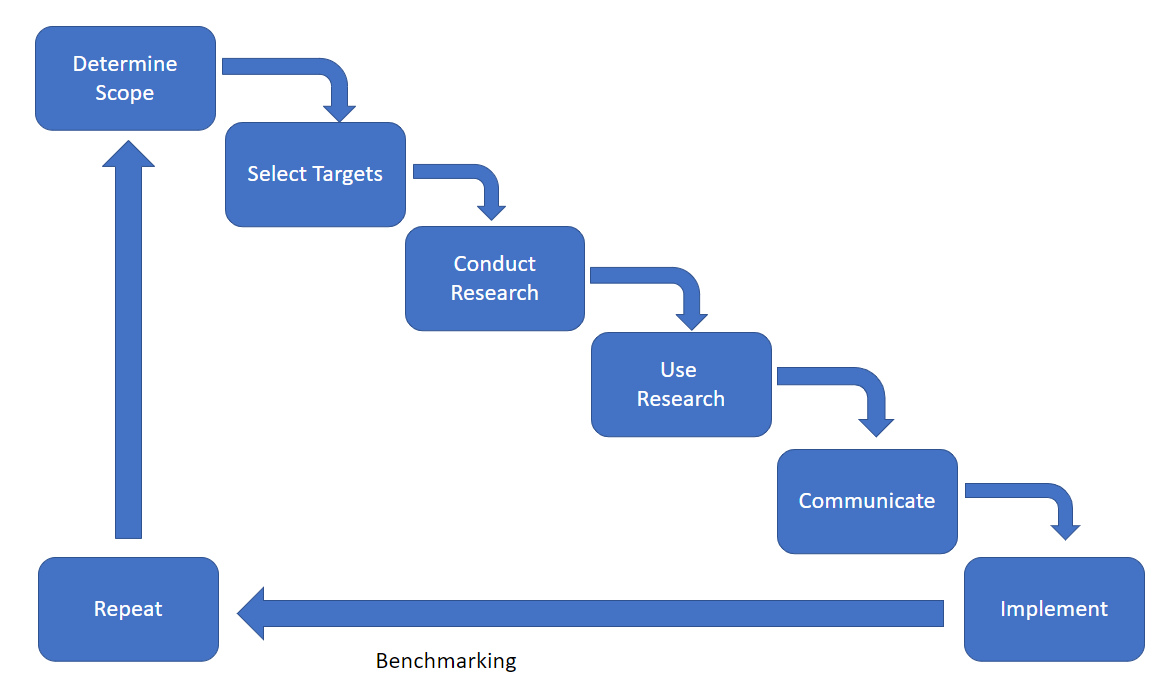
The process not only highlights gaps in its performance but also leads to critical thinking in the Leadership Team to explore ways that they can rise above their competition.
External Benchmarking
Studying other companies can highlight what is needed to enhance efficiency and productivity, to become a bigger player in your industry. External competitive analysis can identify areas that can be improved in the business against its competitors, giving valuable insights into particular operations that can be improved, through valuable insights and innovative thinking, to help create a plan to dominate your market.
Internal Benchmarking
Benchmarking can also be carried out internally, examining the performance, efficiency and motivation of different departments and functions against each other, to establish a regime of best practice to be continuously implemented.
In both cases, the benchmarking helps create a set of goals and performance criteria to measure both performance and success. This helps to create a culture of continuous improvement, where everyone is empowered to suggest improvements to the business operations, processes and environment that leads to the continuing success of the organisation. New goals and competitive targets can be continually achieved and reset, as long as they remain achievable, ownership of them is encouraged and they do not become too competitive and demotivational.
Encouraging ownership will lead to employees taking pride in their work and can see, due to the setting of metrics and the measurement of their attainment, the contribution they are contributing to the success of the company.
Benchmarking Process
1. Planning
As with any process, the planning stage is the most important. This includes highlighting what the areas for improvement, the competitors you will use for reference, and envisaging a success outcome. The results of planning will help the project team focus on the information you need to collect and what success will look like.
2. Collection of Information
After planning, information needs to be gathered on the processes and how competitors go about this. If improvements to customer service satisfaction is the goal, then an understanding of the processes involved in the relevant department(s) needs to be gained, how calls and communications are dealt with, and how that differs from your competition. It is important to gather as much information as possible.
3. Analysis of Data
Once that information has been gathered, then it can be analysed to begin to understand the shortcomings you may have. It is important to remember at this point in the process that no business is perfect and you must have an open mind to be able to analyse that information objectively. Once findings are uncovered, then discussions on the next steps to achieve better performance in this area can take place.
4. Implementation Planning
This is planning how this how these findings are going to be delivered to the relevant workforce and understanding how they will be received. Changes may involve new processes and procedures and may also require some upheaval. It is vital for the success of these new procedures that these changes are fully adopted by the staff who will be responsible for the activity.
5. Action.
This is stage where the staff will start working with the new processes and highlighting areas that are good and those which are challenging. The workforce will need full support from the leadership team and that data must be gathered and not lost.
6. Monitoring.
This monitoring of results and discussion of the concerns from the staff are essential to determine how successful the plan has been. The implementation phase will have highlighted metrics and goals for success within a time frame so monitoring these is the only way to tell how well these changes have worked. Monitoring can be over a short or long period of time depending on the desired outcomes.

Management
For the first workshop we are looking at the following aspects of the business and collecting information about how each aspect of the business functions:

The data needs to cover the organisation as a whole, as well as looking at individual department performance. This is a lot of data to be collected and analysed, and the project team will need to start by devising an effective plan to identify what naturally occurring data exists.
We would recommend starting with a mind map of the different departments of the business and exploring which of the seven areas of performance are relevant to that department, and what naturally occurring data there is available. Once the organisation mind map is completed, it can be annotated to show which of the 8 elements have been covered via naturally occurring data.
The next stage is to identify which areas of performance, elements, and organisational departments so not have a full set of naturally occurring data. The project team need to develop a plan for the speedy capture of the necessary data so that it is all available for the first workshop.
We do not have the expectation that every department will have high quality naturally occurring data for every element and area of performance, and project teams will struggle with some areas more than others. Part of the task will be in identifying what data can be used as a proxy, and some of the subjects are more open to interpretation than others. It is up to the project team to discuss and agree what that interpretation should be.
As part of the management of the pre-workshop preparation stage, the project team will need to identify who will be capturing what data, by when, and how it will be interpreted and presented. To that end, project teams will need to consider how they will be communicating with the wider staff team about this task in order to generate co-operation and assistance. Project teams also need to set up their wider staff feedback and communications strategy for the transformation project as a while. Within this the team needs to consider the more formal transformation feedback mechanism which will help them to refine the transformation plan and improve implementation. One technique is to study feedback loops so as to improve communication within an organization. This can be done by:
Mapping out the existing communication channels within an organization, understanding why they are used and what they are used for, as well as exploring their frequency of use. This can help teams to understand how and where to improve information flow both internally and externally.
Evaluating the strengths and weaknesses of current feedback loops. By understanding which loops provide management with the most useful information and which can be flawed it helps inform future communications strategies. Teams need to consider both formal and informal feedback loops in their work, as many direct methods of communication with staff can lead to being told what people think the boss wants to know rather than being a true reflection.
Considering which feedback loops to use for which tasks. Not all feedback loops are born equal, and it is important to use the right tool for the job. This also feeds into eh question of formal versus informal feedback when trying to find out what people really think and considering the contribution newer tools such as social media can bring.
Exploring expectations and how they can be exceeded to create excellent and delight. If you do not know what someone’s expectations are – whether customer, stakeholder, or member of staff it is very difficult to either be able to exceed them or to accurately know when you have or have not done so. By analysing the types of inquiries that clients have and when they occur in the customer journey, it is possible to create communication systems which can be pro-actively deployed to deliver excellent feelings of customer service around these issues.
Product and service development. Customer feedback is especially important when developing new products and services, or in identifying how best to further enhance existing ones. Nothing beats actually asking people what they would like. Research shows that 40% of businesses fail due to insufficient market for their product or service, and good customer feedback at the development stage can save a lot of money later through improved design.
Having an effective communications strategy. This requires an understanding of what is and is not working at present. By considering concepts such as the Customer Journey, organisations can significantly improve the effectiveness of their customer communications, improve automation, and reduce the stress on customer service staff.
Time will need to be found before the workshop for the project team and the Steering Committee, aided by an external consultant to examine the data which has been collected at this point for sense checking, and to isolate initial points of leverage and interest for significantly improving the performance of the organization.
This is an important discussion which enables the organization leaders to privately examine what might be causing the problems, what options might be necessary for correction, and what leverage points they have for change. By giving the organization leaders a preview of the data, they are not blind-sided or caught flat-footed when further analysis takes place after the first workshop and are aware of the data led direction of travel before the vision setting session in workshop 2. We expect a succinct executive report to be created to present to the senior sponsoring management, targeted at informed decision making along with an Executive Briefing and Action Planning Session.
During the first workshop we will be exploring the data that has been collected and considering the initial picture it shows us. The point if this is to aid in the collection of further data to clarify and broaden understanding. The pre workshop expectation is that participants gather together what is there, maybe combining it with some simple surveys and other basic data collection mechanisms to give a general picture. Within the workshop we will be exploring why some items have been a struggle to collect, and what potential solutions to that could look like. A further data collection plan will be devised, and the expectation will be that the missing data will be available by workshop 2, where it will be used to inform the setting of the vision for the future.
The first workshop will introduce three key pieces of relevant theory to attendees: Human Relations Theory, Systems Theory and Quantitative Management. The research behind Human Relations Theory shows that staff satisfaction is related to the attention shown to people by management over the content of any specific change and can be an excellent starting point to understanding why team satisfaction levels are perhaps not what executives would like. The theory focuses management practice and understanding through the lens of the individual staffs needs and resultant behaviours of individuals and groups created by management inputs. This is an interpersonal approach to managing human beings, and considers organisations as made up of both formal and informal elements, with six basic propositions at its heart:
• People are more important than machines or economics
• The organizational environment is not an organized social context
• Individuals’ motivation is impacted by their relationships within the workplace
• Teamwork impacts motivation, and this requires the co-ordination and cooperation of individuals
• The relationships within a team must fulfil both individual and organizational objectives at the same time if they are to be effective
• Maximum results with minimum input generates desired levels of efficiency for both individuals and organizations
The Hawthorne studies were led by Professor Elton Mayo between 1924 – 1932 and were designed to evaluate the attitudes and psychological reactions of workers in on-the-job situations. Initially exploring the impact of illumination levels on worker productivity, the usefulness of the data generated by the study led it to be expanded to cover a broader range of workplace conditions. Across the experiments a key common theme was identified as important in group performance – the attention given to staff from management. These findings became known as the Hawthorne Effect – individuals perform better when given special attention. Wider findings from the study were:
• Job performance and output are significantly impacted by group dynamics.
• Groups have their own norms and beliefs, independent of the norms and beliefs of their individual members.
• The perceived meaning and importance of a person’s work is the primary determinant of output rather than pay.
• Employees do not respond best to command and control but prefer a cooperative attitude from superiors.
• Communication between management and staff is essential to understanding employee issues.
• Actual workplace culture sets production standards – despite any standards and culture set by managers.
Systems Theory encourages the consideration of the organisation as both a system and in the context of its external environment, looking at how different sub-systems interact to either create synergistic performance enhancement or long-term decline in performance.
During this workshop you will learn the fundamental concepts of System Theory and Thinking. You will understand how these concepts can be applied to your company. You will appreciate how they can be applied to organizations to create positive change.
Systems Theory can be used to define the environment in which your company exists and its role within its business environment. Systems Theory acts to define the boundary between the internal and external environments of the company. Systems Theory helps to define the inputs into the company and the outputs from the company.
Systems Thinking includes several important concepts;
The three laws of organizational systems; entropy, inertia and synergy.
Systems Thinking also identifies five characteristics of organizational systems;
1. Environment
2. Input-Throughput-Output
3. Dynamic Homeostasis and Feedback
4. Equivocality and Requisite Variety
5. Statistical Fluctuation and Covariance.
Finally, there are then a set of organizational system principles;
1. The activities within a system define the system and are interrelated and interdependent on each other.
2. The effectiveness of how an overall system functions is determined by how its subsystems function Inputs move into the system and outputs move out of the system through permeable and defined boundaries.
3. The permeability of the boundary can be controlled by the system.
4. It takes positive energy injected into the system to overcome entropy.
5. Levels of synergy are inherent in how interactive and interdependent parts of a system are with each other.
6. There are multiple ways to reach a desired outcome, in other words, there is no “one best way”.
7. Subsystems exit within a larger system and have the same characteristics and principles as the larger system.
The exponential expansion of data systems in business makes the application of Quantitative Management theory valid to all business contexts, but data is not a panacea and cannot be used to answer all management or leadership questions. The quantitative approach to management involves the use of quantitative techniques, such as statistics, information models, and computer simulations, to improve decision making. This school consists of several branches, described in the following sections.
Scientific management schools emerged to teach solutions to the problems associated with the logistics of global warfare. Managers are today encouraged to use mathematics, statistics, and other quantitative techniques to make the best management decisions.
Today computer models can be used to work out the best way to achieve a goal — saving organisations both money and time. Managers have a range of tools that they can deploy including;
• Mathematical forecasting – forecasts that make projections for use in the planning process.
• Inventory modelling – this enables Just In Time systems that optimise the levels of inventory help.
• Queuing theory that helps allocate staff and supporting resources to minimize customer wait times and service costs.
Operations management is a form of quantitative methodology used for management. Its I focus is the management of the processes of transforming materials, people, and capital into goods or services something which is a concern both manufacturing and service organizations. The transformation process is the operations or activities used to produce finished goods or services of value to customers or clients from the initial set of resources.
Modern Operations management pays close attention to the demands of quality, customer service, and competition. The process begins with attention to the needs of customers: What do they want? Where do they want it? When do they want it? Based on the answers to these questions, managers line up resources and take any action necessary to meet customer expectations.
Management information systems
Management information systems (MIS) is a recent development in the quantitative school of thinking. A management information system organizes data from the past, present and future from multiple sources and transform it into usable information. This information can then be used by managers with an organisation to information their decision making process. These information systems are able to rapidly and repeatedly organize data into usable and accessible formats.

Review
Learning through Action
The strength of the Team Performance Transformation process is that constant action and implementation of learning is required. The preparation and learning is the start of the process, the discussions and exploration then deepen the understanding, ready for the practical implementation of the learnings. It is this application that not only solidifies the new understanding but then enables further insights to be explored and analysed by the project team in the following workshops.
This adds a further dynamic to the process and empowers a process of continual improvement.
Leadership and management training must go beyond being an academic exercise. It is only when implemented that those leaders will define their individual styles and establish how they can best work with the theoretical training they have received. It is in the heat of the moment, when they experience their own reactions and feelings, while having to manage the team and their challenges, that they will fully understand and integrate their new skills and tools to create a positive successful transformational outcome.
The discussions around case studies, simulations and interactive games all play a crucial part, as that is where the confidence, capability and encouragement to apply the new principles starts to build. It is through these simulations that people become more comfortable with the new concepts and thinking, and the ideas around ‘best practice’ can be discussed. Added to this are the questions, frameworks and diagnostics the workshop provides, creating the tools that can help with the implementation of those new ‘best practices’ in the workplace.
This stress on implementation is also highly important for retention. 80% of learning is retained after three weeks if it immediately implemented. If this doesn’t happen, the retention rate of that learning drops massively, to as low as 20% after a three week period, jeopardising any success of the transformation process.
Further, when this learning is implemented immediately and starts to produce better results, the stakeholders start to see the value of the process, creating an environment of encouragement for the project team and for the workforce. With more people vested in the transformation, the process will naturally gain more positive momentum, speeding up the improvements in efficiency and productivity. This can then lead to further opportunities for the organisation to grow and prosper.
The Reason for Team Workshops
The reasons the Team Performance Transformation training must be given in a workshop environment to a carefully selected team is to give process the best chance of success.
Firstly, it must be given in a workshop style as the training needs to be viewed in the context of the current situation of the organisation. The project team will come with data and information that is current and not theoretical. Each participant needs to understand the current challenges they and their teams face.
Secondly, because a project team is present, each workshop becomes a catalyst for expanded learning through discussions and comparisons, helping each other understand how the process can be best implemented. The team becomes its own support network, both inside the workshop and outside in the daily running of business.
Thirdly, the team become the ambassadors of change, effecting many different parts of the organisation at once. This transformation process will require a change of thinking, operations, processes and culture. Therefore, they become a force for change, knowing it will lead to a better environment for the workforce and improved success of the organisation, a message that would be very difficult for a single person to put across.
Once this team starts to work with their component parts of the workforce, implementing the activities from the workshop that lead to positive change, the transformation process will gain momentum and support from people who are outside the workshop. That momentum will increase as the process of transformation is adopted by the teams themselves.
Role of the Learning Provider
The Appleton Greene Learning Provider will provide the training to the attendees, as well as facilitating the discussions, exercises and reviews held within each workshop. They will also provide the course materials as well as set the tasks for the preparation of each workshop.
Role of the Coach
Management of the transformation process is the Project Manager’s responsibility. This person can also be the same person as the individual who is serving as the Workshop Coach, (either an internal person or an outside Appleton Greene Consultant). This is a vital role, and the person selected should be both qualified and passionate about the Team Performance Transformation process. They must already have the necessary skills and experience to be able to oversee the action plans the teams will create during the workshops. They will also need to be familiar with the organisation’s operations, as they may need to be actively coaching team leaders through their own implementation. They may need to help the participants develop and implement the robust plans that are necessary to ensure the success of the process.
As the Learning Provider, we will work with and provide this person with a Facilitator’s Handbook, a monthly one-hour conference call (or ZOOM meeting) with the coach, offering email guidance and support when needed.
Single Point of Contact
Rather than cause confusion and unnecessary complications, we would stress the importance of having a single point of contact in the organisation. This would normally be the person responsible for the success of the transformation process. If there is a need for any other communication, then this designated person in the company needs to authorise that to happen. The communication channel would need to be agreed as well as the expected response times between communications.
The Importance of Great Communication
Great communication is vital at all levels for this process to work effectively. As important as they are between the Learning Provider and the agreed single contact, it is just as important for those between that designated person and the other learning participants. As Learning Provider, we will work with you to support communications at various stages of the transformation process, to provide consistency and avoid any confusion. We will also provide a FAQ (Frequently Asked Questions) sheet. Each organisation may want to add more information or revise for their unique situation, and this will be agreed at the start of the project.

Review Stages
To ensure that the Team Performance Transformation is kept on track with the initial goals set at the start of the process, there are two levels of review. These are monthly and annually.
Reviews
The value of the process must be measured by the results it produces and the success it brings. This is how the true Return on Investment is ascertained. Therefore, it is critical to ensure that the learning has taken place and can appropriately applied to the real-time problems or opportunities in the workplace. Goals will have been set and plans for their achievement will have been created, with clear measurements for their success.
The review also needs to assess the impact the training and the workshops have had on each of the participants. Therefore, there will be a review after each monthly workshop, a review each three months, and an annual review. These reviews do not have to be long and drawn out, but will focus on knowledge, skills, behaviours and the application of these to observed practice. On a wider level we will explore how the TPT process implementation is going, and the root causes of both success and any struggles to inform course and support changes.
Workshop Review
At end of every Workshop, participants (as Teams or as Individuals) will be asked several questions:
· “What have you learnt?”
· “How are you going to apply your learning?”
· “Are you confident to complete the work required by the next workshop?”
· “What is standing in the way of your success?”
· “What are you going to about overcoming this barrier?”
· “What Messages are you going to deliver to your Team or Organisation?”
· “Anything you would change to improve this Workshop?”
After every Workshop the Steering Committee will meet to digest the Participant’s feedback and suggest course adjustments to the Learning Provider.
Within each workshop there will be subtle and built-in testing of understanding with particpants knowledge and understanding as part of the teaching.
Monthly Implementation Review
A true picture of learner understanding comes from their ability to understand and apply key concepts and skills to their own practice in a quality manner. Generally, we see that learners who struggle to complete work have either failed to understand key areas of knowledge, need further practice to make new skills more secure before they can apply them to their practice, or either mindset or life has gotten in the way. We need to understand the reasons why a learner has not progressed in the way we expected so that we can offer enhanced support. This is one of the key drivers behind the use of the Harrison Assessment both prior to and during the first workshop. These state-of-the-art diagnostics give us a real insight into participants strengths and personalities – helping to inform how best to support their learning.
The formal Monthly Implementation Review is best carried out at the end of each month by the coach and the Client Steering Team. In addition to reviewing the work being completed by each participant these key questions will be covered:
· Have the objectives been achieved?
· Is the quality of work satisfactory?
· Is the volume of work acceptable?
· Can we see any early benefits from this month’s learning?
· What is standing in the way of success this month?
· What needs to happen to support success this month?
· What are the timelines for key actions?
· Who will be responsible for what tasks?
· Who should be informed or consulted during the application?
Support from the coach should be given to assist in helping the participants accomplish their tasks each month – focusing both on quality and quantity. The nature of their closeness to both the participants and the operation, they are in the best position to assist. We, as Learning Providers have a wealth of experience in applying the key learnings in the Program during our careers. We are available to the Coach if our support is required.
We are looking to have a close collaborative relationship with the coach so we can make changes to the programme to support and hiccups or successes on the transformation journey.
Annual Process Review
In the end the most important thing is that this transformation project works at improving business performance and meeting the objectives set out at the start. An idea can be amazing, but if it does not achieve the desired objectives it has to be considered a failure. Participants attention will be brought back to the key project objectives on a regular basis through the course as way of making sure the right decisions are being made.
The purpose of the annual review is to ensure the Client receives considerable value from the time, money, and human energy invested. The aim of the training provider is to exceed all expectations in the delivery of training and quality of workshops, so that the coach and all the participants can create a meaningful transformation of the teams within the organisation, creating a level of success that significantly advances the company’s standing.
The level of success can only be measured if the project teams are continuously feeding back demonstrable data.
This feedback must be both qualitative and quantitative, allowing all parties to be constantly learning and evolving, refining the process efficacy from teaching all the way through to implementing.
The Annual Process Review process starts at the commencement of the Programme with the collection and analysis of a large amount of data showing current levels of business performance. This is our baseline for demonstrating the impact of the first and second year efforts and how the success of those efforts will be measured.
These annual reviews should involve the entire Steering Team and should be assessing:
· the value delivered,
· marking the transformation success against specific, measurable targets,
· the Return on Investment of both time and money,
· any changes needed in content delivery, processes, media, support, or workshop management,
· any improvements required to ease the challenges of implementation
· any possible adaptations required to make it more relevant to specific audiences, including commentary around any new module or program development required.
It is vitally important the project team consult all stakeholders to determine their observations about the process, and the value it is bringing into the field of operations. This should include the perspective of the Senior Executive Team.
These three different reviews are vital to ensure that all stakeholders can see the effectiveness of the parts they are playing in the transformation process and also that the progress of the transformation is delivering measurable results and outcomes that are contributing to the success of the company.
It is crucial for the Senior Executive Team for these reviews to take place, as they will offer the necessary data that will enable them to see the tangible return on their investment.
Executive Summary

History
This first workshop has two key themes: data analysis and psychometrics
Data analysis is a process of inspecting, cleansing, transforming, and modelling data with the goal of discovering useful information, informing conclusions, and supporting decision-making. In ancient Iraq over 2000 years ago, scribes produced lists of ploughmen employed by the state, calculated their wages directly from this raw data and recorded this information on clay tablets – creating the first database and starting data analytics too. While recording systems technology may have evolved over the next 2000 years to finally use paper and typewriters, the big evolution did not occur until the 1960s with the creation of computers as decision-making support systems. Data can be used in a variety of ways within an organisation: it is the process of gathering information and making sense of it in order to make important decisions, to predict trends, and to improve your business.
The ability to process ever larger amounts of data has revolutionised the business world. But the ability of leaders, managers and staff to design systems that will enhance how a business is run lags behind what is technically possible. Whether it is in purchasing a ready made piece of software, or commissioning something bespoke, there is an art to picking a system which can answer the questions managers have in a timely and easy manner. Too often a system is designed to spit out the answer that someone else thought was interesting. So as a leader or manager you are left no further forward.
Historically there have been several key barriers for organisations to overcome in order to adapt to being data driven in their decision making, and these barriers are still relevant today. Four key barriers are: That the format of the data is not easily readable – this may be due to a reliance on paper forms, or a love of free text which can give great qualitative information but makes counting things difficult. Many businesses can feel overwhelmed with the volume of data to process, or find it difficult to identify the important data from the stuff which adds little value. How your data is stored makes a significant difference to your ability to both easily process it and to analyse it to get useful insights. How information is both collected and stored are key parts of the design process which organisations have needed to overcome. Finally, many organisations need to invest in the right equipment and skills for quality data analytics. The ability to produce a number is only half of the problem and many organisations have failed to historically invest sufficiently in developing management ability to interpret data accurately and use it to inform decision making.
There are several examples of businesses who have used data analytics to not just transform their business decision making but also their business model. In the UK, Tesco launched their Clubcard loyalty programme in 1995, long before internet shopping-based data harvesting. The data from the Clubcard meant Tesco learned that a few loyal customers accounted for most of their sales. Address data showed how far people travelled to their stores. These insights allowed Tesco to create tailored coupons and offers to nudge customer behaviour, this rewarded their loyal high spenders and pushed casual customers to engage more. Within the first year the data showed Clubcard customers spent on average 4% more than non-Clubcard customers. The Clubcard’s success for Tesco led to a stampede from other retailers towards rewards schemes and supported the brand in becoming the UK’s largest grocery store chain.
Psychometrics
The word psychometrics specifically refers to the body of work and practice the theory and technique of psychological measurement. This means the objective measurement of skills, knowledge, abilities, attitudes, personality traits, and educational achievement. As such it can significantly aid decision making concerning people, and help us to understand better how an individual or group may be suited to a particular task, activity or situation.
In Victorian Britain, Charles Darwin published “The Origin of Species”, which explored the reasons for individual differences in animals. He talked about how individual members in a species could differ as well as the characteristics of adaptation. Species who have more adaptive characteristics could be seen as the ones more likely to survive, with their next generation likely to be at least as adaptive and successful.
Francis Galton developed the first true psychometric test in the 1880s by taking Darwin’s work and applying it to humans. Galton’s key focus was to try to understand the psychological differences between people rather than their common traits. By measuring physical characteristics as well as sensory and motor skills he generated a score for intelligence. Sensory thresholds were measured via the use of brass instruments, as well reaction times to visual and auditory stimuli. Around 17,000 were tested by Galton proving that objective tests could provide meaningful scores. This work was expanded upon by Dr. James Cattell in 1890 in developing his ‘mental test’
By 1901 Clark Wissler, build on the work completed by Cattell in beginning the first basic validation research, and his work demonstrated there was no correlation found between Cattell’s mental test scores and academic achievement. His test sample only included bright college students and can be seen as being slightly disappointing. This work directly led to the development of Validity testing.
By 1905 Alfred Binet and Theodore Simon, developed a psychometric test designed to identify young children affected by mental deficiencies. This resulted in the first modern intelligence test – the Binet-Simon Intelligence Scale. This specifically tested for higher level psychological processes such as real abilities and practical judgments.
In the lead up to the First World War Robert Yerkes worked with the US Government to develop a test that could measure potential recruits ability to handle combat related stress – a key performance differentiator for the army. The project developed two tests with one being focused on generating meaningful responses to applicants with little or no literacy.
The final stage in the development of the modern psychometric came with the development of more advanced computer power in the 1980s creating the computerized adaptive test (CAT).
Current Position
Why is data analysis the starting point of the team performance transformation process? Because you can have all the vision you like for the future of your business, if you do not know where you stand currently then you vision is more like wishful thinking. If you do not have the systems in place to be able to clearly state the levels of current performance in the organisation then rectifying this becomes part of the transformation process. Being able to measure impact is an incredibly important part of the transformation process – knowing what is working, and being able to investigate the root causes of performance in real time transforms manager behaviour, from playing the blame game to understanding what is happening and being able to take calm corrective action before a dip turns into a crisis.
Today, most organisations use data to inform much decision making, but outside Silicon Valley, many can’t claim to be fully data-driven. The annual NewVantage Partners executive survey showed that only 24% of organisations questioned felt they had created a data-driven organization. To be fully data-driven requires leaders to rely on key metrics even when it’s not easy or convenient to do so. True data-driven organizations have culture of using data that permeates the entire firm and informs every aspect of performance and service, not just certain areas where people are excited about this stuff. The same survey also reported that 99% of firms have invested in data initiatives and 92% reported the pace of investment is accelerating mainly sue to changing attitudes and skill levels amongst staff.
Part of this is the ability of organisations to identify and inform staff performance, engagement and motivation levels. Team Performance Transformation is just as much about improving staff capabilities and satisfaction as it is about tracking other areas of business performance. Even in the most automated businesses, we are nothing without our staff. This is especially true for service organisations.
In addition to investing massively in data analytics to run the logistics and retail side of their business, Wal-Mart has also focused on capability metrics for staff. By looking at employee turnover and movement Wal-Mart can identify roles and career paths for their employees, identifying talent development and capability needs to enhance performance and satisfaction. They are also able to correlate staff metrics with customer experience data, creating improved performance, efficiency, and greater success across the board. One of the biggest indicators of the success of this approach is that more than a quarter of a million people have been with the company for over ten years – a huge achievement.
Key reasons holding many organisations back from becoming fully data driven include a lack of commitment from key decision makers. The 2016 executive survey by McKinsey, counted this as the biggest contributing factor to analytics success or failure. But this is not the only barrier. Many organisations do not have a data strategy which is well aligned with business goals. You cannot collect data for the sake of it. And this lack of alignment can led to poor purchasing decisions where the choices over what to invest in get politicised or turn into vanity projects. Accenture found that only 33% of firms reported they trusted “their data enough to use it effectively and derive value from it.”. This comes back to organisation culture and the fact that data led decisions can only be as good as the data they are based on. Clean data and quality data entry are both design and quality assurance issues. Businesses can design systems which are robust and able to work properly even during times of stress and can create the business culture which sees doing things right first time as the only acceptable level of performance. All of this takes a lot of effort, which comes back to the desire of the senior leadership team.
A further issue that can impede the drive for data led decision making can be a workforce lacking in the skills and comfort to work with data. A recent Qlik/Accenture survey revealed only 21% of workers were fully confident in their data literacy skills. They explained this can be as basic as “the ability to read, understand, question and work with data”. This is rather concerning as just because staff have more data at their disposal, if they do not have the skills to process it effectively it losses it’s value to inform decision making. In the same survey 74% of respondents expressed feeling overwhelmed or unhappy when working with data, showing this is a real issue impacting performance now. This is not just an issue affecting junior staff, Deloitte found 67% of managers and executives reported they were not comfortable accessing or using data from their analytics tools. This demonstrates it is not enough to provide the tools and systems, staff at all levels in the organisation need to be both trained to use the tolls and performance managed to do so. It is not all depressing though, a 2015 McKinsey study found companies that invested in a rigorous change management approach reported a 79% success rate—three times the average for all other initiatives and demonstrating the importance of the kind of transformation process you are exploring here.
Current applications of psychometrics focus heavily within recruitment functions with 80% of Fortune 500 firms using psychometric tests in some capacity to make recruitment decisions, looking to make more reliable and less risky decisions and to try and predict future staff performance. Key benefits include objective measurement of certain abilities and interests against the general population, so rather than having to ask about a person’s work tempo where they cannot answer the question accurately compares this to others, producing a better quality answer. Psychometric tests help to identify what people really like, enjoy or find stressful as opposed to what they want you to think about them, or what they are trying to persuade themselves is the situation. This greatly enhances interviewing.
Psychometrics are also used to assess organisational culture. The real one, not what people would like it to be. A major part of culture is driven by who you have actually working in the business and how they naturally like to operate. This is not the same as the preferences that drive specific job match. So a person can be a great match for a job, but not a great match to the personality of the organisation. This thinking can help inform cultural change issues. Workplace fit is not just about culture, it is also adaptiveness to work environment. So many people find it tough to work as part of a team, or struggle to concentrate in a noisy busy environment. Knowing this ahead of time helps improve decision making – why knowingly make a person miserable and sub-optimally effective by placing them in an uncomfortable environment when a couple of subtle changes can create a better chance of success?
And finally, research by Google examined the relationship between interview performance and future job performance. Across a sample of tens of thousands of people they found zero relationship. Many companies have found that not all psychometrics are equally good, and there are certain groups of people who really struggle to engage with an on-line test. But overall, psychometrics are contributing a lot to many organisations understanding of their people and how to get the best out of them – a key to maximising performance.

Future Outlook
In the future, all organisations will be much more data driven than they are today. Management teams and individuals will be set up to make strategic and tactical decisions based on data rather than opinion or gut instinct. Increasingly, processes will be automated so that decisions and actions will be taken with minimal human intervention. The art will be in creating these automations so that they feel personalised and not ‘computer says no’.
Research shows that companies which already use data to analyse the effectiveness of their marketing plans and so make data-driven decisions achieve results six times better than their non data driven rivals. For many businesses, the pareto principle holds so that 80% of sales can be attributed to a small number of customers. Understanding and responding to that impacts sales and account management tactics. Amazing customer tracking data gives the power to businesses to influence and nudge those loyal customers to return and spend more. It is hard to really understand what is important to customers without being able to ask them. This questioning can be done through surveys, but also via social media, and promotions. These all generate data to be interpreted. There are plenty of case studies of organisations who are doing this well, but the art is in applying this to a different market or business context – understanding the nub of the genius to be exported and what is not important.
External benchmarking is not a new phenomenon, but in the future organisations will use increasingly sophisticated methos to merge data from ever more sources to create ever more intricate opportunities for business insights.
Think about being able to combine internal data with social media feeds, external sources and data captured via the Internet of Things.
Cloud-based data sources make it possible for companies to benchmark their performance to their competitors. They can use publicly available data to find out how their competitors are doing and do complex analytics on the relative performance. Data analytics can be used to set internal goals for the business and measure progress towards those goals. Historical trend data can be used to forecast business performance going forward.
Gartner predicts that, by the end of 2024, most organizations will have transitioned away from initial pilot programs and experiments to fully-operationalized Big Data strategies. This shift to full production use of the technology will greatly increase the amount of data flowing around the internet lead to significant growth in the complexity of organisations analytics structures. As the number of data sources in every day use group businesses will call increasingly on AI, machine learning and natural language processing to untangle the complexity withing the business data sets. They will become vital to obtain answers to key business questions in a timely manner.
Gartner coined the phrase Augmented analytics in 2017. It refers to a process of automating data analysis and the generation of insights using natural language processing and machine learning. This is a logical evolution in the analysis of Big Data and will be vital aid to data analysts going forward as the seek to offer businesses solutions to the increasing challenges linked to the sheer volume of data that some companies are now seeking to process and exploit.
This will help to democratise the access to data insights making workers more data-driven. Data Science will become an everyday skillset within the workplace. AI and the augmented analytics will help organisations address the growing shortage of skilled workers.
Most traditional BI tools were hypothesis driven, the analyst setup to prove or disprove an idea. With AI based platforms the tools are able to process and test hundreds of hypotheses at a time. They can look for previously undreamt of correlations between data points. Relationships that we would previously never have dreamt of looking for.
The platforms include capabilities to do things like Natural Language based queries making it easier for untrained users to enter queries. Think Google search queries. The systems can then make recommendations based on those answers and explain the basis for those recommendations. Think Amazon recommending what books to read next on your Kindle.
Putting NLP in front of complex talks provides for all manner of innovations where BI systems that were previously complex to use become readily available to the masses to use. As has always been the case though data literacy will still be an issue. Users will need to understand the factors that influence the quality of recommendations these systems produce. Garbage in Garbage out will still very much apply, bias of all forms within data sets will still be present waiting to catch us out when we least expect it. Organisation will need to train their staff to recognise the risks inherent in these technologies.
As Internet of Things adoption grows, continuous intelligence is likely to have a big impact; the technology brings real-time analytics into business operations by processing data in real time, analysing incoming data against long term trends, and recommending actions instantly.
5G has huge potential not only due to the higher connection speed, its low-latency, continuous coverage will support technologies like smart infrastructure, autonomous vehicles, and automated public transport networks. Big Data is likely to get a lot bigger which will present a huge problem to companies that are late adopters of the technology that are still trying to become truly data driven.
Prescriptive and predictive analytics are already popular. COVID-19 has brought this type of analytics to the masses. The new wave of Analytics will make it easier for companies to deal with this type of market disruption in future. They will be able to model the impact of multiple shocks to global systems and the impacts they are likely to have. The leaders will be able to use the trends in the big data to weave an efficient path around the bumps in the road.
These complex data trends will make it possible to model different responses to black swan events this is due, in part, to the rise in “X Analytics.” X Analytics, a term recently coined by the Gartner research firm, is the ability to run any type of analytics on all of an organization’s structured and unstructured data, no matter where or in what format that data resides. This will become increasingly important. The pandemic changed customer behaviour significantly, forcing rapid change of digital systems globally.
Data Visualisation skills will be at a premium, the ability to take formerly dry dense reports and transform them into compelling easy to consume visuals will be key to reaching a wider market. This will have a particular impact for sales and marketing professionals who are used to generating insights that tap into prospective clients emotional need to purchase.
The flat graphs in the sales brochures of yesterday year will be replaced by moving interactive projections based on real world data. They will become an increasingly powerful value add in the sales process.
Within organisations visualizations will be used to aid more decisions and increasingly complex decisions at that — everything from approving a new product, to reworking a supply chain process to working out where an organisations competitive advantage lies.
As alluded to earlier data quality and how to manage it will be the biggest challenge. Data volumes are already expanding at exponential rates this will continue. 5G, Internet of Things and the increasing ability of organisations to mine unstructured information will only lead to an increase in the amount of data available.
There are 12 course manuals for this first workshop, designed to support participants to be able to effectively complete their data analysis by the second workshop, and to generate a real understand of current levels of organisational performance:
SWOT Analysis: There is a reason why this is an evergreen analysis technique covered in every business school and at every level of business education. It works. This exercise is designed partly as a get to know you, and also to capture different perspectives about what is going on in the organisation at the moment.

PESTLE Analysis: SWOTs bigger brother, and again probably nothing that you haven’t used before. For us to deliver really effective training we need to understand both your business and your context, and there may be several members of the project team who have never completed a PESTLE for your firm. And your external context has a habit of changing over time, so it is good practice to update PESTLE regularly even when it is a key part of your management practice.

Initial Data Findings: In preparation for this workshop, participants have collected a lot of data. Now we need to begin the work of making sense of this data and understanding what we have and if it is any use. Most modern businesses are swamped with data, and the key is in picking the good from the pointless. This is our first chance to really see what the project team have managed to achieve and to get an idea of the broad themes of this transformation.

Benchmarking: Data without context is just information. Benchmarking is a key technique for delivering context – both internal and external comparisons are valid and can be used to help inform analysis such as SWOT and PESTLE. Something you may consider a weakness may not be when your current performance is compared to others. This does not mean you won’t take action to improve performance further, but this may be given less urgency.

Quantitative Management: The proliferation of data in the world has led to the development of new management theories to support practice. This can aid staff to adopt new ways of working by understanding the theoretical benefits. Naturally analytical people find quantitative management to be natural to them. Those who are naturally highly intuitive who do not enjoy working with data find this challenging.

Human Relations Theory: We can have all the data in the world, but human interaction drives work performance and satisfaction. A transformation project which is not rooted in understanding and applying this will not be successful. And the point of this transformation is to Supercharge Performance. There is much to learn and apply from the Hawthorn experiments which are still as relevant in their findings now as they were a century ago.

Quality Assurance: Quality is one of the big themes of Supercharged Performance, and one we will be coming back to again and again. Being able to define what this word means for your organisation is an important technique for then driving quality improvement. For us, we are looking to understand what quality means to you as a business now, and what you would like it to mean in the future. There is a body of theory and practice about how managing quality leads to significantly improved business performance, and we will start unpicking it here.

Case Study: Sports Direct: Sports Direct is one of the largest, most aggressive retailers in the UK. There is much to admire in their rapid expansion while others have contracted or gone under during the past decade. But that is not to say that the business practices are perfect. Exploring this case study is designed to help participants start to pull together the strands of learning in this workshop and start to apply them holistically.

Systems Theory: Organisations are an eco-system of connected parts operating within an external environment which influences strategy and choices. We will be using the Sports Direct case study to explore some of the key questions and learning from systems theory and apply it to a more practical context. This will allow participants to be better able to apply this to your organisation.

Root Cause Analysis: Quantitative Management Theory pushes us to use data to make decisions, tools such as SWOT and PESTLE encourage judgement making. Now we need a methodology to explore why things are as they are, and to undercover the things that need to change if we want to have a different outcome. Again, this is a very well-established tool, but in our experience, it is not necessarily a standard part of day to day management practice. In terms of setting the direction for future transformation, it is a critical technique for correct diagnosis.

Identifying Data Gaps: We do not expect participants to arrive at this workshop having perfectly collected every piece of data which is relevant to the task at hand. And for this data set to be so perfect that it has managed to justify every statement from the SWOT, PESTLE, benchmarking, quality assurance, and root cause analysis. This then is where we start thinking about what needs to be collected before the next workshop and the best way to collect it. This manual also adds in some sensible data collection best practice.

System Architecture Plan: This does indeed sound scary to everyone who is not part of the IT department. Simply put, it is a diagram which shows what IT assets the organisation has at its disposal. This might be physical systems, software, cloud based, in a server room, and across all sites. Why is this important? Because in order to transform how the organisation is working the team need to understand what is already there – for every site and every department. Including all the unofficial workarounds. This will take time to collect, which is why we are introducing it in the first workshop, so it will be ready for workshop 5.
Curriculum

Supercharged Performance – Workshop 1 – Situation Review
- SWOT Analysis
- PESTLE Analysis
- Initial Data Findings
- Benchmarking
- Quantitative Management
- Human Relations Theory
- Quality Assurance
- Case Study: Sports Direct
- Systems Theory
- Root Cause Analysis
- Identifying Data Gaps
- System Architecture Planning
Distance Learning

Introduction
Welcome to Appleton Greene and thank you for enrolling on the Supercharged Performance corporate training program. You will be learning through our unique facilitation via distance-learning method, which will enable you to practically implement everything that you learn academically. The methods and materials used in your program have been designed and developed to ensure that you derive the maximum benefits and enjoyment possible. We hope that you find the program challenging and fun to do. However, if you have never been a distance-learner before, you may be experiencing some trepidation at the task before you. So we will get you started by giving you some basic information and guidance on how you can make the best use of the modules, how you should manage the materials and what you should be doing as you work through them. This guide is designed to point you in the right direction and help you to become an effective distance-learner. Take a few hours or so to study this guide and your guide to tutorial support for students, while making notes, before you start to study in earnest.
Study environment
You will need to locate a quiet and private place to study, preferably a room where you can easily be isolated from external disturbances or distractions. Make sure the room is well-lit and incorporates a relaxed, pleasant feel. If you can spoil yourself within your study environment, you will have much more of a chance to ensure that you are always in the right frame of mind when you do devote time to study. For example, a nice fire, the ability to play soft soothing background music, soft but effective lighting, perhaps a nice view if possible and a good size desk with a comfortable chair. Make sure that your family know when you are studying and understand your study rules. Your study environment is very important. The ideal situation, if at all possible, is to have a separate study, which can be devoted to you. If this is not possible then you will need to pay a lot more attention to developing and managing your study schedule, because it will affect other people as well as yourself. The better your study environment, the more productive you will be.
Study tools & rules
Try and make sure that your study tools are sufficient and in good working order. You will need to have access to a computer, scanner and printer, with access to the internet. You will need a very comfortable chair, which supports your lower back, and you will need a good filing system. It can be very frustrating if you are spending valuable study time trying to fix study tools that are unreliable, or unsuitable for the task. Make sure that your study tools are up to date. You will also need to consider some study rules. Some of these rules will apply to you and will be intended to help you to be more disciplined about when and how you study. This distance-learning guide will help you and after you have read it you can put some thought into what your study rules should be. You will also need to negotiate some study rules for your family, friends or anyone who lives with you. They too will need to be disciplined in order to ensure that they can support you while you study. It is important to ensure that your family and friends are an integral part of your study team. Having their support and encouragement can prove to be a crucial contribution to your successful completion of the program. Involve them in as much as you can.
Successful distance-learning
Distance-learners are freed from the necessity of attending regular classes or workshops, since they can study in their own way, at their own pace and for their own purposes. But unlike traditional internal training courses, it is the student’s responsibility, with a distance-learning program, to ensure that they manage their own study contribution. This requires strong self-discipline and self-motivation skills and there must be a clear will to succeed. Those students who are used to managing themselves, are good at managing others and who enjoy working in isolation, are more likely to be good distance-learners. It is also important to be aware of the main reasons why you are studying and of the main objectives that you are hoping to achieve as a result. You will need to remind yourself of these objectives at times when you need to motivate yourself. Never lose sight of your long-term goals and your short-term objectives. There is nobody available here to pamper you, or to look after you, or to spoon-feed you with information, so you will need to find ways to encourage and appreciate yourself while you are studying. Make sure that you chart your study progress, so that you can be sure of your achievements and re-evaluate your goals and objectives regularly.
Self-assessment
Appleton Greene training programs are in all cases post-graduate programs. Consequently, you should already have obtained a business-related degree and be an experienced learner. You should therefore already be aware of your study strengths and weaknesses. For example, which time of the day are you at your most productive? Are you a lark or an owl? What study methods do you respond to the most? Are you a consistent learner? How do you discipline yourself? How do you ensure that you enjoy yourself while studying? It is important to understand yourself as a learner and so some self-assessment early on will be necessary if you are to apply yourself correctly. Perform a SWOT analysis on yourself as a student. List your internal strengths and weaknesses as a student and your external opportunities and threats. This will help you later on when you are creating a study plan. You can then incorporate features within your study plan that can ensure that you are playing to your strengths, while compensating for your weaknesses. You can also ensure that you make the most of your opportunities, while avoiding the potential threats to your success.
Accepting responsibility as a student
Training programs invariably require a significant investment, both in terms of what they cost and in the time that you need to contribute to study and the responsibility for successful completion of training programs rests entirely with the student. This is never more apparent than when a student is learning via distance-learning. Accepting responsibility as a student is an important step towards ensuring that you can successfully complete your training program. It is easy to instantly blame other people or factors when things go wrong. But the fact of the matter is that if a failure is your failure, then you have the power to do something about it, it is entirely in your own hands. If it is always someone else’s failure, then you are powerless to do anything about it. All students study in entirely different ways, this is because we are all individuals and what is right for one student, is not necessarily right for another. In order to succeed, you will have to accept personal responsibility for finding a way to plan, implement and manage a personal study plan that works for you. If you do not succeed, you only have yourself to blame.
Planning
By far the most critical contribution to stress, is the feeling of not being in control. In the absence of planning we tend to be reactive and can stumble from pillar to post in the hope that things will turn out fine in the end. Invariably they don’t! In order to be in control, we need to have firm ideas about how and when we want to do things. We also need to consider as many possible eventualities as we can, so that we are prepared for them when they happen. Prescriptive Change, is far easier to manage and control, than Emergent Change. The same is true with distance-learning. It is much easier and much more enjoyable, if you feel that you are in control and that things are going to plan. Even when things do go wrong, you are prepared for them and can act accordingly without any unnecessary stress. It is important therefore that you do take time to plan your studies properly.
Management
Once you have developed a clear study plan, it is of equal importance to ensure that you manage the implementation of it. Most of us usually enjoy planning, but it is usually during implementation when things go wrong. Targets are not met and we do not understand why. Sometimes we do not even know if targets are being met. It is not enough for us to conclude that the study plan just failed. If it is failing, you will need to understand what you can do about it. Similarly if your study plan is succeeding, it is still important to understand why, so that you can improve upon your success. You therefore need to have guidelines for self-assessment so that you can be consistent with performance improvement throughout the program. If you manage things correctly, then your performance should constantly improve throughout the program.
Study objectives & tasks
The first place to start is developing your program objectives. These should feature your reasons for undertaking the training program in order of priority. Keep them succinct and to the point in order to avoid confusion. Do not just write the first things that come into your head because they are likely to be too similar to each other. Make a list of possible departmental headings, such as: Customer Service; E-business; Finance; Globalization; Human Resources; Technology; Legal; Management; Marketing and Production. Then brainstorm for ideas by listing as many things that you want to achieve under each heading and later re-arrange these things in order of priority. Finally, select the top item from each department heading and choose these as your program objectives. Try and restrict yourself to five because it will enable you to focus clearly. It is likely that the other things that you listed will be achieved if each of the top objectives are achieved. If this does not prove to be the case, then simply work through the process again.
Study forecast
As a guide, the Appleton Greene Supercharged Performance corporate training program should take 12-18 months to complete, depending upon your availability and current commitments. The reason why there is such a variance in time estimates is because every student is an individual, with differing productivity levels and different commitments. These differentiations are then exaggerated by the fact that this is a distance-learning program, which incorporates the practical integration of academic theory as an as a part of the training program. Consequently all of the project studies are real, which means that important decisions and compromises need to be made. You will want to get things right and will need to be patient with your expectations in order to ensure that they are. We would always recommend that you are prudent with your own task and time forecasts, but you still need to develop them and have a clear indication of what are realistic expectations in your case. With reference to your time planning: consider the time that you can realistically dedicate towards study with the program every week; calculate how long it should take you to complete the program, using the guidelines featured here; then break the program down into logical modules and allocate a suitable proportion of time to each of them, these will be your milestones; you can create a time plan by using a spreadsheet on your computer, or a personal organizer such as MS Outlook, you could also use a financial forecasting software; break your time forecasts down into manageable chunks of time, the more specific you can be, the more productive and accurate your time management will be; finally, use formulas where possible to do your time calculations for you, because this will help later on when your forecasts need to change in line with actual performance. With reference to your task planning: refer to your list of tasks that need to be undertaken in order to achieve your program objectives; with reference to your time plan, calculate when each task should be implemented; remember that you are not estimating when your objectives will be achieved, but when you will need to focus upon implementing the corresponding tasks; you also need to ensure that each task is implemented in conjunction with the associated training modules which are relevant; then break each single task down into a list of specific to do’s, say approximately ten to do’s for each task and enter these into your study plan; once again you could use MS Outlook to incorporate both your time and task planning and this could constitute your study plan; you could also use a project management software like MS Project. You should now have a clear and realistic forecast detailing when you can expect to be able to do something about undertaking the tasks to achieve your program objectives.
Performance management
It is one thing to develop your study forecast, it is quite another to monitor your progress. Ultimately it is less important whether you achieve your original study forecast and more important that you update it so that it constantly remains realistic in line with your performance. As you begin to work through the program, you will begin to have more of an idea about your own personal performance and productivity levels as a distance-learner. Once you have completed your first study module, you should re-evaluate your study forecast for both time and tasks, so that they reflect your actual performance level achieved. In order to achieve this you must first time yourself while training by using an alarm clock. Set the alarm for hourly intervals and make a note of how far you have come within that time. You can then make a note of your actual performance on your study plan and then compare your performance against your forecast. Then consider the reasons that have contributed towards your performance level, whether they are positive or negative and make a considered adjustment to your future forecasts as a result. Given time, you should start achieving your forecasts regularly.
With reference to time management: time yourself while you are studying and make a note of the actual time taken in your study plan; consider your successes with time-efficiency and the reasons for the success in each case and take this into consideration when reviewing future time planning; consider your failures with time-efficiency and the reasons for the failures in each case and take this into consideration when reviewing future time planning; re-evaluate your study forecast in relation to time planning for the remainder of your training program to ensure that you continue to be realistic about your time expectations. You need to be consistent with your time management, otherwise you will never complete your studies. This will either be because you are not contributing enough time to your studies, or you will become less efficient with the time that you do allocate to your studies. Remember, if you are not in control of your studies, they can just become yet another cause of stress for you.
With reference to your task management: time yourself while you are studying and make a note of the actual tasks that you have undertaken in your study plan; consider your successes with task-efficiency and the reasons for the success in each case; take this into consideration when reviewing future task planning; consider your failures with task-efficiency and the reasons for the failures in each case and take this into consideration when reviewing future task planning; re-evaluate your study forecast in relation to task planning for the remainder of your training program to ensure that you continue to be realistic about your task expectations. You need to be consistent with your task management, otherwise you will never know whether you are achieving your program objectives or not.
Keeping in touch
You will have access to qualified and experienced professors and tutors who are responsible for providing tutorial support for your particular training program. So don’t be shy about letting them know how you are getting on. We keep electronic records of all tutorial support emails so that professors and tutors can review previous correspondence before considering an individual response. It also means that there is a record of all communications between you and your professors and tutors and this helps to avoid any unnecessary duplication, misunderstanding, or misinterpretation. If you have a problem relating to the program, share it with them via email. It is likely that they have come across the same problem before and are usually able to make helpful suggestions and steer you in the right direction. To learn more about when and how to use tutorial support, please refer to the Tutorial Support section of this student information guide. This will help you to ensure that you are making the most of tutorial support that is available to you and will ultimately contribute towards your success and enjoyment with your training program.
Work colleagues and family
You should certainly discuss your program study progress with your colleagues, friends and your family. Appleton Greene training programs are very practical. They require you to seek information from other people, to plan, develop and implement processes with other people and to achieve feedback from other people in relation to viability and productivity. You will therefore have plenty of opportunities to test your ideas and enlist the views of others. People tend to be sympathetic towards distance-learners, so don’t bottle it all up in yourself. Get out there and share it! It is also likely that your family and colleagues are going to benefit from your labors with the program, so they are likely to be much more interested in being involved than you might think. Be bold about delegating work to those who might benefit themselves. This is a great way to achieve understanding and commitment from people who you may later rely upon for process implementation. Share your experiences with your friends and family.
Making it relevant
The key to successful learning is to make it relevant to your own individual circumstances. At all times you should be trying to make bridges between the content of the program and your own situation. Whether you achieve this through quiet reflection or through interactive discussion with your colleagues, client partners or your family, remember that it is the most important and rewarding aspect of translating your studies into real self-improvement. You should be clear about how you want the program to benefit you. This involves setting clear study objectives in relation to the content of the course in terms of understanding, concepts, completing research or reviewing activities and relating the content of the modules to your own situation. Your objectives may understandably change as you work through the program, in which case you should enter the revised objectives on your study plan so that you have a permanent reminder of what you are trying to achieve, when and why.
Distance-learning check-list
Prepare your study environment, your study tools and rules.
Undertake detailed self-assessment in terms of your ability as a learner.
Create a format for your study plan.
Consider your study objectives and tasks.
Create a study forecast.
Assess your study performance.
Re-evaluate your study forecast.
Be consistent when managing your study plan.
Use your Appleton Greene Certified Learning Provider (CLP) for tutorial support.
Make sure you keep in touch with those around you.
Tutorial Support

Programs
Appleton Greene uses standard and bespoke corporate training programs as vessels to transfer business process improvement knowledge into the heart of our clients’ organizations. Each individual program focuses upon the implementation of a specific business process, which enables clients to easily quantify their return on investment. There are hundreds of established Appleton Greene corporate training products now available to clients within customer services, e-business, finance, globalization, human resources, information technology, legal, management, marketing and production. It does not matter whether a client’s employees are located within one office, or an unlimited number of international offices, we can still bring them together to learn and implement specific business processes collectively. Our approach to global localization enables us to provide clients with a truly international service with that all important personal touch. Appleton Greene corporate training programs can be provided virtually or locally and they are all unique in that they individually focus upon a specific business function. They are implemented over a sustainable period of time and professional support is consistently provided by qualified learning providers and specialist consultants.
Support available
You will have a designated Certified Learning Provider (CLP) and an Accredited Consultant and we encourage you to communicate with them as much as possible. In all cases tutorial support is provided online because we can then keep a record of all communications to ensure that tutorial support remains consistent. You would also be forwarding your work to the tutorial support unit for evaluation and assessment. You will receive individual feedback on all of the work that you undertake on a one-to-one basis, together with specific recommendations for anything that may need to be changed in order to achieve a pass with merit or a pass with distinction and you then have as many opportunities as you may need to re-submit project studies until they meet with the required standard. Consequently the only reason that you should really fail (CLP) is if you do not do the work. It makes no difference to us whether a student takes 12 months or 18 months to complete the program, what matters is that in all cases the same quality standard will have been achieved.
Support Process
Please forward all of your future emails to the designated (CLP) Tutorial Support Unit email address that has been provided and please do not duplicate or copy your emails to other AGC email accounts as this will just cause unnecessary administration. Please note that emails are always answered as quickly as possible but you will need to allow a period of up to 20 business days for responses to general tutorial support emails during busy periods, because emails are answered strictly within the order in which they are received. You will also need to allow a period of up to 30 business days for the evaluation and assessment of project studies. This does not include weekends or public holidays. Please therefore kindly allow for this within your time planning. All communications are managed online via email because it enables tutorial service support managers to review other communications which have been received before responding and it ensures that there is a copy of all communications retained on file for future reference. All communications will be stored within your personal (CLP) study file here at Appleton Greene throughout your designated study period. If you need any assistance or clarification at any time, please do not hesitate to contact us by forwarding an email and remember that we are here to help. If you have any questions, please list and number your questions succinctly and you can then be sure of receiving specific answers to each and every query.
Time Management
It takes approximately 1 Year to complete the Supercharged Performance corporate training program, incorporating 12 x 6-hour monthly workshops. Each student will also need to contribute approximately 4 hours per week over 1 Year of their personal time. Students can study from home or work at their own pace and are responsible for managing their own study plan. There are no formal examinations and students are evaluated and assessed based upon their project study submissions, together with the quality of their internal analysis and supporting documents. They can contribute more time towards study when they have the time to do so and can contribute less time when they are busy. All students tend to be in full time employment while studying and the Supercharged Performance program is purposely designed to accommodate this, so there is plenty of flexibility in terms of time management. It makes no difference to us at Appleton Greene, whether individuals take 12-18 months to complete this program. What matters is that in all cases the same standard of quality will have been achieved with the standard and bespoke programs that have been developed.
Distance Learning Guide
The distance learning guide should be your first port of call when starting your training program. It will help you when you are planning how and when to study, how to create the right environment and how to establish the right frame of mind. If you can lay the foundations properly during the planning stage, then it will contribute to your enjoyment and productivity while training later. The guide helps to change your lifestyle in order to accommodate time for study and to cultivate good study habits. It helps you to chart your progress so that you can measure your performance and achieve your goals. It explains the tools that you will need for study and how to make them work. It also explains how to translate academic theory into practical reality. Spend some time now working through your distance learning guide and make sure that you have firm foundations in place so that you can make the most of your distance learning program. There is no requirement for you to attend training workshops or classes at Appleton Greene offices. The entire program is undertaken online, program course manuals and project studies are administered via the Appleton Greene web site and via email, so you are able to study at your own pace and in the comfort of your own home or office as long as you have a computer and access to the internet.
How To Study
The how to study guide provides students with a clear understanding of the Appleton Greene facilitation via distance learning training methods and enables students to obtain a clear overview of the training program content. It enables students to understand the step-by-step training methods used by Appleton Greene and how course manuals are integrated with project studies. It explains the research and development that is required and the need to provide evidence and references to support your statements. It also enables students to understand precisely what will be required of them in order to achieve a pass with merit and a pass with distinction for individual project studies and provides useful guidance on how to be innovative and creative when developing your Unique Program Proposition (UPP).
Tutorial Support
Tutorial support for the Appleton Greene Supercharged Performance corporate training program is provided online either through the Appleton Greene Client Support Portal (CSP), or via email. All tutorial support requests are facilitated by a designated Program Administration Manager (PAM). They are responsible for deciding which professor or tutor is the most appropriate option relating to the support required and then the tutorial support request is forwarded onto them. Once the professor or tutor has completed the tutorial support request and answered any questions that have been asked, this communication is then returned to the student via email by the designated Program Administration Manager (PAM). This enables all tutorial support, between students, professors and tutors, to be facilitated by the designated Program Administration Manager (PAM) efficiently and securely through the email account. You will therefore need to allow a period of up to 20 business days for responses to general support queries and up to 30 business days for the evaluation and assessment of project studies, because all tutorial support requests are answered strictly within the order in which they are received. This does not include weekends or public holidays. Consequently you need to put some thought into the management of your tutorial support procedure in order to ensure that your study plan is feasible and to obtain the maximum possible benefit from tutorial support during your period of study. Please retain copies of your tutorial support emails for future reference. Please ensure that ALL of your tutorial support emails are set out using the format as suggested within your guide to tutorial support. Your tutorial support emails need to be referenced clearly to the specific part of the course manual or project study which you are working on at any given time. You also need to list and number any questions that you would like to ask, up to a maximum of five questions within each tutorial support email. Remember the more specific you can be with your questions the more specific your answers will be too and this will help you to avoid any unnecessary misunderstanding, misinterpretation, or duplication. The guide to tutorial support is intended to help you to understand how and when to use support in order to ensure that you get the most out of your training program. Appleton Greene training programs are designed to enable you to do things for yourself. They provide you with a structure or a framework and we use tutorial support to facilitate students while they practically implement what they learn. In other words, we are enabling students to do things for themselves. The benefits of distance learning via facilitation are considerable and are much more sustainable in the long-term than traditional short-term knowledge sharing programs. Consequently you should learn how and when to use tutorial support so that you can maximize the benefits from your learning experience with Appleton Greene. This guide describes the purpose of each training function and how to use them and how to use tutorial support in relation to each aspect of the training program. It also provides useful tips and guidance with regard to best practice.
Tutorial Support Tips
Students are often unsure about how and when to use tutorial support with Appleton Greene. This Tip List will help you to understand more about how to achieve the most from using tutorial support. Refer to it regularly to ensure that you are continuing to use the service properly. Tutorial support is critical to the success of your training experience, but it is important to understand when and how to use it in order to maximize the benefit that you receive. It is no coincidence that those students who succeed are those that learn how to be positive, proactive and productive when using tutorial support.
Be positive and friendly with your tutorial support emails
Remember that if you forward an email to the tutorial support unit, you are dealing with real people. “Do unto others as you would expect others to do unto you”. If you are positive, complimentary and generally friendly in your emails, you will generate a similar response in return. This will be more enjoyable, productive and rewarding for you in the long-term.
Think about the impression that you want to create
Every time that you communicate, you create an impression, which can be either positive or negative, so put some thought into the impression that you want to create. Remember that copies of all tutorial support emails are stored electronically and tutors will always refer to prior correspondence before responding to any current emails. Over a period of time, a general opinion will be arrived at in relation to your character, attitude and ability. Try to manage your own frustrations, mood swings and temperament professionally, without involving the tutorial support team. Demonstrating frustration or a lack of patience is a weakness and will be interpreted as such. The good thing about communicating in writing, is that you will have the time to consider your content carefully, you can review it and proof-read it before sending your email to Appleton Greene and this should help you to communicate more professionally, consistently and to avoid any unnecessary knee-jerk reactions to individual situations as and when they may arise. Please also remember that the CLP Tutorial Support Unit will not just be responsible for evaluating and assessing the quality of your work, they will also be responsible for providing recommendations to other learning providers and to client contacts within the Appleton Greene global client network, so do be in control of your own emotions and try to create a good impression.
Remember that quality is preferred to quantity
Please remember that when you send an email to the tutorial support team, you are not using Twitter or Text Messaging. Try not to forward an email every time that you have a thought. This will not prove to be productive either for you or for the tutorial support team. Take time to prepare your communications properly, as if you were writing a professional letter to a business colleague and make a list of queries that you are likely to have and then incorporate them within one email, say once every month, so that the tutorial support team can understand more about context, application and your methodology for study. Get yourself into a consistent routine with your tutorial support requests and use the tutorial support template provided with ALL of your emails. The (CLP) Tutorial Support Unit will not spoon-feed you with information. They need to be able to evaluate and assess your tutorial support requests carefully and professionally.
Be specific about your questions in order to receive specific answers
Try not to write essays by thinking as you are writing tutorial support emails. The tutorial support unit can be unclear about what in fact you are asking, or what you are looking to achieve. Be specific about asking questions that you want answers to. Number your questions. You will then receive specific answers to each and every question. This is the main purpose of tutorial support via email.
Keep a record of your tutorial support emails
It is important that you keep a record of all tutorial support emails that are forwarded to you. You can then refer to them when necessary and it avoids any unnecessary duplication, misunderstanding, or misinterpretation.
Individual training workshops or telephone support
Please be advised that Appleton Greene does not provide separate or individual tutorial support meetings, workshops, or provide telephone support for individual students. Appleton Greene is an equal opportunities learning and service provider and we are therefore understandably bound to treat all students equally. We cannot therefore broker special financial or study arrangements with individual students regardless of the circumstances. All tutorial support is provided online and this enables Appleton Greene to keep a record of all communications between students, professors and tutors on file for future reference, in accordance with our quality management procedure and your terms and conditions of enrolment. All tutorial support is provided online via email because it enables us to have time to consider support content carefully, it ensures that you receive a considered and detailed response to your queries. You can number questions that you would like to ask, which relate to things that you do not understand or where clarification may be required. You can then be sure of receiving specific answers to each individual query. You will also then have a record of these communications and of all tutorial support, which has been provided to you. This makes tutorial support administration more productive by avoiding any unnecessary duplication, misunderstanding, or misinterpretation.
Tutorial Support Email Format
You should use this tutorial support format if you need to request clarification or assistance while studying with your training program. Please note that ALL of your tutorial support request emails should use the same format. You should therefore set up a standard email template, which you can then use as and when you need to. Emails that are forwarded to Appleton Greene, which do not use the following format, may be rejected and returned to you by the (CLP) Program Administration Manager. A detailed response will then be forwarded to you via email usually within 20 business days of receipt for general support queries and 30 business days for the evaluation and assessment of project studies. This does not include weekends or public holidays. Your tutorial support request, together with the corresponding TSU reply, will then be saved and stored within your electronic TSU file at Appleton Greene for future reference.
Subject line of your email
Please insert: Appleton Greene (CLP) Tutorial Support Request: (Your Full Name) (Date), within the subject line of your email.
Main body of your email
Please insert:
1. Appleton Greene Certified Learning Provider (CLP) Tutorial Support Request
2. Your Full Name
3. Date of TS request
4. Preferred email address
5. Backup email address
6. Course manual page name or number (reference)
7. Project study page name or number (reference)
Subject of enquiry
Please insert a maximum of 50 words (please be succinct)
Briefly outline the subject matter of your inquiry, or what your questions relate to.
Question 1
Maximum of 50 words (please be succinct)
Maximum of 50 words (please be succinct)
Question 3
Maximum of 50 words (please be succinct)
Question 4
Maximum of 50 words (please be succinct)
Question 5
Maximum of 50 words (please be succinct)
Please note that a maximum of 5 questions is permitted with each individual tutorial support request email.
Procedure
* List the questions that you want to ask first, then re-arrange them in order of priority. Make sure that you reference them, where necessary, to the course manuals or project studies.
* Make sure that you are specific about your questions and number them. Try to plan the content within your emails to make sure that it is relevant.
* Make sure that your tutorial support emails are set out correctly, using the Tutorial Support Email Format provided here.
* Save a copy of your email and incorporate the date sent after the subject title. Keep your tutorial support emails within the same file and in date order for easy reference.
* Allow up to 20 business days for a response to general tutorial support emails and up to 30 business days for the evaluation and assessment of project studies, because detailed individual responses will be made in all cases and tutorial support emails are answered strictly within the order in which they are received.
* Emails can and do get lost. So if you have not received a reply within the appropriate time, forward another copy or a reminder to the tutorial support unit to be sure that it has been received but do not forward reminders unless the appropriate time has elapsed.
* When you receive a reply, save it immediately featuring the date of receipt after the subject heading for easy reference. In most cases the tutorial support unit replies to your questions individually, so you will have a record of the questions that you asked as well as the answers offered. With project studies however, separate emails are usually forwarded by the tutorial support unit, so do keep a record of your own original emails as well.
* Remember to be positive and friendly in your emails. You are dealing with real people who will respond to the same things that you respond to.
* Try not to repeat questions that have already been asked in previous emails. If this happens the tutorial support unit will probably just refer you to the appropriate answers that have already been provided within previous emails.
* If you lose your tutorial support email records you can write to Appleton Greene to receive a copy of your tutorial support file, but a separate administration charge may be levied for this service.
How To Study

Your Certified Learning Provider (CLP) and Accredited Consultant can help you to plan a task list for getting started so that you can be clear about your direction and your priorities in relation to your training program. It is also a good way to introduce yourself to the tutorial support team.
Planning your study environment
Your study conditions are of great importance and will have a direct effect on how much you enjoy your training program. Consider how much space you will have, whether it is comfortable and private and whether you are likely to be disturbed. The study tools and facilities at your disposal are also important to the success of your distance-learning experience. Your tutorial support unit can help with useful tips and guidance, regardless of your starting position. It is important to get this right before you start working on your training program.
Planning your program objectives
It is important that you have a clear list of study objectives, in order of priority, before you start working on your training program. Your tutorial support unit can offer assistance here to ensure that your study objectives have been afforded due consideration and priority.
Planning how and when to study
Distance-learners are freed from the necessity of attending regular classes, since they can study in their own way, at their own pace and for their own purposes. This approach is designed to let you study efficiently away from the traditional classroom environment. It is important however, that you plan how and when to study, so that you are making the most of your natural attributes, strengths and opportunities. Your tutorial support unit can offer assistance and useful tips to ensure that you are playing to your strengths.
Planning your study tasks
You should have a clear understanding of the study tasks that you should be undertaking and the priority associated with each task. These tasks should also be integrated with your program objectives. The distance learning guide and the guide to tutorial support for students should help you here, but if you need any clarification or assistance, please contact your tutorial support unit.
Planning your time
You will need to allocate specific times during your calendar when you intend to study if you are to have a realistic chance of completing your program on time. You are responsible for planning and managing your own study time, so it is important that you are successful with this. Your tutorial support unit can help you with this if your time plan is not working.
Keeping in touch
Consistency is the key here. If you communicate too frequently in short bursts, or too infrequently with no pattern, then your management ability with your studies will be questioned, both by you and by your tutorial support unit. It is obvious when a student is in control and when one is not and this will depend how able you are at sticking with your study plan. Inconsistency invariably leads to in-completion.
Charting your progress
Your tutorial support team can help you to chart your own study progress. Refer to your distance learning guide for further details.
Making it work
To succeed, all that you will need to do is apply yourself to undertaking your training program and interpreting it correctly. Success or failure lies in your hands and your hands alone, so be sure that you have a strategy for making it work. Your Certified Learning Provider (CLP) and Accredited Consultant can guide you through the process of program planning, development and implementation.
Reading methods
Interpretation is often unique to the individual but it can be improved and even quantified by implementing consistent interpretation methods. Interpretation can be affected by outside interference such as family members, TV, or the Internet, or simply by other thoughts which are demanding priority in our minds. One thing that can improve our productivity is using recognized reading methods. This helps us to focus and to be more structured when reading information for reasons of importance, rather than relaxation.
Speed reading
When reading through course manuals for the first time, subconsciously set your reading speed to be just fast enough that you cannot dwell on individual words or tables. With practice, you should be able to read an A4 sheet of paper in one minute. You will not achieve much in the way of a detailed understanding, but your brain will retain a useful overview. This overview will be important later on and will enable you to keep individual issues in perspective with a more generic picture because speed reading appeals to the memory part of the brain. Do not worry about what you do or do not remember at this stage.
Content reading
Once you have speed read everything, you can then start work in earnest. You now need to read a particular section of your course manual thoroughly, by making detailed notes while you read. This process is called Content Reading and it will help to consolidate your understanding and interpretation of the information that has been provided.
Making structured notes on the course manuals
When you are content reading, you should be making detailed notes, which are both structured and informative. Make these notes in a MS Word document on your computer, because you can then amend and update these as and when you deem it to be necessary. List your notes under three headings: 1. Interpretation – 2. Questions – 3. Tasks. The purpose of the 1st section is to clarify your interpretation by writing it down. The purpose of the 2nd section is to list any questions that the issue raises for you. The purpose of the 3rd section is to list any tasks that you should undertake as a result. Anyone who has graduated with a business-related degree should already be familiar with this process.
Organizing structured notes separately
You should then transfer your notes to a separate study notebook, preferably one that enables easy referencing, such as a MS Word Document, a MS Excel Spreadsheet, a MS Access Database, or a personal organizer on your cell phone. Transferring your notes allows you to have the opportunity of cross-checking and verifying them, which assists considerably with understanding and interpretation. You will also find that the better you are at doing this, the more chance you will have of ensuring that you achieve your study objectives.
Question your understanding
Do challenge your understanding. Explain things to yourself in your own words by writing things down.
Clarifying your understanding
If you are at all unsure, forward an email to your tutorial support unit and they will help to clarify your understanding.
Question your interpretation
Do challenge your interpretation. Qualify your interpretation by writing it down.
Clarifying your interpretation
If you are at all unsure, forward an email to your tutorial support unit and they will help to clarify your interpretation.
Qualification Requirements
The student will need to successfully complete the project study and all of the exercises relating to the Supercharged Performance corporate training program, achieving a pass with merit or distinction in each case, in order to qualify as an Accredited Supercharged Performance Specialist (ASPS). All monthly workshops need to be tried and tested within your company. These project studies can be completed in your own time and at your own pace and in the comfort of your own home or office. There are no formal examinations, assessment is based upon the successful completion of the project studies. They are called project studies because, unlike case studies, these projects are not theoretical, they incorporate real program processes that need to be properly researched and developed. The project studies assist us in measuring your understanding and interpretation of the training program and enable us to assess qualification merits. All of the project studies are based entirely upon the content within the training program and they enable you to integrate what you have learnt into your corporate training practice.
Supercharged Performance – Grading Contribution
Project Study – Grading Contribution
Customer Service – 10%
E-business – 05%
Finance – 10%
Globalization – 10%
Human Resources – 10%
Information Technology – 10%
Legal – 05%
Management – 10%
Marketing – 10%
Production – 10%
Education – 05%
Logistics – 05%
TOTAL GRADING – 100%
Qualification grades
A mark of 90% = Pass with Distinction.
A mark of 75% = Pass with Merit.
A mark of less than 75% = Fail.
If you fail to achieve a mark of 75% with a project study, you will receive detailed feedback from the Certified Learning Provider (CLP) and/or Accredited Consultant, together with a list of tasks which you will need to complete, in order to ensure that your project study meets with the minimum quality standard that is required by Appleton Greene. You can then re-submit your project study for further evaluation and assessment. Indeed you can re-submit as many drafts of your project studies as you need to, until such a time as they eventually meet with the required standard by Appleton Greene, so you need not worry about this, it is all part of the learning process.
When marking project studies, Appleton Greene is looking for sufficient evidence of the following:
Pass with merit
A satisfactory level of program understanding
A satisfactory level of program interpretation
A satisfactory level of project study content presentation
A satisfactory level of Unique Program Proposition (UPP) quality
A satisfactory level of the practical integration of academic theory
Pass with distinction
An exceptional level of program understanding
An exceptional level of program interpretation
An exceptional level of project study content presentation
An exceptional level of Unique Program Proposition (UPP) quality
An exceptional level of the practical integration of academic theory
Preliminary Analysis

You have three tasks to complete prior to the first workshop:
1. Complete your individual Harrison Assessment using the link you were sent.
2. Devise a data collection plan and implement it so you have data for each part of your organisation against each of the 8 element and the 7 areas of performance in the table. Some of this data will be at your figure tips, it is central to how the organisation currently runs and there are data systems already set up to produce accurate and timely reports. For some of these, you will have data that you will think will do – and at this stage it probably will. And then there is the data when you are really going to have to dig deep to interpret the task, or where no data exists at present.

Our instructions are deliberately vague. And we know that makes them frustrating. But we don’t know each other very well yet, and we want to see what you can do, how your brains work, and what you can surprise us with. For this first workshop there are no wrong answers unless you come with nothing. But we are expecting you to collectively have a considerable amount of time to use for this data collection task, and if you work together well as a team, are dynamic and imaginative then this is a task which you should be able to carry out with some style.
Once you have completed the data collection, work together to identify who will be analysing which sections of the data, and make sure it is pulled together into a succinct presentation to deliver to us in the first workshop.
Think about who you will need to get approval for at each stage of the task. There may be some financial data which you do not have normal clearance to access, and you may need permission to carry out any specific data collection exercises which are being completed purely for this task. In order to be ready for the first workshop, you will need to be dynamic in producing your data collection plan and getting permission to implement it. This will maximise the time available for devising any ad hoc data collection activities and getting specific permission to implement them. Think very carefully about who is doing what, and what needs to be completed by when. Use SMART Targets in your plan.
We would recommend starting with a mind map of the different departments of the business and exploring which of the seven areas of performance are relevant to that department, and what naturally occurring data there is available. Once the organisation mind map is completed, it can be annotated to show which of the 8 elements have been covered via naturally occurring data.
The next stage is to identify which areas of performance, elements, and organisational departments so not have a full set of naturally occurring data. The project team need to develop a plan for the speedy capture of the necessary data so that it is all available for the first workshop.
We do not have the expectation that every department will have high quality naturally occurring data for every element and area of performance, and project teams will struggle with some areas more than others. Part of the task will be in identifying what data can be used as a proxy, and some of the subjects are more open to interpretation than others. It is up to the project team to discuss and agree what that interpretation should be.
As part of the management of the pre-workshop preparation stage, the project team will need to identify who will be capturing what data, by when, and how it will be interpreted and presented. To that end, project teams will need to consider how they will be communicating with the wider staff team about this task in order to generate co-operation and assistance.
Finally working together, prepare a 10 minute PowerPoint presentation for delivery in the first workshop of your key findings.
NEED BETTER QUALITY PHOTO FOR PRELIM IMAGE
Why use SMART targets?
SMART stands for Specific, Measurable, Achievable, Realistic, and Timebound. It is a best practice acronym to help write plans where it is easy to measure achievement.
There are several advantages to using this target setting methodology:
• It makes it clear what you are trying to achieve
• You will be able to see when the target has been achieved
• It enables sense checking during the planning process – asking if a target is achievable and realistic has to be related to context and resources.
• If you cannot measure your progress against a target, it is hard to hold yourself and other accountable
This is your first group task, and success depends on each of you knowing who is doing what, when it needs to be done by, and making sure that this plan is reviewed regularly so nothing surprises you in the first workshop. These are really important skills which you will be using throughout this training programme.
We would recommend starting with a mind map of the different departments of the business and exploring which of the seven areas of performance are relevant to that department, and what naturally occurring data there is available. Once the organisation mind map is completed, it can be annotated to show which of the 8 elements have been covered via naturally occurring data.
The next stage is to identify which areas of performance, elements, and organisational departments so not have a full set of naturally occurring data. The project team need to develop a plan for the speedy capture of the necessary data so that it is all available for the first workshop.
We do not have the expectation that every department will have high quality naturally occurring data for every element and area of performance, and project teams will struggle with some areas more than others. Part of the task will be in identifying what data can be used as a proxy, and some of the subjects are more open to interpretation than others. It is up to the project team to discuss and agree what that interpretation should be.
As part of the management of the pre-workshop preparation stage, the project team will need to identify who will be capturing what data, by when, and how it will be interpreted and presented. To that end, project teams will need to consider how they will be communicating with the wider staff team about this task in order to generate co-operation and assistance.
3. In your project team, prepare a 10 minute PowerPoint presentation for delivery in the first workshop of your key findings.
Course Manuals 1-12

Course Manual 1: SWOT Analysis
NEED BETTER QUALITY IMAGE FOR 1ST COURSE MANUAL IMAGE
By looking at the strengths, weaknesses, opportunities and threats an organisation faces at a point in time, you can analyse what your company does best now, and use this to devise a successful strategy for the future. This tool can also uncover those areas of the business that might prevent growth, or where your competitors can gain ground against you if you don’t take action. Often completed in partnership with the more external facing PESTLE analysis (See manual 2) SWOT is mainly internally focused, but not totally as something you consider to be a major strength maybe an area of business where others are already operating at a higher level. So, you are looking both internally and externally at the same time.
Working in detail, and collaboratively is important, as well as making sure you cover all aspects of the business. Some factors you can control, and others will be just the way it is within your context. This tool can help you to challenge your own assumptions both as an executive team and as a business, which is why it should be part of any exercise involving deciding where you stand as a business at any point in time. The data is not enough on its own, and SWOT is a key wider analysis tool which helps you make sense of the data. At the same time, the data should also inform this work. Something you have said is a business strength for years my have been in slow decline and at some point, will need to be moved out of that column. This careful consideration of facts and opinion can deliver new insights on current business performance and help you to begin formulating a new strategy.

Strengths also need to be real, as opposed to something you do very well but actually no better than your customers, the industry or your stakeholders require. So for financial advisors, it is a given that they will deliver high quality personalised advice and support. To say it is a strength you would need to be able to define how your high-quality personalised advice and support goes above and beyond what others in the sector are doing.
This then is a great self-assessment tool for management teams, and there are benefits at every level of detail in the analysis. Even by just brainstorming a quick list very quickly can work to get everyone on the same page and begin the conversation. This can then lead to a much more detailed analysis to back up these off the cuff declarations. This flexibility of approach is one of the key reasons why SWOT is such an evergreen business analysis tool.
The layout is a simple four boxes, and flipchart is a great way to gather thoughts together for the initial stage.
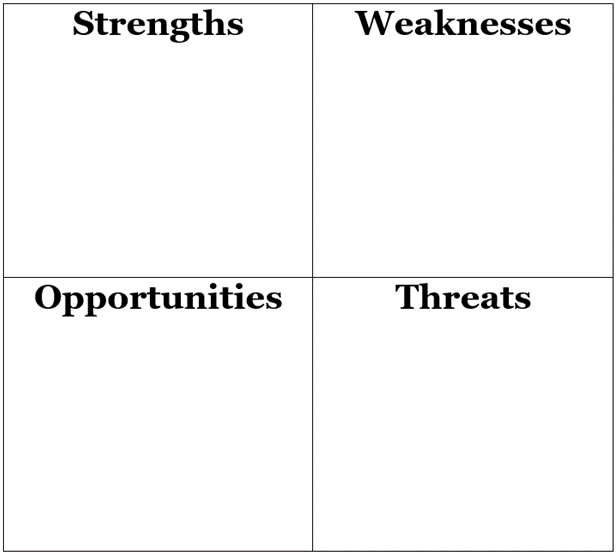
So, what should be thinking of as complete a SWOT Analysis?
Strengths: What do you as a business leadership team think you are particularly good at? What sets you apart from the competition? These tend to be internal to the business and in your control. You also need to look to the competition. Does this strength stack up compared to others? If it doesn’t then you need to be hard on yourself when you question if it is not a strength, but a given.
Weaknesses: Areas of the business you are not satisfied with. Again this is internal to the business and within your sphere of control, however you will need to look at how your performance compares with others in your industry. It is possible for something to not be good enough for you but also better than the competition. It is still a weakness to be addressed, but potentially not as serious a weakness as it could be.
Your strengths and weaknesses are the extremes of your business. Remember that in between them will be the vast majority of your business – Doing well but not exciting enough to make it into this part of the analysis.
Opportunities: These are mainly external factors which if handled correctly could lead to either expansion or new business directions. Opportunities can also come from internal developments. Timescale is important to consider in this part of the analysis as is the risk involved as this can help you begin to evaluate if this is a good idea to be pursued or something for another time.
Threats: These again are primarily external and outside of your control but can also be internally sourced and linked to your weaknesses. Each threat should be risk assessed for severity and probability of occurrence and here you are considering which ones would benefit from contingency planning.
Questions to ask when completing your SWOT:
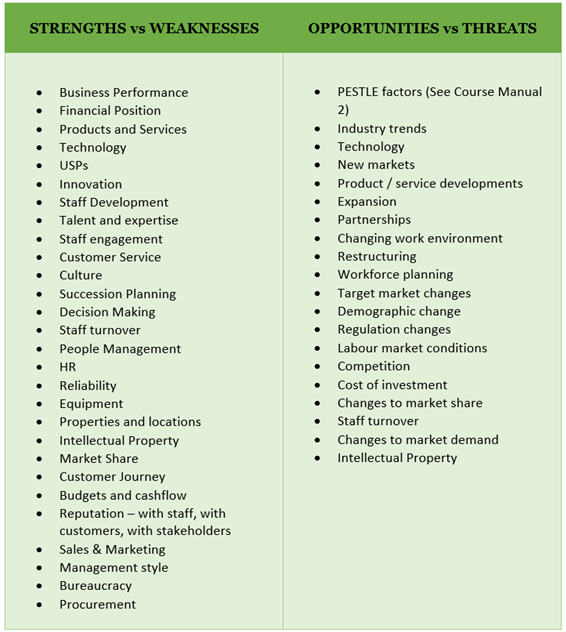
As we can see from the table above, there is a lot to think about to do a SWOT analysis well. Do not be afraid of moving one of these suggestions to a different box. You may have recently formalised some game changing intellectual property so that it is both an opportunity to take advantage of as you implement it, and also a strength that you have this and the competition don’t. Lower staff turnover than the industry norm could be seen as a strength, or very high staff turnover a weakness. On the other hand if the staff turnover is among people who have been a block to change for sometime then this while unfortunate and very sad, is an opportunity to do things differently form now on. A SWOT analysis is a professional strategic look at the company, but it should not pull any punches or be overly focused on being politically current. This is an internal document, and at this stage you do not need to overly focus on picking the most appropriate language for diplomacy as this can often lead to statements being toned down. This then can create problems at a later stage when it is hard to justify why you have made a particular judgement due to overly gentle language.
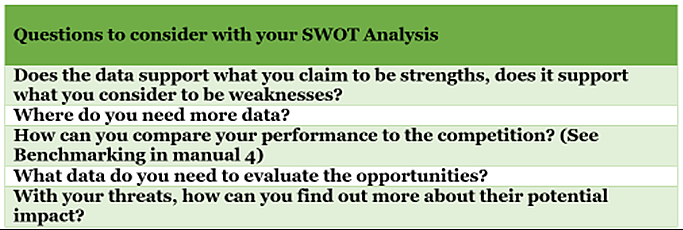
So SWOT analysis is a great starting point for the transformation project you have committed to undertaking as it helps place the business in context, and gives us something to compare our initial data analysis with. The next stage is to use this data to sense check the SWOT.

Course Exercise 1 – SWOT Analysis
In your group, complete a basic SWOT analysis for your organisation and be prepared to feed your findings back to the whole group.

Course Manual 2: PESTLE Analysis
PESTLE analysis is mainly focused on understanding the current external situation of an organisation. No business operates in isolation, and business success is intrinsically linked to how it interacts with the wider economic, political, legal, environmental, technological, and social worlds. So for example, new building regulations requiring thicker insulation on new buildings impact both cost and design for a building company. These new regulations will need to be implemented in the business requiring changes to staff training, quality assurance and operations. When conducting the PESTLE we want to look at the current situation, but also to be considering what is coming down the track. This future focused timeline will be context specific, organisations with long lead times will need to look further out than those able to be much nimbler. Of course, in terms of legislation changes while they are often announced months or even years in advance last-minute bargaining can alter the impact significantly. The political and election cycle can also mean that some legislation or regulatory changes never get implemented doe to change in Government. And you are also in control of deciding as a business how you plan to respond to potentially damaging regulatory change – by focusing on mitigation and implementation or spending resources and energy lobbying for changes.
This type of analysis then helps to pick up broader long-term trends, and support:
Strategic direction: By pushing executive teams to consider business context, PESTLE helps inform potential business direction, brand positioning, the impact of emerging risks, future growth targets, and consideration of the validity of the existing product / service offering
Workforce planning: From that strategic work, we can begin to analyse the impact this will have on the internal workings of the business. A key consideration is how these changes will impact the need for staff in the future. This will include the volume as well as skill set. And it may be that the location of jobs will change to take advantage of new opportunities or in response to mitigating regulatory risks in a particular location.
Marketing planning: The evaluation of the wider business environment sets the tone not only for deciding what the marketing priorities are, but also for considering the best way to pitch that marketing spend. In the current post Covid world of high inflation many are suffering from the impact of rising energy costs. This constriction on both household and business budgets is changing purchasing decisions. But the impact is not universal – those businesses focusing on consumers in lower socio-economic groups are seeing sales impacted more than those who target more affluent customers. All the signs are that this constriction in disposable incomes will be with us for a period of time. This therefore will impact both business strategy and marketing decisions for those businesses impacted the most.
Product development: External factors impact internal decisions about whether a product or service is worth offering in the future. Opportunities created by legislation may lead to a new direction for the business, as well as showing it is time to pull something from the market as it is no longer likely to generate sufficient sales or be fit for purpose.
In the same way as a SWOT analysis is a simple set of boxes on a page, flipchart is again a great way to begin brainstorming your PESTLE.
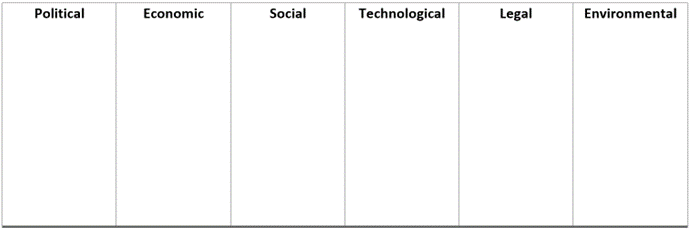
What you will notice from this table is that many of these headings are interlinked. This is not really a surprise. While your SWOT Analysis from Manual 1 was heavily focused on what the data was telling you to counter your gut instinct, the PESTLE tends to be more intuitive and experience led, backed up by more general research – for example into upcoming legislation.
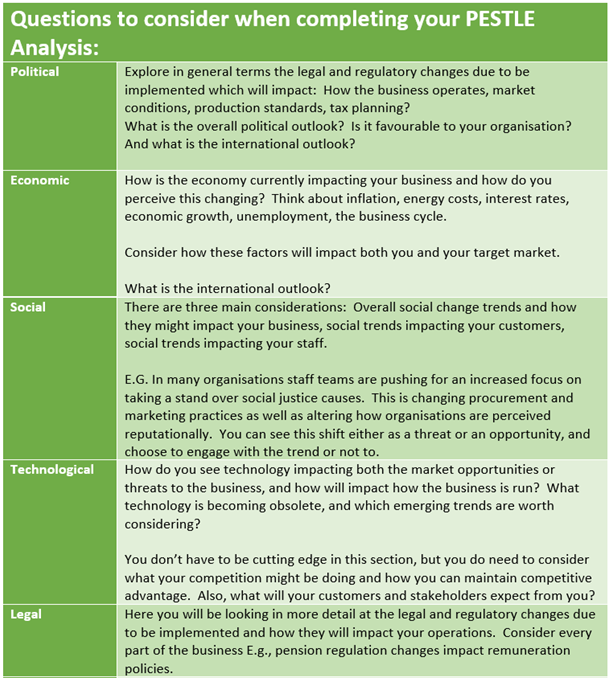
Once you have completed the PESTLE analysis, you should be able to review it against your SWOT analysis. The consideration of broader external factors ought to have highlighted information to add to the SWOT, and in turn this should have identified data collection needs to support future decision making. The exercise will have hopefully helped you to spot wider trends and future proof your business model.
Course Exercise 2 – PESTLE Analysis
In your group you will be allocated one section for the organisations PESTLE Analysis. Complete your analysis for this area and be prepared to feed your findings back to the whole group.
It will be expected that after the workshop you will work together to collate your findings to create a whole analysis.

Course Manual 3: Presenting initial data findings
How you present your initial findings to your stakeholders is key to the ongoing success of a project. You are going to use those findings to confirm the scope of you project and validate the initial assumptions you have made.
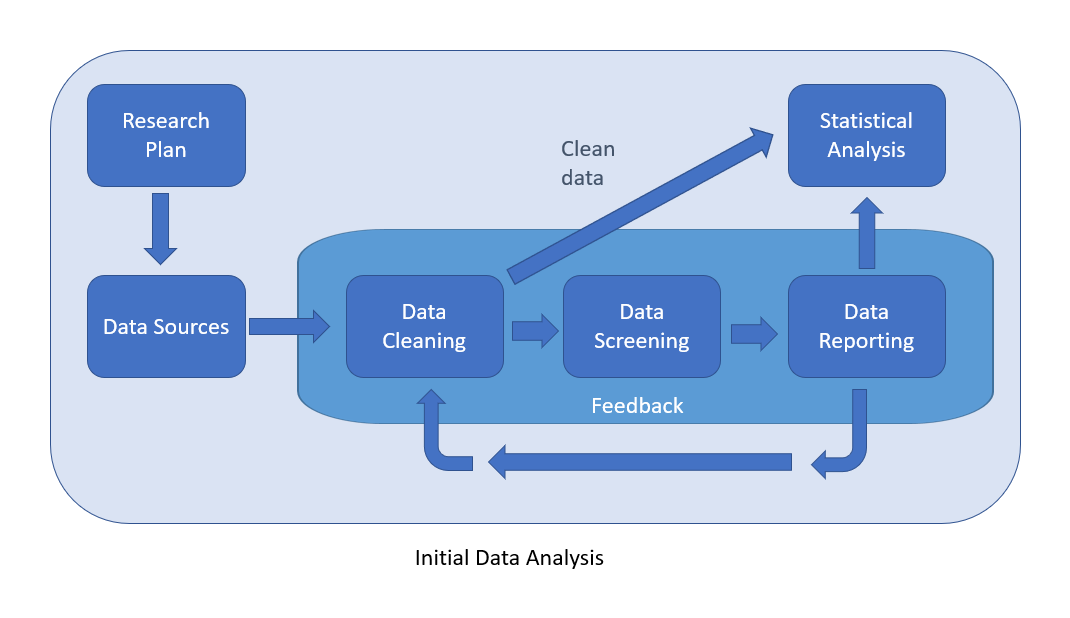
Was your initial hypothesis correct? Was there a lot of a particular activity taking place; was the anecdotal evidence that was the basis for the hypothesis borne out by your initial research.
There are a lot of things to think about in your initial findings and how you reach them. Observer bias is one of those. Observer bias is introduced when the act of studying something affects the thing being studied. Parta’s Dictionary of Epidemiology gives the following definition: “Systematic difference between a true value and the value actually observed due to observer variation” and continues to describe observer variation.
Many healthcare observations are open to systematic variation. For example, in the assessment of medical images, one observer might record an abnormality, but another might not. Different observers might tend to round up or round down a measurement scale. Colour change tests can be interpreted differently by different observers. Where subjective judgement is part of the observation, there is great potential for variability between observers, and some of these differences might be systematic and lead to bias. Observation of objective data, such as death, is at much lower risk of observer bias.
Biases in recording objective data may result from inadequate training in the use of measurement devices or data sources or unchecked bad habits. By recording subjective data, predispositions of the observer are likely to underpin observer biases. Observers might be somewhat conscious of their own biases about a study or may be unaware of factors influencing their decisions when recording study information.
Randomized controlled trials are designed to provide the fairest test of an intervention. However, if any part of the data collection process involves observation, observer bias can affect the measurement in the study.
A key method is to ensure that outcome assessors are blinded to the exposure status of study participants. This can apply to randomised controlled trials, in which an individual has been allocated a particular intervention, and also to observational studies, which track the progress of study participants with different exposures. Achieving blinding might mean separating access for data on exposures from data on outcomes; in a blinded trial the allocation should remain unknown throughout the study (unless it must be revealed for safety reasons).
Strategies can also include adequate training for observers in how to record findings, identifying any potential conflicts before recordings commence and clearly defining the methods, tools and time frames for collecting data.
Another preventive aspect includes training study observers to become aware of their prejudices and habits, in order to improve accuracy. One study on blood pressure looked at training procedures designed to reduce observer bias and how long they lasted. The study showed nurses had biases in either under or over reporting blood pressure; training did reduce the between-nurse variation but differences remained and were not changed by training at various time points.
Whilst observer bias can be reduced, it is likely that observer bias will always remain, and researchers should be aware of this when analysing and evaluating data.
Confirmation bias – Occurs when the person performing the data analysis wants to prove a predetermined assumption or hypothesis. They then keep looking in the data until this assumption can be proven. e.g. by intentionally excluding particular variables from the analysis. This often occurs when data analysts are briefed in advance to support a particular conclusion. It is therefore advisable to not doggedly set out to prove a predefined conclusion, but rather to test presumed hypotheses in a targeted way. Again, this highlights how important it is to correctly define the initial hypothesis.
Selection bias – This occurs when data is selected subjectively. As a result, the sample used is not a good reflection of the population. This error is often made in surveys. Frequently, there is also selection bias in customer panels: The customers that you (easily) find willing to participate in a customer panel are far from being “average customers”. This too can be done deliberately or unwittingly. Just look at opinion polls in elections: Can it really be true that so many voters completely change their mind on the last day, or is it more likely that the sample on which the poll is based is not a good reflection of all the voters?
Outliers – An outlier is an extreme data value. E.g. a customer with an age of 110 years. Or a consumer with €10 million in their savings account. You can spot outliers by inspecting the data closely, and particularly at the distribution of values. Values that are much higher, or much lower, than the region of almost all the other values. Outliers can make it a dangerous business to base a decision on the “average”. Just think: a customer with extreme spending habits can have a huge effect on the average profit per customer. If someone presents you with average values, you should check whether they have been corrected for outliers. For example, by basing the conclusions on the median – the middle value.
Overfitting and underfitting
Underfitting means when a model gives an oversimplistic picture of reality. Overfitting is the opposite: i.e. when the model is overcomplicated. Overfitting risks causing a certain assumption to be treated as the truth whereas in practice it is actually not the case. Always ask the data analyst what he or she has done to validate the model. If the analyst looks at you with a rather glazed expression, there is a good chance that the outcomes of the analysis have not been validated and therefore might not apply to the whole database of customers. Always ask the data analyst whether they have done a training or test sample. If the answer is no, it is highly likely that the outcomes of the analysis will not be applicable for all customers.
Confounding variables
If the research results show that when more ice creams are sold more people drown, ask whether they have checked for what are known as confounding variables. In this case, the confounding variable will be the temperature. If the weather is hotter, people will eat more ice cream and more people will go swimming. This is likely to result in more drownings than on a cold day.
A confounding variable is therefore a variable that is outside the scope of the existing analytical model but that does influence both the explanatory variable (in this case, ice cream sales) and the dependent variable (the number of drownings). Failing to allow for confounding variables can result in assuming there is a cause-effect relationship between two variables when there is in fact another variable behind the phenomenon. Bear in mind that a correlation is not the same thing as cause-effect. If a relationship between attributes is identified, this can be very helpful when you want to select the right customers for a particular campaign. But to prove that one leads to the other, it is advisable to test it in controlled A/B tests.
You need to think about how you will collect and summarise the information.
Think about how you are going to express the information you collect. Process mapping tools like Microsoft Visio are an excellent way of drawing out the flow of information around a department but the actual process of sitting with people drawing out that information may require a more tactile collection technology, post-it’s on white board or a long roll of paper to draw on.
Graphs and dashboards for everyday information are great for managers. They hold the most important information required to navigate a business. The consumers of that information need to have confidence in the information though, they have to be sure that the information is correct and calibrated for the business environment. For a dashboard to be effective it also needs to be displaying the correct level of information not too little and not to much.
How you present the information is really important. If you want your audience to respond to information with an action you need to pick a transmission method that will make it easy for them to see the information and take the correct response. As a slightly extreme Vietnam era jet fighters had a lot of warning buzzers going of in the cockpit when something went wrong … someone has fired a missile at me that sort of thing. The engineers found that the warning buzzers were actually distracting the pilots from doing the things that kept them safe. So the pilots would disable the warning buzzers. They were suffering from information overload and couldn’t pick up what was important over the noise. Later generations of fighter now only use female voices for the warnings –“pull up you are about to hit the ground” that sort of thing. The pilots responded better to the slightly calmer voice and were able to focus on the action of no crashing or getting shot down.
So, whilst we may collect a lot of data, we need to think about what the most effective way to communicate the most valuable parts of the information is. Shapes, symbols colours are often more effective than works. We all understand that a red traffic light is stop a green one is go and a yellow one maybe or caution.
As with the plane designers and their fighter pilots. You need to communicate in a language they will understand. There is limited point showing a complex scatter graph to a group of shop floor workers that don’t have a good grasp of statistics. Showing it to a group of epidemiologists though could well be fine.
Course Exercise 3 – Presenting initial data findings
Following the project groups 10 minute presentation of the initial data findings to the workshop, you will be split into smaller groups to answer these questions:
• What is missing completely?
• What data quality issues can you see?
• What data looks excellent?
• Does it answer the questions you needed to answer?
• What are the barriers to improving the quality of the data?

Course Manual 4: Benchmarking
Benchmarking can help to drive performance. It is easy as a business leader to be pleased with your current level of performance, especially when that performance has been hard to come by. But without comparing this to what other departments are managing or to competitors it is hard to gain a good grasp of the enormity of the achievement. 100% sales growth for a new line in 12 months may be amazing for you, and better than you have ever managed before. But if your competitors have managed 200% from roughly the same starting point in the same period our achievement is looking less stellar. We use benchmarking as a starting point for identifying areas of the business where further investigation is required – an understanding of why we are where we are. From there is becomes easier to do something about it. 100% sales growth implies satisfaction with a job well done, especially if the target was 75% growth. This might lead to light touch supervision and a desire to let things be. Everything is clearly going in the right direction so let’s focus our attention elsewhere. But once we know the competition managed twice our level of performance this does not seem like quite the same job well done. As business leaders we will naturally want to explore what the competition did that we didn’t, and we can use these investigations to drive performance.
So in summary, benchmarking is a data focused method to discover the best performance being achieved and where – a specific department, another company, or a different industry or in a different country. This information can then be used to help identify where things are going wrong, as a tool to inform investigations, and to provide the inspiration and motivation to drive change. To use benchmarking most effectively it should be part of a more formal regular process of self-evaluation and reflection, allowing for the tracking of comparative performance over time. This can help leadership teams maintain focus but also perspective.
External regulation or inspection regimes often force benchmarking practice into organisations. Within the UK education sector, benchmarking is common practice both by funding bodies such as the Department for Education, and also by OFSTED the independent inspection body. This external benchmarking takes two forms – requiring schools, colleges, or training providers to hit certain levels of performance to be allowed to continue to operate, and a more comparative league table measure to encourage aspiration. The self-assessment reporting methodology further re-enforces this by having the expectation that providers will assess all their internal data against externally reported benchmarks when making performance decisions, and to use this data as a basis for driving more strategic quality development initiatives.
This can be described as three different types of benchmarking: internal, competitive and strategic.
Internal benchmarking: Often used to compare the same performance metric across departments or locations. An example of this might be staff turnover. The customer service team may have much higher turnover than the finance team. Or the sales team in London may have lower turnover than the one in Amsterdam. As we can see, the data shows us where to ask the questions to understand why this might be.
Competitive benchmarking: Used to compare your business performance with those in the same sector as you or the same geography. So looking at our previous staff turnover example we can see what the industry turnover norms are in different countries. This may show us that while London has low staff turnover compared to other locations in our organisation, it is higher than comparable companies in the same city. So rather than feeling smug, we should now look at how we can lower this turnover further. Many businesses struggle to retain customer service call centre workers and some sales teams are highly unstable. So our rates in these departments may be impacting our average turnover, but we may be doing better than our competitors in these naturally high turnover areas of the business. Therefore we may decide no further action is required at this time.
Strategic benchmarking: Used to compare performance against world-class organisations. This type of benchmarking is the most demanding as you are putting yourselves against the best of the best, but if you are aiming for excellent in every part of your operation then this high-level work is a key to success. You will be scouring the world for the businesses that are the best at every metric you have and studying them closely to try and learn what they are doing so well that you can apply to your own context.
Things to consider:
• Key Performance Indicator data is a good baseline for internal benchmarking. This data should be already aligned to your strategic performance priorities, however if each department has very different performance measures you will want to consider more universal KPIs to aid comparative studies.
• Identify timely and accurate published data sets which you can use for comparing your performance against industry norms. This may require altering how you are gathering and reporting your internal data so you can do a like for like calculation. Also, try to find data sets which are published year after year. There is nothing so frustrating as to find amazing data one year that never gets produced again.
• Identify those organisations you consider to be world-class. And what you consider them world-class for. It is very rare to find a business which is superb at everything. Your job is to compare your performance against their strengths not their weaknesses.
• If you don’t yet use KPIs in your organisation, start by thinking what the key drivers of performance are. So in a call centre, key measures will be time to answer the phone, length of time on hold, time taken for the call. The data will tell us what is going on, but of course it is executives knowledge which will interpret the data to find meaning. So, the time taken per call going up may not be a sign of reduced call centre performance but may be related to a new product launch which generates calls which take longer to resolve. This performance data gives us a starting point for a conversation to understand what is happening – allowing quicker problem solving. Benchmarking is part of an early warning system.
Course Exercise 4 – Benchmarking
In your group you will be allocated one of these business areas to explore:
• People / Staff satisfaction
• Product
• Quality
• Culture
• Customer Satisfaction
• Financial Performance
• KPI performance
Your task is to apply your knowledge of benchmarking to explore and research relevant internal and external benchmarks for your allocated area of the business

Course Manual 5: Quantitative Management
The exponential expansion of data systems in business makes the application of Quantitative Management theory valid to all business contexts, but data is not a panacea and cannot be used to answer all management or leadership questions. The quantitative approach to management involves the use of quantitative techniques, such as statistics, information models, and computer simulations, to improve decision making. This school consists of several branches, described in the following sections.
Scientific management schools emerged to teach solutions to the problems associated with the logistics of global warfare. Managers are today encouraged to use mathematics, statistics, and other quantitative techniques to make the best management decisions. There are many reasons holding organisations back from becoming fully data driven key among those is a lack of commitment from key decision makers. A 2016 executive survey from McKinsey, counted this as the biggest contributing factor to analytics success or failure. That’s not the only barrier. Many organisations do not have a data strategy which is effectively aligned with their adopted business goals. It’s wrong, both legally given GDPR rules and from an economic perspective, to collect data for the sake of it – much as it might be tempting for some managers to do so on a “it might be useful one day” basis. Data collected needs to be aligned to business objectives, a lack of alignment can led to poor purchasing decisions where the choices over what to invest in get politicised or turn into vanity projects.
Accenture found that only 33% of firms reported they trusted “their data enough to use it effectively and derive value from it.” That means 67% of organisation didn’t trust their data to make useful decisions. This comes back to organisation culture and the fact that data led decisions can only be as good as the data they are based on. Clean data and quality data entry are both design and quality assurance issues.
Businesses can design systems which are robust and able to work properly even during times of stress. But having a culture that aims to get things right first time is the only way to achieve an acceptable level of performance. Reaching that level requires a lot of effort, the leadership team needs to be committed to achieving that as a goal to be able to succeed.
A further impedance to the drive for data led decision making can occur when the workforce lacks the skills and confidence to work with data. A recent Qlik/Accenture survey revealed only 21% of workers were fully confident in their data literacy skills. They explained this can be as basic as “the ability to read, understand, question and work with data”. Can you imagine the reaction if the 21% statistic were about numeracy skills rather than data? As staff have more data at their disposal the required skills level rises. If they do not have the skills to process the data effectively it losses it’s value to inform decision making. In the same survey 74% of respondents expressed feeling overwhelmed or unhappy when working with data.
This is not just an issue affecting junior staff, Deloitte found 67% of managers and executives reported they were not comfortable accessing or using data from their analytics tools. Those are the tools those executives probably played a part in selecting and implementing. Training in data analytics and the use of analytics tools is vital if staff are to get the most from the resources at their disposal, there is no sense investing in expensive tools if you don’t teach people how to use them. Buying data analytics tools is no different to buying a new piece of capital equipment for the production line. Consideration needs to be given to how to integrate that tool into the working environment so that it can be effectively and safely utilised.
It is not all depressing though, a 2015 McKinsey study found that companies who invest in rigorous change management approaches reported a 79% success rate—three times the average for all other initiatives and demonstrating the importance of the kind of transformation process you are exploring here.
Today computer models can be used to work out the best way to achieve a goal — saving organisations both money and time. Managers have a range of tools that they can deploy including;
• Mathematical forecasting – forecasts that make projections for use in the planning process.
• Inventory modelling – this enables Just In Time systems that optimise the levels of inventory help.
• Queuing theory that helps allocate staff and supporting resources to minimize customer wait times and service costs.
Operations management is a form of quantitative methodology used for management. Its focus is the management of the processes of transforming materials, people, and capital into goods or services something which is a concern both manufacturing and service organizations. The transformation process is the operations or activities used to produce finished goods or services of value to customers or clients from the initial set of resources.
Modern Operations management pays close attention to the demands of quality, customer service, and competition. The process begins with attention to the needs of customers: What do they want? Where do they want it? When do they want it? Based on the answers to these questions, managers line up resources and take any action necessary to meet customer expectations.
Management information systems (MIS) is a recent development in the quantitative school of thinking. A management information system organizes data from the past, present and future from multiple sources and transform it into usable information. This information can then be used by managers with an organisation to information their decision making process. These information systems are able to rapidly and repeatedly organize data into usable and accessible formats.
The quantitative approach in decision making is all about leveraging the scientific approach to identifying the root cause of the problem and making well-informed data-backed, and well-defined decisions. This analysis encompasses factors such as revenue, price-to-earnings ratio, and liabilities and each of these factors are measurable.
The key techniques that are globally leveraged are:
Mathematical Programming revolves around using mathematical models to explain the problem area and determine the best solutions amongst the alternatives available. Monte Carlo Simulations can also be introduced in this area. A Monte Carlo simulation is a model used to predict the probability of different outcomes when the intervention of random variables is present. Monte Carlo simulations help to explain the impact of risk and uncertainty in prediction and forecasting models.
Cost-Benefit Analysis measures the social and financial benefits of a course of action whilst allowing for the costs associated with implementing the decision. The cost is measured in terms of tangible financial benefit but also of any future benefit.
Linear Programming focuses on optimizing resources using a linear equation. This can be applied in the scenario where there is a linear connection between the two factors involved.
Expected Value concerns itself with evaluating outcomes of certain actions based on the concept of probability and possibility. The approach comes into play when a decision-maker is faced with multiple choices of action and all of which have an uncertain outcome.
Decision Trees revolve around creating a concept map of actions, processes and possible outcomes. This is applied in a case where there is a potential for sequential decisions. The decision tree approach identifies all the possible actions and outcomes thereby presenting a range of options.
Simulation involves studying real-time action and its impact. Mostly applicable to ‘what if’ problems, simulations are cost-effective ways of experimentation and testing.
Information Theory; ‘Information’ and its quality is the most important part consideration in any decision. This Information Theory offers a mathematical foundation for understanding the flow of information and communication within networks. This theory helps to measure the efficacy of information available within the network and the content needed for effective communication.
To summarise; Quantitative methods or tools offer the following advantages:
• Quantitative methods turn data into information with the analysis conducted in real-time. That data can be collected very easily through surveys and interviews.
• Quantitative research uses random samples so its relatively unlikely that bias will creep in and corrupt the dilute the decision-making process.
Course Exercise 5 – Quantitative Management
In your small group you will be allocated a specific area of the business to apply Quantitative Management Theory to. The areas of the business are:
– Senior Leadership
– Middle Management
– Finance
– Sales
– Operations
– Customer Service
– HR
– IT
Answer these questions:
• What proportion of decisions are made using data?
• What are the barriers to adopting full quantitative management?
• Which of the 8 Elements do these barriers relate to?

Course Manual 6: Human Relations Theory
The research behind Human Relations Theory shows that staff satisfaction is related to the attention shown to people by management over the content of any specific change and can be an excellent starting point to understanding why team satisfaction levels are perhaps not what executives would like. The theory focuses management practice and understanding through the lens of the individual staffs needs and resultant behaviours of individuals and groups created by management inputs. This is an interpersonal approach to managing human beings, and considers organisations as made up of both formal and informal elements, with six basic propositions at its heart:
• People are more important than machines or economics
• The organizational environment is not an organized social context
• Individuals’ motivation is impacted by their relationships within the workplace
• Teamwork impacts motivation, and this requires the co-ordination and cooperation of individuals
• The relationships within a team must fulfil both individual and organizational objectives at the same time if they are to be effective
• Maximum results with minimum input generates desired levels of efficiency for both individuals and organizations
The Hawthorne studies were led by Professor Elton Mayo between 1924 – 1932, and were designed to evaluate the attitudes and psychological reactions of workers in on-the-job situations. Initially exploring the impact of illumination levels on worker productivity, the usefulness of the data generated by the study led it to be expanded to cover a broader range of workplace conditions.
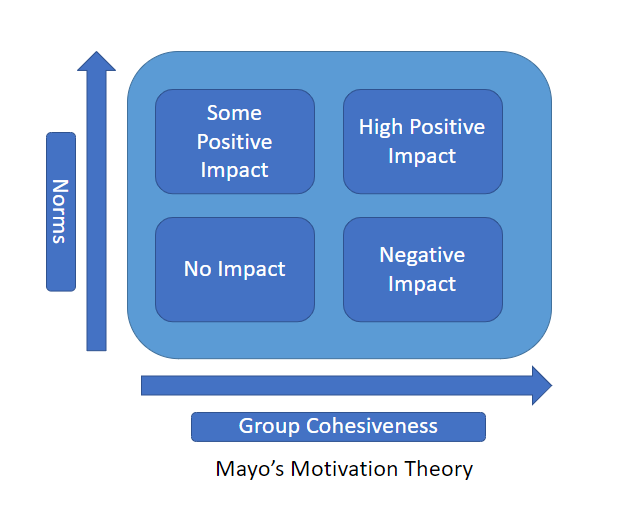
Across the experiments a key common theme was identified as important in group performance – the attention given to staff from management. These findings became known as the Hawthorne Effect – individuals perform better when given special attention. Wider findings from the study were:
• Job performance and output are significantly impacted by group dynamics.
• Groups have their own norms and beliefs, independent of the norms and beliefs of their individual members.
• The perceived meaning and importance of a person’s work is the primary determinant of output rather than pay.
• Employees do not respond best to command and control but prefer a cooperative attitude from superiors.
• Communication between management and staff is essential to understanding employee issues.
• Actual workplace culture sets production standards – despite any standards and culture set by managers.
In 1924, two groups of workers were isolated so they could experiment how productivity was impacted by the impact of various incentives. It started with experimenting with lighting levels – standard levels, improved lighting, and below standard lighting for both groups. All the changes improved productivity, leading to the initial assumption that increased output stemmed from the variations alone.
Wider incentives such as payment incentives and rest pauses were also changed regularly. This caused variation in output levels, but with a noticeable overall upward trend. So much so that whatever the experimentation was, output was seen to increase.
By 1927, it was observed that longer rest pauses created more social interaction, and this could be seen to improve the workers mental attitudes. Exploring the reasons for the rise in output led to the conclusion that there were several circumstances specific to the experiment environment which were driving productivity as opposed to the specific experiments being conducted: the small groups, how staff were being supervised, earnings, the novelty of the experiments, and the increased attention the staff received from the people running the trials.
It was observed that the supervisor who ran the team involved with the illumination experiment had been relaxed and friendly. This supervisor made the time to get to know the operators well and was not hugely strict about formally enforcing company policies and procedures. The esprit de corps which grew within the group helped to maintain discipline, and was in stark contrast to standard practice in the organisation before the experiments began.
By 1930, six years after the experiments began, observers noticed ‘a remarkable change of attitude in the group’. By this point the workers who were participating in the test had turned into a social unit, and were enjoying all the attention they were getting, giving them a real sense of participation in the project. Interviews of participants gave the opportunity for them to talk things though and give their views. It emerged that this would make them feel better, even if the situation which had upset them did not change. Exploring worker complaints showed that in some cases it was external factors upsetting workers which they then projected onto work situations. This more open, conversational, listening and caring interview approach form Mayo found a link between supervision style and morale with levels of productivity.
This was ground-breaking work, and is still a central tenet of much modern people management theory and practice. However, as managers practice has become less clear cut. When they are managing subordinates, managers can be seen to prefer a human relations approach, trying to improve staff morale and attempting to reduce staff resistance to their authority.
In relation to their managers however, junior managers tend to take more of a human resources approach, wanting their superiors to recognize and make full use of the full range of their personal talent and interests to maximise promotion and work enjoyment.
Generally established management workplace culture advocates employee participation in decisions which affect them, and the proportion of leaders who operate a command and control concept of leadership is definitely in the minority. However, there is much variation in the practice of participation, partly due to different contexts, and partly again due to junior managers seeing the process of participation of decision making as being different in practice depending on when they are making the decisions or when they are having decisions inflicted on them.
If we fast forward a hundred years, there are many things about these ground breaking experiments which resonate for modern management practice. Starting with the importance of understanding productivity of employees increases dramatically when they feel they are being heard. Smaller organisations tend to find it easier to involve younger employees, so they feel heard and their ideas appreciated, but it is possible to do this in even the largest conglomerate. Mayo showed that the primary motivator for employees is their work experience, not their salary. That does not mean salary is not important – it is. But the everyday lived experience of being at work is the key performance driver.
The Hawthorne Experiments also have contribution towards the very modern debates over workplace vigilance. This comes down to thinking about what you are measuring – inputs or output. Input measurement tends towards a focus on timekeeping, attendance, and software which measures activity levels. Output measurement focuses on what staff are achieving during their periods of paid work. By counting what I have achieved rather than stressing over when I have achieved it, employers are providing staff with greater flexibility about how to go about doing their jobs. This tends to increase productivity. However, there are some jobs which lend themselves to requiring the job holder to be present. Receptionists for example need to man the reception desk during defined times. Organisation’s attitudes to vigilance can be directly linked to culture. So what do we mean by this?
Organisational culture can be simply described as ‘the way we do things around here’ and is the unwritten rules that influence both individual and group behaviour plus attitudes. It is set at the very highest levels in an organisation and is closely linked to the personalities and priorities of the Leadership Team. While it is set at the top and re-enforced through observed behaviours; culture is driven by the staff and how each person goes about doing their jobs. A business can have the most amazing plans for success, but if the staff do not have faith, or are not on board with the vision then it is doomed to failure irrespective of how determined the person at the top is.

Culture impacts:
• Business mission. Appetite for risk is cultural. This impacts an organisations appetite for growth, and the type of growth. This can be seen as organic growth versus acquisition. Or it can be seen as being comfortable at the current level and wanting to focus on doing things better. Mission does not change that much over time but should still be reviewed regularly to make sure it is still the guiding light for the business. This is a key document telling staff and stakeholders what the overarching plan is – the big picture “why”.
• Underlying values. How we go about doing business is important. But outside of a commitment to obey the law, there are few right or wrong answers. A significant part of the population are highly values driven – how a business does business is incredibly important to them both as a worker and a consumer. Businesses are getting ever braver talking about the social issues which resonate with them and building these issues int o their business model. Others are quite happy to purely focus on profit and are less bothered about how they generate it.
• Adherence to rules. There are necessary rules that have to be followed in all organisations. For many, there are legislative and regulatory rules which set the compliance tone. But even in the most heavily regulated sectors, individual companies will have different attitudes to complying with those rules. From those who make it their mission to be compliance centric, to those who pay little more than lip service. Partly this is down to attitude to business risk – those who pay lip service are running higher reputational and business risk, but also where organisations see their USPs – Unique Selling Points. A USP can be created from being compliance focused, but it can equally to set for skirting the rules as there will be an element of the customer population who is really attracted to that attitude. The adherence to rules will also be driven by staff training and supervision arrangements – highly compliant organisations will need to spend more time doing both compared to those with a laxer approach.
• Attitude to quality. Ultimately the adherence to rules is closely linked to how important quality is to the business. As you will read in Course Manual 4, There are two main principles when we explore quality assurance: Is the product or service fit for purpose? Can you produce the product or service in a way which is right first time? Both are cultural and based on what the Leadership Team considers important. You can pay lip service to quality by reassuring everyone that it is important, but then doing little to put it at the front of day-to-day practice. If you are going for a right first-time mentality then this again requires a big investment in the right staff, training, and monitoring to make sure defects are spotted and action taken to make sur ethe same problem does not occur a second time. This is hard work for management, and not everyone enjoys working in this way. A quality first organisation will also need to focus on recruiting the staff who want to work this way and consider this to be the way to do business.
• Decision making styles. How the management team make decisions impacts the culture of how everyone else works. Highly analytical leaders will always be pushing for the data, and those who rely on gut instinct and intuition will tend not to run a data led organisation. Understanding the questions your boss will ask and making sure you have these answers in place in order to get a ‘yes’ is part of organisational culture. This may be how one manager in a business like to work – but their preferences can create smaller sub-cultures of how things are done in a particular department. It is not uncommon to also have different cultures at different levels in a business – so the Senior Leadership Team work in one way but the next layer down, who have different pressures and experiences may work differently. This can cause a corruption in culture – so the people at the top have one set of beliefs and those who work below them begin to work in a way which is contra to them, not because they want to but because external pressures lead them to start cutting corners to get the job done in the short term.
• Management styles. How we choose to manage our team set the day-to-day culture. A manager who is laid back about the details will manage in a different way to one who has a passion for the small things. This is partly down to individual personalities but also down to the type of work being done. But how a boss chooses to manage their team creates a culture in that team – irrespective of what the wider corporate culture is supposed to be. There can easily be a gap between the advertised culture from policies, corporate communications, and procedures to the real experienced culture which can be completely different. As with a lot of things to do with culture, hiring and promoting the right people, training them properly, and how you supervise them are the keys to aligning how people are actually operating. It is common to hear of organisations with a blame culture – where it is more about passing the buck than about understanding why a problem has occurred, learning from it and resolving the situation so it doesn’t happen again.
In short, culture is everything. It is the ephemeral glue that binds people together, or it is a silent killer, and a key reason behind many business failures. Culture is the most important driver of success, and the hardest thing to change.
What is culture?
• Shared values
• Beliefs and assumptions about how people should behave and interact at work
• Unwritten rules about how decisions should be made
• How work activities are carried out.
Culture forms over time, and also changes with time. In part it is a reflection of wider social norms, and a reflection of the people who work for the business and the needs of those who interact with it. By understanding the culture in your organisation you are in a better place to be able to implement strategy and achieve goals as you are more likely to develop plans which go with the flow – these are much more likely to be approved and will be easier to implement as there will be less resistance to change which is seen as contra to the current culture.
Course Exercise 6 – Human Relations Theory
Discuss the findings from the Hawthorne experiments and your understanding of Quality Assurance Theory and apply to the Sport Direct case study.
• What recommendations would you make to improve the business situation at Sports Direct based on these two manuals?
• What data would you collect to inform your decision making?
• How can you apply this learning back to your own context and data collection?

Course Manual 7: Quality Assurance
There are two main principles when we explore quality assurance:
1. Is the product or service fit for purpose?
2. Can you produce the product or service in a way which is right first time?
Fitness for purpose forces us to consider the design of what we are producing – does this product or service meet customer requirements? Is the design safe? Are the chosen materials going to last? By focusing on quality at the design stage, the logic is that ultimately this reduces the cost of fixing things later which we didn’t get right at the start. While the principles of quality management started in manufacturing – with a focus on minimising production deviations, and making sure the same item is produced which meets the requirements 100% of the time.
These principles also hold true for service-based organisations. This means understanding what a service needs to do, what each stakeholder needs, and how best to create customer delight and then putting all of this information into the service design, the procedures, ways of working and then making sure staff are training and managed to deliver to that standard. Think of all the times you have been frustrated by either a product or service not doing what you needed it to do, or breaking down – this is a lack of fitness for purpose.
Right First Time is a state of mind, and links to organisational culture. There are several really good business benefits to adopting this way of working including reducing the costs of having to scrap products which do not get manufactured to standard, or the costs of having to go out and repair something which has broken because it was not installed correctly. Within service businesses it can include the costs of needing to get paperwork re-signed or needing a big customer service team to deal with a high number of customer questions and complaints. It is great that a company has a big customer service team – but wouldn’t it be better if the rest of the business did their jobs so well that it wasn’t needed?
To implement these two principles organisations need to concentrate on four stages of operations: planning, implementing, evaluating, and complying with the standards that are needed to assure quality in the products or services they are producing.
The ISO 9001 international quality standard focuses on seven key principles:
Customer focus: In common with all the leading quality standards and theories, the ultimate arbiter of quality is the customer or end user. Only they know if the product or service meets their needs. All businesses also need to meet the requirements of wider stakeholders and legislation when designing products and services, and these quality and safety standards may not impress customers than much. But a failure to comply is disastrous.
Leadership: Leaders decide if quality is important to the business. If they don’t see quality as a priority, then the culture within the business will reflect this. It will be OK for procedures to not be followed, for the phone to not be answered, for mistakes to be made. And the business will have a fly by the seat of your pants and firefighting culture where a lot of time is spent fixing things that were not done right in the first place. This is not to say that you have to create a blame culture – quality is not about passing the buck but again, about just getting it right the first time you are asked to do the task.
Engagement of people: While we can’t create a quality environment without great leadership, we also cannot to do it without the right staff, who are trained, supported and managed to work in a right first-time manner. Culture is all encompassing, and quality is a cultural activity. It needs to be part of how we do things around here, and organisations need to start with hiring people who want to work in that manner. Not everyone does.
Process approach: Processes sound very boring. And having to carry out big parts of your job in the same way every time can feel soul destroying. But in terms of unifying things so everyone is working the same way, and customers get the same great experience every time processes are key. The key is to consider what needs to be pinned down and quality controlled, and where you can allow staff to use their initiative. If you need to collect certain data to fulfil contractual requirements then there is no negotiation – it has to be done, and you need to be able to check quickly and easily that you have 100% compliance. But customer service teams might not need to follow a strict script, so should be trained to show more personality and ask more questions – finding out more about he issue can help improve outcomes while improving staff’s work enjoyment.
Improvement: The whole point of quality management is to improve things, so if nothing is changing it is a reason to go back to the beginning and start again.
Evidence-based decision making: The origins of quality management come from manufacturing and so this is very data led. If something cannot be measured then it probably can’t be objectively seen to improve. Focus on thinking about how you can work to be able to measure the unmeasurable. This is normally looking at how you can measure feelings – of satisfaction or excellence. It comes from defining what we mean by these terms. Once you have the definition it is much easier to identify how to measure progress against the definition.
Relationship management: Customers look to build relationships, and if we are to get the best out of our staff ream we have to build and evolve the relationship we have with them
Total Quality Management is one of the key theories in this area, and it focuses very much on customer satisfaction as being the key driver of success. This means that all the members of the organisation contribute towards the improvement of products, processes, and services. This is turn leads to them improving their working culture.
Course Exercise 7 – Quality Assurance
Discuss the findings from the Hawthorne experiments and your understanding of Quality Assurance and apply to the Sport Direct case study.
• What recommendations would you make to improve the business situation at Sports Direct based on these two manuals?
• What data would you collect to inform your decision making?
• How can you apply this learning back to your own context and data collection?

Course Manual 8: Sports Direct Case Study
Sports Direct is part of Frasers Group, an UK based retail group. The Sparts Direct part of the business is the main driver of the over group financial performance and accounts for 58% of group revenue, with the latest announced earnings being £1.4bn, up 23.5%.
As Marketing Week says “Sports Direct’s stores are nothing if not distinctive. Cramming sporting kit next to jeans, cheap merchandise and even handbags, the retailer has made a brand out of its “pile ‘em high, sell ‘em cheap” strategy.”
Key parts of the customer experience include a market stall environment to enhance feelings of getting a good deal. They have also recently fallen out with Adidas which is refusing to sell Chelsea and the Spanish national team’s kit in its stores. Marketing analysts accept that Sports Direct delivers ‘Basic Retailing At Its Best’, and the total focus on price at the expense of innovation has so far worked, allowing them to snap up brands such as Lillywhites, Donnay and Dunlop Slazenger that boost perceptions of value. This means they continue to dominate retail brands which have better perception of quality.
Because the poor in-store experience is not at odds with its pricing and discounting message Sports Direct has continued to grow without needing to adapt to improve things in these areas. By keeping things simple, being aggressive and very target driven with staff, they are able to keep costs low. By merging pre-established household name brands into their own label stable they are able to discount products that customers recognise. This angle is unique and gives them a significant USP.
In terms of customer perception though, Sports Direct has a poor reputation compared with other brands for quality, reputation and impression. Its performance on YouGov’s BrandIndex rating is 3.8, putting it in 24th place out of 30 high street retailers, while its buzz rating, is 0.1 placing it in the in the bottom five
Sports Direct claims to have invested in staff training and introduced a generous share scheme for full-time staff. Latest staff turnover figures suggest this has worked, reducing staff turnover from 35% to 17%.
Below you will find a collection of articles and real world reviews for customers and staff of Sports Direct to help you make up your own minds.
Sports Direct has been voted ‘the worst sports shop in Britain’ in a survey of nearly 11,000 shoppers.
Consumer champion website Which? asked customers about various factors influencing their shopping experience, including Covid-secure measures and returns policies. It ended up with a total of 65 out of 100 and just two stars in the ratings, putting the brand at the bottom of the table. The questionnaire to 10,909 Which? members looked at 29 online and bricks-and-mortar retailers that sold sports, cycling, exercise and related items.
Sports Direct fared particularly badly on sales and returns. Which? said: ‘One shopper in our survey said the retailer was a last option due to its “bad returns policy”. A Sports Direct spokesperson told Which?: ‘We value our customers’ opinions and are investing significant sums into improving the customer journey.’
Costco, Littlewoods, American Golf, House of Fraser and Debenhams were just ahead of Sports Direct at the bottom of the list, and the best-rated stores in the survey were Rohan and Sweaty Betty, with outdoor specialists Blacks and Mountain Warehouse ranked in the middle.
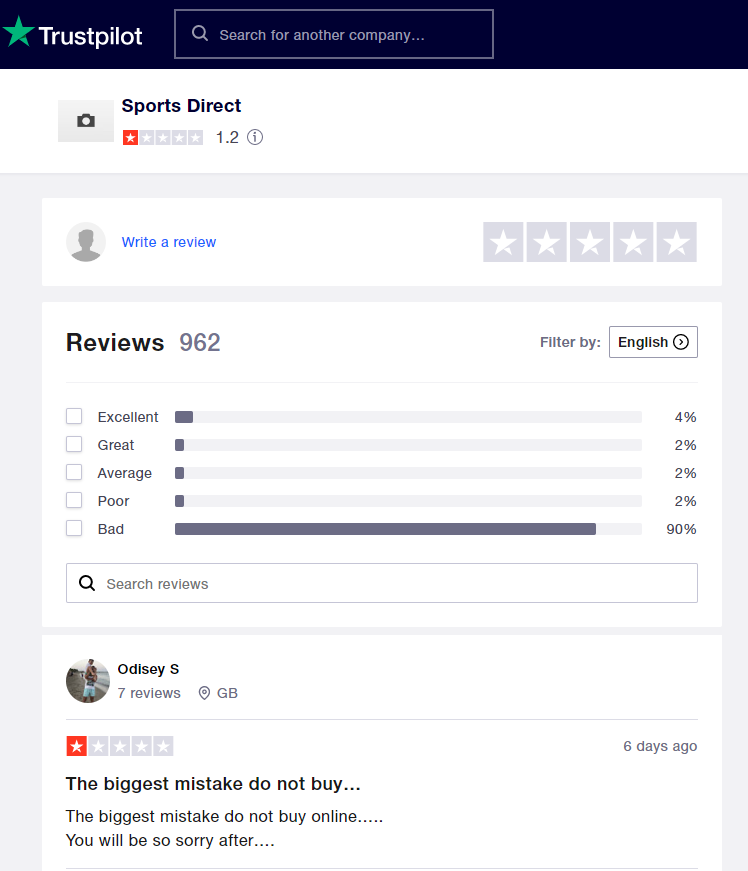


Article: The Guardian, March 2020, Mark Sweney and Simon Goodley
“Sports Direct’s Mike Ashley apologises for poor Covid-19 actions
After trying to keep shops open, boss says emails to government were ill-judged and poorly timed
Mike Ashley says Frasers Group will try to make amends by offering its fleet of lorries to help deliver medical equipment. Photograph: Kirsty O’Connor/PA
Mike Ashley has issued a public apology after his spat with the government about trying to keep his Sports Direct chain open when non-essential businesses were ordered to close.
Ashley’s Frasers Group, which includes House of Fraser and Evans Cycles, had intended to keep Sports Direct open as other non-essential retailers closed, on the basis that selling sporting and fitness equipment made the company a vital asset as Britons were forced to stay at home.
He eventually bowed to government pressure and shut his stores on Tuesday but is continuing to operate online via the group’s Derbyshire warehouse, where the company has admitted it is struggling to enforce the government’s Covid-19 regulations for thousands of workers.
“I am deeply apologetic about the misunderstandings of the last few days,” Ashley said in an open letter. “Given what has taken place over the last few days, I thought it was necessary to address and apologise for much of what has been reported across various media outlets regarding my personal actions and those of the Frasers Group business.”
In its attempt to stay open, the company went as far as lobbying Boris Johnson directly with a public tweet after the prime minister on Monday ordered that all non-essential stores should close.
Michael Gove, the Cabinet Office minister, told BBC Radio 4’s Today programme on Tuesday that Sports Direct had made the wrong call and that its stores should not be open. Its management had “got the message”, Gove added, after Sports Direct agreed to close stores.
Ashley said on Friday: “Our intentions were only to seek clarity from the government as to whether we should keep some of our stores open. We would never have acted against their advice. In hindsight, our emails to the government were ill-judged and poorly timed, when they clearly had much greater pressures than ours to deal with. On top of this our communications to our employees and the public on this was poor.”
Ashley said the company had since sought to make amends by offering its entire fleet of lorries to help deliver medical equipment and supplies for the NHS and all key workforces across government. “We will help wherever possible,” he said.
Ashley also praised his workers, some of whom were made to come in on Tuesday for tasks such as stocktaking.
“I would especially like to thank my Frasers Group employees, who have stood by the business in difficult times and are doing so currently,” he said. “We are working very hard to save our business. We will learn from this and will try not to make the same mistakes in the future.””

Article: Varsity, October 2015 by Andy Griggs
“Sports Direct is worse than you think
A former employee gives us his take on what he sees as incredibly dodgy business ethics.
In the summer holidays I worked at Sports Direct.
Sports Direct is a company that gets a very bad rap. Workers and commentators alike claim that Sports Direct is a stingy company, uninterested in the welfare of its workers and concerned only with the pursuit of pure, unadulterated profit.
Mike Ashley, the owner of Sports Direct, is a very clever businessman. This is something that I will not dispute; the man understands the limited lifetimes of individual brand names, and excels in turning those famished labels into something profitable, through the kind of capitalist wizardry that I cannot be bothered to explain here.
But here’s the thing; in my informed opinion as a former employee, I believe that it is my responsibility to explain to you that Sports Direct does not care one iota for the consumer. It is the concern of Sports Direct to extract every penny it can from its customers; there is no time for customer care or exemplary service in Mike Ashley’s World. For Ashley, the big game is solely the pursuit of profit – never mind the casualties.
When you apply for a job at Sports Direct, you are given a bog-standard interview assessing your basic human faculties. Can you work as a team with other people? Do you have goals and ambitions? Can you differentiate your Londsdales from your Airwalks
Of course you can, and Sports Direct knows this. It is not difficult to enter the payroll of this company. But when you get there, the problems begin. The agenda becomes clear, and Sports Direct starts to betray inklings as to why many question its business practices.
During the induction to my career at Sports Direct I was told a number of things. Pretty much all of these things were concerned with the maximisation of profit at the expense of customer satisfaction. I was told, for example, that “own brand” products – such as Sondico football boots, Everlast sneakers or Dunlop insoles – would fetch a half-decent commission if you managed to persuade your hapless customer that they were in some way superior to their multinational competitors. And of course they weren’t – they were pretty terrible, made by some poor soul in the Far East for a pitiful wage just as the Nikes were – but that didn’t matter. All that mattered was clever lying, and any customer that couldn’t tell the difference between that and legitimate sales advice was prey.
At one stage during my initiation I was even told by my manager to lie if a customer happened to request a Nike football boot. You see, these didn’t fetch Mike Ashley as many pennies as his own brand equivalent. “If someone asks for the new Mercurials, tell them no, we don’t have them in at the moment – but we do have these Sondicos which are just as good and half the price!” Just lie, buddy! That’s a great model for any business looking to survive beyond the next decade!
This is not the essence of salesmanship. A salesperson should deliver the ideal product for their given customer, regardless of marginal monetary benefit to the company. And do not get me wrong; I bought into the Sports Direct mentality entirely. I swindled many tens of people out of twelve quid for the sake of some insoles or Karrimor running socks. I knew these things would fall apart within a couple of months of purchase, but I gained commission off of their sales, so it didn’t matter. And since I am good at speaking, I managed to sell quite a few of these inferior products. I’m sorry if my buyers are disappointed. As the old defence goes: “I was just following orders.”
This is the fundamental problem with companies like Sports Direct. They manage to convince their employees that the work is positive, mainly by emphasising the monetary incentives that specific sales bring to workers. But this isn’t what a business should be about. A business should deliver a service or product to consumers, but it shouldn’t exploit them. It is almost a double insult for Ashley’s behemoth to display its low-regard for consumers through misleading salesmanship, when the products themselves are exploitative, created by virtual slaves in Far Eastern economies for Western markets.
I’m not even a socialist; I believe in the power of capitalism to change lives for the better. But Sports Direct is a paean to all that is wrong with capitalism in the 21st century; it’s a chimera of commerce. Next time a Sports Direct employee advises you to purchase one of their rubbery insoles or feathery socks, take my advice: tell them to get stuffed.”

Glassdoor
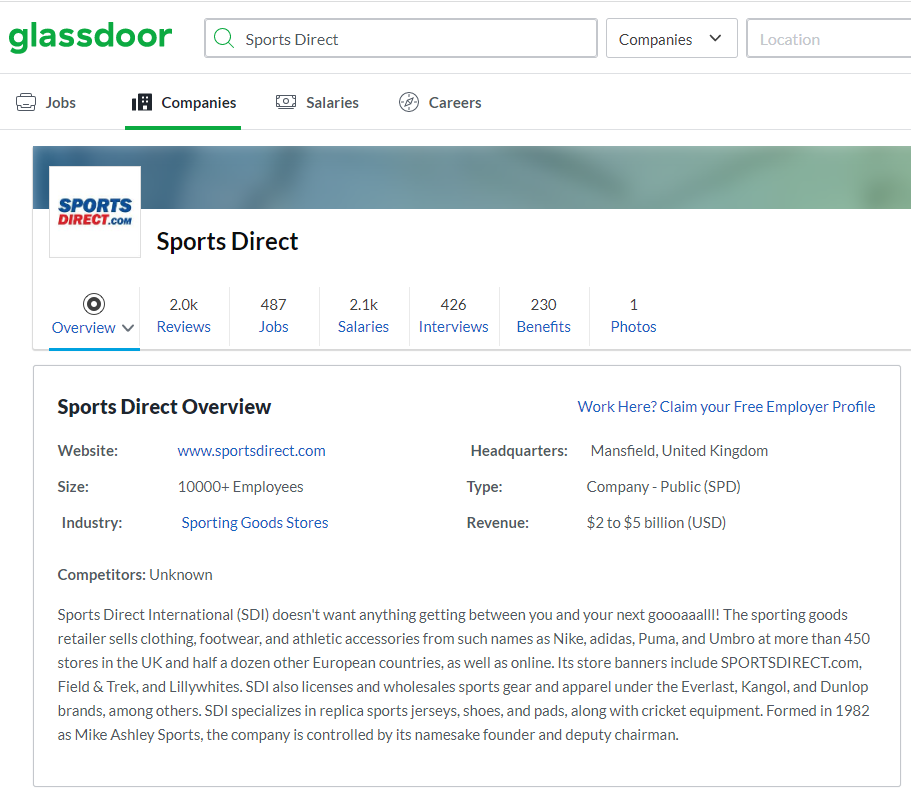


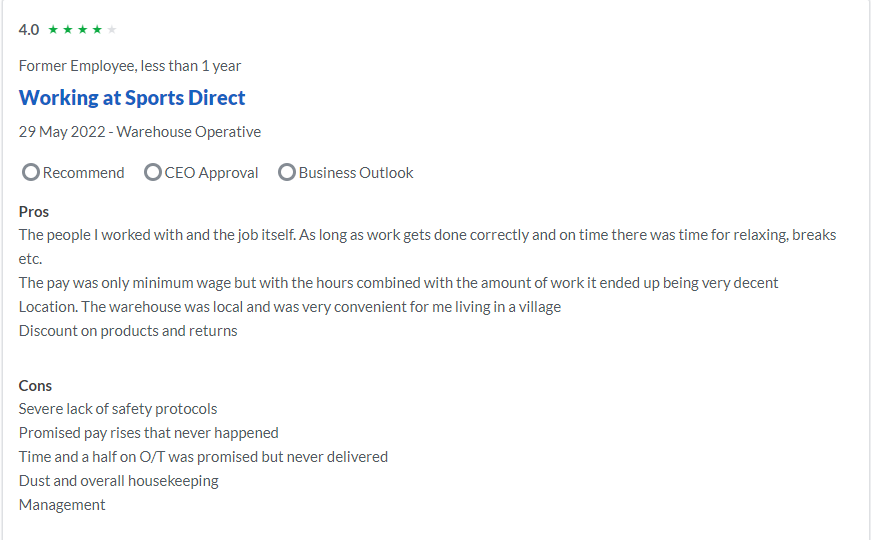
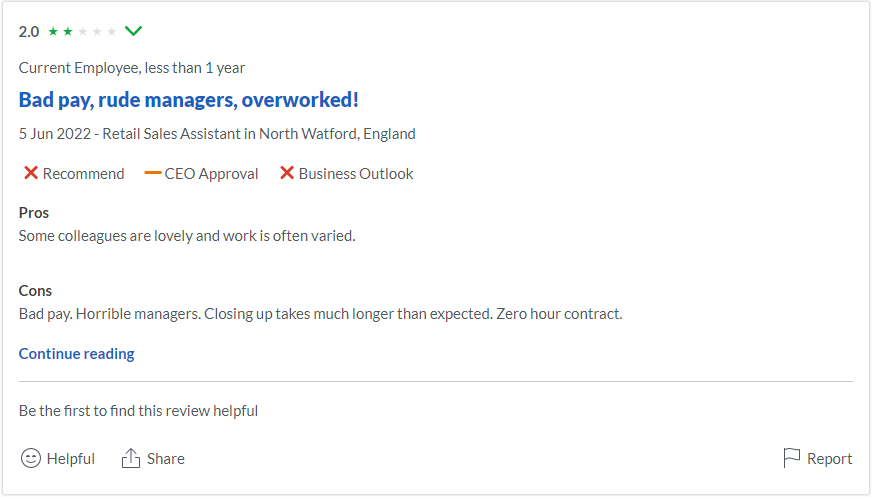

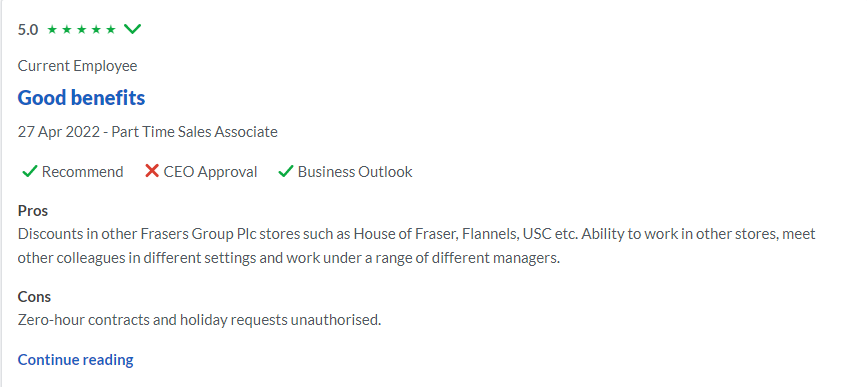
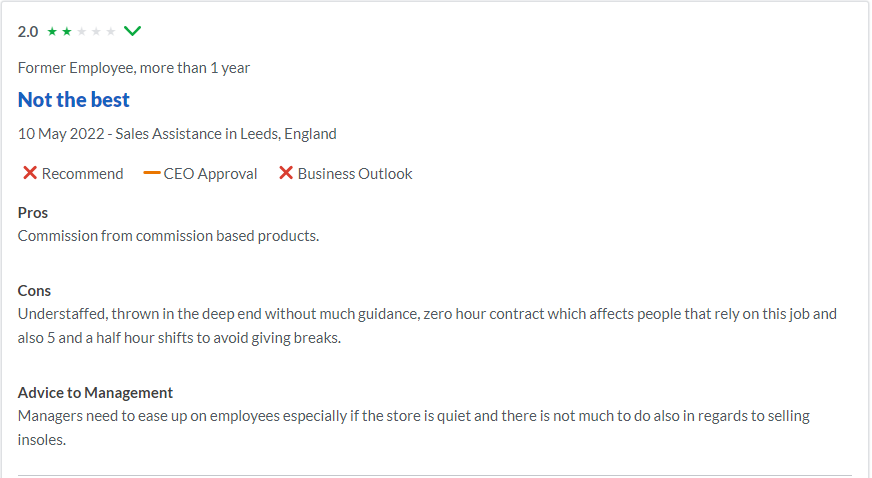
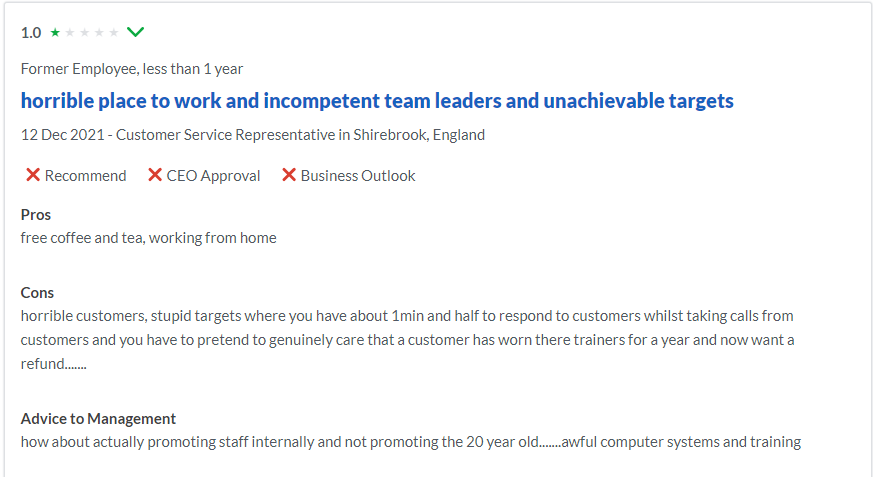
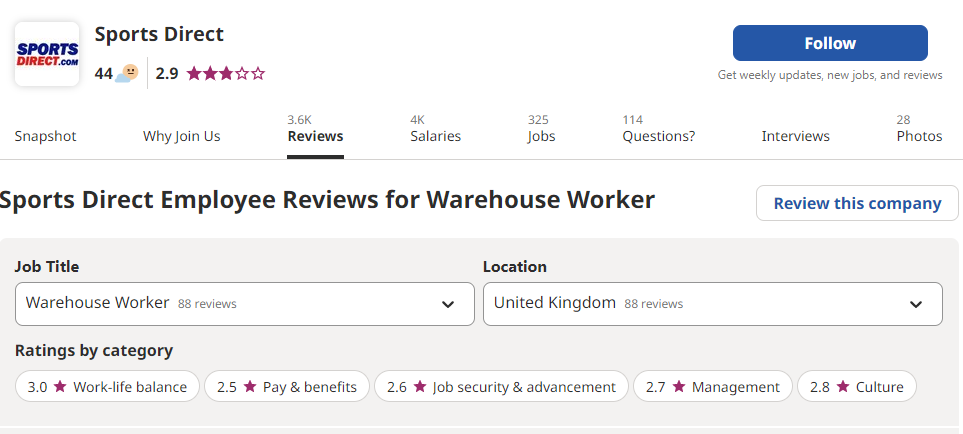
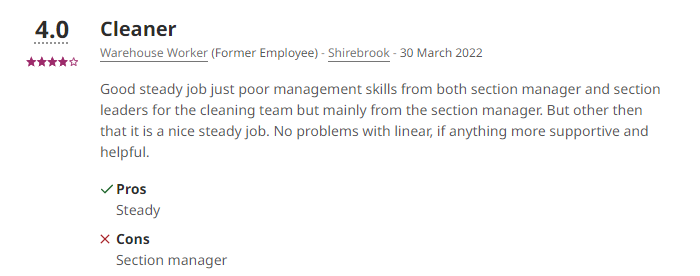
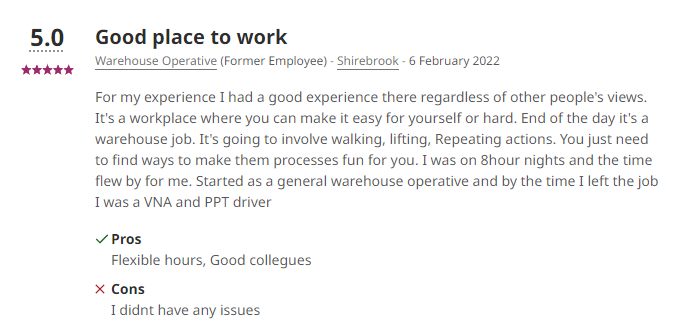
Course Exercise 8 – Sports Direct Case Study
Discuss the findings from the Hawthorne experiments and your understanding of Quality Assurance and apply to the Sport Direct case study.
• What recommendations would you make to improve the business situation at Sports Direct based on these two manuals?
• What data would you collect to inform your decision making?
• How can you apply this learning back to your own context and data collection?

Course Manual 9: Systems Theory
Systems thinking is a holistic approach to analysis that focuses on the way that a system’s constituent parts interrelate and within the context of larger systems how they work over-time. It encourages the consideration of organisations both as a system and in the context of their external environment. It looks at how the different sub-systems within an environment interact to either create synergistic performance enhancements or through natural entropic influences decline in performance.
It’s important to understand how these ideas apply to your organisation. Without a good understanding of the fundamental concepts of System Theory and Thinking it will be difficult for you to create positive change within your organisation. This workshop will cover the most important aspects of the System Theory in terms of how they apply to an organisation or company.
Systems Theory can be used to define the environment in which your company exists and its role within its business environment. Systems Theory acts to define the boundary between the internal and external environments of the company; it also works to identify the inputs and outputs that cross those system boundaries.
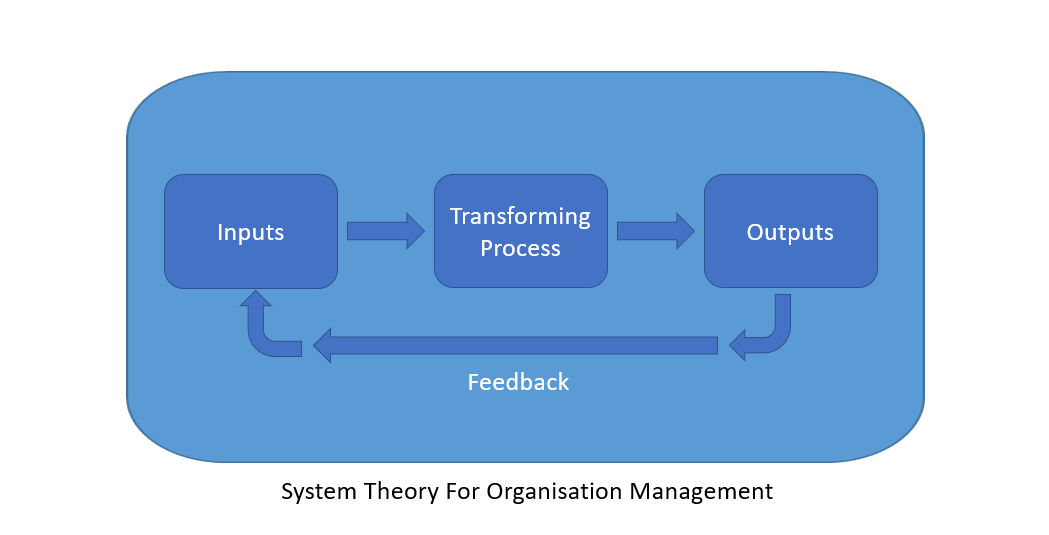
Systems Thinking includes a broad range of concepts that are used to describe the system environment;
Entropy – Entropy is a measure of the degree of disorder in a system. It is a familiar term in thermodynamics, when considering chemical systems, and is also relevant to information systems. The concept of entropy says that any system will tend towards disorder and decline if left untended.
Inertia – Inertia comes from the Latin word, iners, meaning idle and sluggish. Newton defines inertia as the following: “everything which remains in the stagnant situation or a constant movement unless an external force activates it”.
Synergy – Synergy is a prevalent emergent property in biological systems that arises from the concerted action of multiple factors producing an amplification or cancelation effect compared with individual actions alone.
Environment – a system is a community situated within an environment.
Input-Throughput-Output – in a closed system inputs are determined once and constant; in an open system additional inputs are admitted from the environment.
Dynamic Homeostasis – Dynamic homeostasis is the ability of a body to regulate its internal processes for the purpose of maintaining an equilibrium state and Feedback.
Equivocality – An expression or term liable to more than one interpretation: ambiguity, double-entendre, equivocation, equivoque, tergiversation, and Requisite Variety.
Interconnectedness – Systems thinking requires a shift in mindset, away from linear to circular. The fundamental principle of this shift is that everything is interconnected. Everything needs something else, often a complex array of other things, to exist and survive.
Even inanimate objects are dependent on other objects for their existence. For instance; a chair cannot exist if there isn’t a tree grow to make it out of. This gives us a way of viewing the world that is no longer linear but based on a set of dynamic, chaotic, interconnected relationships and feedback loops.
Synthesis – Synthesis refers to the combining two or more things to create something new. In systems thinking the ultimate goal is synthesis, as opposed to analysis, which is the dissection of complexity into manageable components. Analysis fits into the mechanical and reductionist worldview, where the world is broken down into parts.
Systems thinking sees systems as dynamic and complex entities; so it provides a more holistic approach to understanding phenomena. Synthesis is about understanding the whole and the parts at the same time, along with the relationships and the connections that make up the dynamics of the whole.
Emergence – From a systems thinking perspective larger things emerge from smaller parts. Emergence is the logical outcome of things coming together. Emergence is the outcome of the synergies of the parts; it is about non-linearity and self-organization, and the term ‘emergence’ is used to describe the outcome of things interacting together.
A simple example of emergence is a snowflake. It forms out of environmental factors and biological elements. When the temperature is right, freezing water particles form in beautiful fractal patterns around a single molecule of matter, such as a speck of pollution, a spore, or even dead skin cells. At all other temperatures the same particles behave differently.
Feedback Loops – Since everything is interconnected, there are constant feedback loops and flows between elements of a system. We can observe, understand, and intervene in feedback loops once we understand their type and dynamics.
The two main types of feedback loops are reinforcing and balancing. What can be confusing is a reinforcing feedback loop is not usually a good thing. This happens when elements in a system reinforce more of the same, such as population growth or COVID infection rates where growth occurs exponentially. In reinforcing loops, an abundance of one element can continually refine itself, which often leads to it taking over.
A balancing feedback loop, however, is where elements within the system balance each other out. In nature the predator/prey situation would be an example of this — reducing the number of predators can lead to a population explosion; reducing the number of prey can lead to a fall in the number of predators and so forth. These are all types of reinforcing feedback.
Finally, there are then a set of organizational system principles;
1. The activities within a system define the system and are interrelated and interdependent on each other.
2. The effectiveness of how an overall system functions is determined by how its subsystems function Inputs move into the system and outputs move out of the system through permeable and defined boundaries.
3. The permeability of the boundary can be controlled by the system.
4. It takes positive energy injected into the system to overcome entropy.
5. Levels of synergy are inherent in how interactive and interdependent parts of a system are with each other.
6. There are multiple ways to reach a desired outcome, in other words, there is no “one best way”.
7. Subsystems exit within a larger system and have the same characteristics and principles as the larger system.
Course Exercise 9 – Systems Theory
Apply systems theory to Sports Direct. Then answer these questions:
• Give an example of entropy in the Sports Direct case study.
• How does system theory connect the Customer Service and Customer Experience for Sports Direct?
• How can you use this to identify change constraints?
• What data would you collect to inform your decision making?
• How can you apply this learning back to your own context and data collection?

Course Manual 10: Root Cause Analysis
Root cause analysis does what is says on the tin. It is a systematic technique for identifying the underlying reasons sitting behind a problem or symptoms. This way of thinking then helps us to devise effective solutions. This allows leaders to move away from firefighting to actually being able to put some of these fires out. As a technique, it is an obvious next step on from benchmarking which will show you the symptom of a problem – high staff turnover for example. Once you have identified your staff turnover is higher than industry norms, we can then use Root Cause Analysis to unpick the reasons why that might be the case, so we can then start to do something about it.
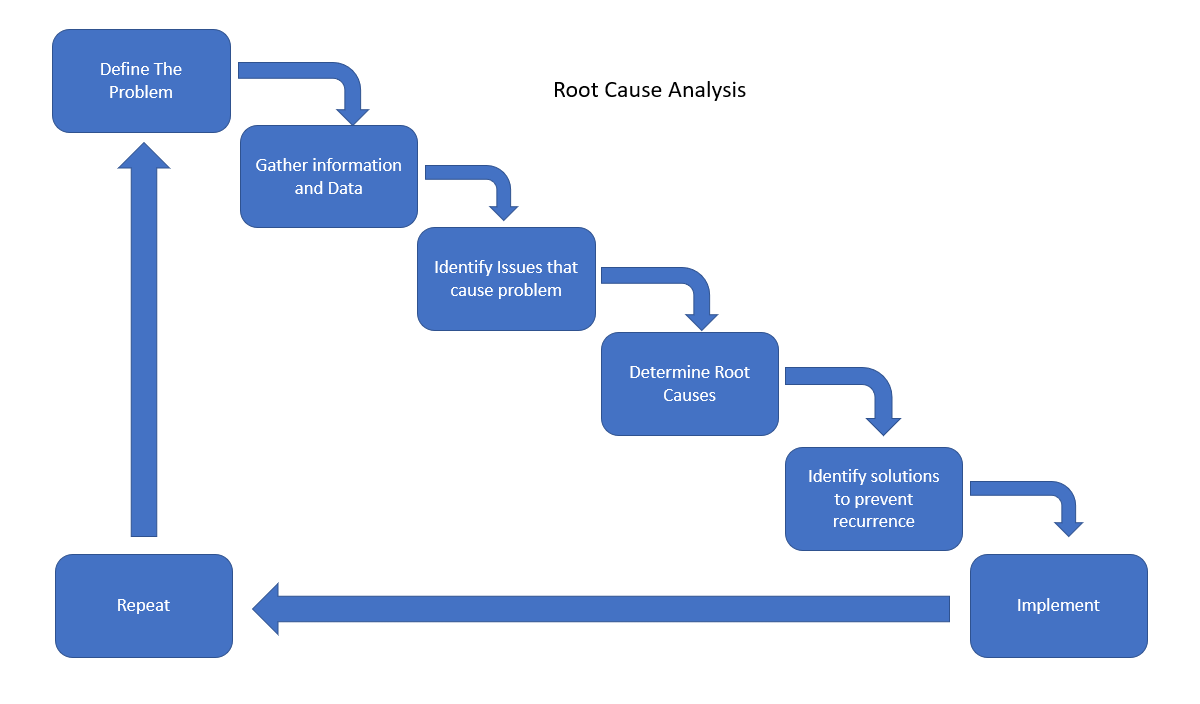
Expanding our thinking around staff turnover, we can use internal benchmarking to see if this is universal issue or specific to a couple of departments. A consistent level of staff turnover across the business indicates a need to explore length of stay. Possible root causes may be:
Type of employment contract. If you have high levels of staff on zero hours contracts, then the no frills nature of your relationship with them does not encourage long term commitment.
Recruitment Practices: High numbers of people leaving within 6 months of starting indicates a mis match between the types of people you are recruiting and the types of people you need to be recruiting. This may be because of:
o Who is making recruitment decisions
o Pay levels being offered
o The interview process
o Induction
Management practice: Research shows a high level of correlation between staff turnover and a poor relationship with supervisors. The reasons why weak management practice can be toxic can be traced back to human Relations Theory in Manual 6. This may be because:
o Lack of effective Management training
o How managers are supervised by their superiors
o Workload
o Recruitment and promotion decision making
o Managers not enjoying being managers
External factors: Sometimes there is just a wave of people moving on. The PESTLE analysis in manual 2 showed how deeply rooted in the external environment a business is. However, just because an issue developed due to external factors it does not mean that as leaders we do not need to understand it, or work towards mitigating it. External causes could include:
o Changes to pension arrangements
o Maternity regulations
o Wanting work that is more cause motivational
o Tax or benefit changes
We can see from this example that Root Cause Analysis is multi-layered. Once we have identified one possible cause, our job is to keep asking questions to uncover the possible reasons, and then to explore each of these reasons, over and over and increasing levels of detail until we have clearer picture. A great technique for this is to keep asking “Why?” It is incredibly annoying, but repeatedly asking that question really helps get to nub of the issue. So this can be quite fun as you unleash your inner 8 year old. So with our staff turnover example:
Why are more people leaving in the first 6 months this year compared with last year and above industry average?
“They say at exit interview that they don’t like the pressure”
Why?
“We have 5 fewer staff in the department this year.”
Why?
“Partly because people keep leaving and we can’t replace them quickly enough”
Why?
“Fewer people are applying.”
Why?
“Don’t know. We are doing everything in the same way we did last year.”
Why?
“Because it worked last year.”
Why?
“We were paying more compared with our competitors.”
And now we have some potentially actionable answers. By reviewing our pay rates against the industry and increasing them we can hopefully increase the quality and volume of candidates. We have also uncovered that the persistent understaffing is creating a pressured environment, so can explore maybe using cover staff or outsourcing to take the pressure off and get the team back under control. It is also showing us that we may need to review our job adverts and where we are placing them and could look at how staff are being performance managed to create a softer working environment.
So the key Goals and benefits for this technique are:
• To discover the root cause of a problem or event.
• To fully understand how to fix a problem, compensate for an issue, and what can be learnt to apply more widely.
• To apply what we have learnt to prevent future issues or to repeat successes. Root cause analysis does not just have to be used in the context of understanding what is going wrong. We can also use to understand why things are going right – so we can them extract the best practice for application more widely.
• Understanding what is going on underneath the surface so you do not have to solve the same problem over and over again. So rather than a teacher having to give the same feedback to students over and over again with key tips to set out an essay, they could deliver a short session to the class teaching them about essay structure.
Key Principles for effective Root Cause Analysis
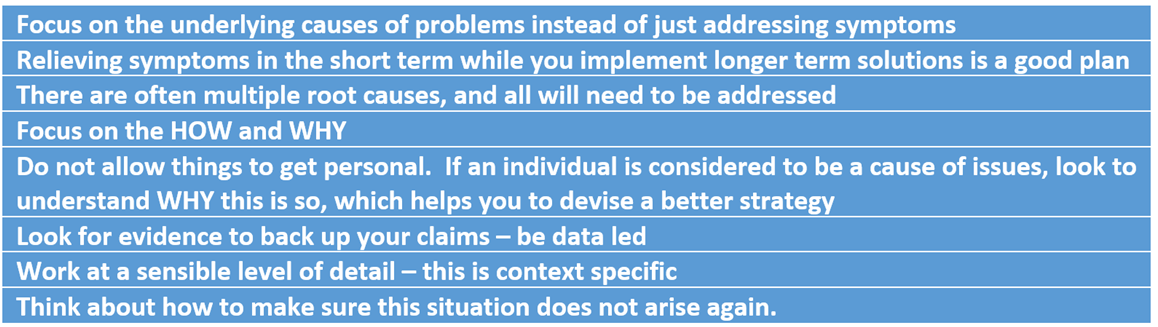
Ishikawa diagrams
Otherwise known as Fishbone Diagrams, these help to give a visual layout to support Root Cause Analysis. The layout supports the why method of keeping exploring until you have the right level of detail in a multi-layered approach

So, the problem sits either along the spine or at the head of your fish. Start by brainstorming the general categories of possible causes – these are the key big bones of the skeleton, and then continue to keep asking why to generate the smaller bones and increased detail until you have uncovered the root causes. This example diagram has only 2 levels of detail but do not be afraid to go in much more detail. In the same way as SWOT and PESTLE benefit from starting with a big piece of paper, so does a good Fishbone diagram. It can seem contra- intuitive to use paper or a whiteboard first and then have to type things up later, but the big surface encourages collaboration, and the later quiet reflection that comes from digitisation helps to clarify thoughts and layout.
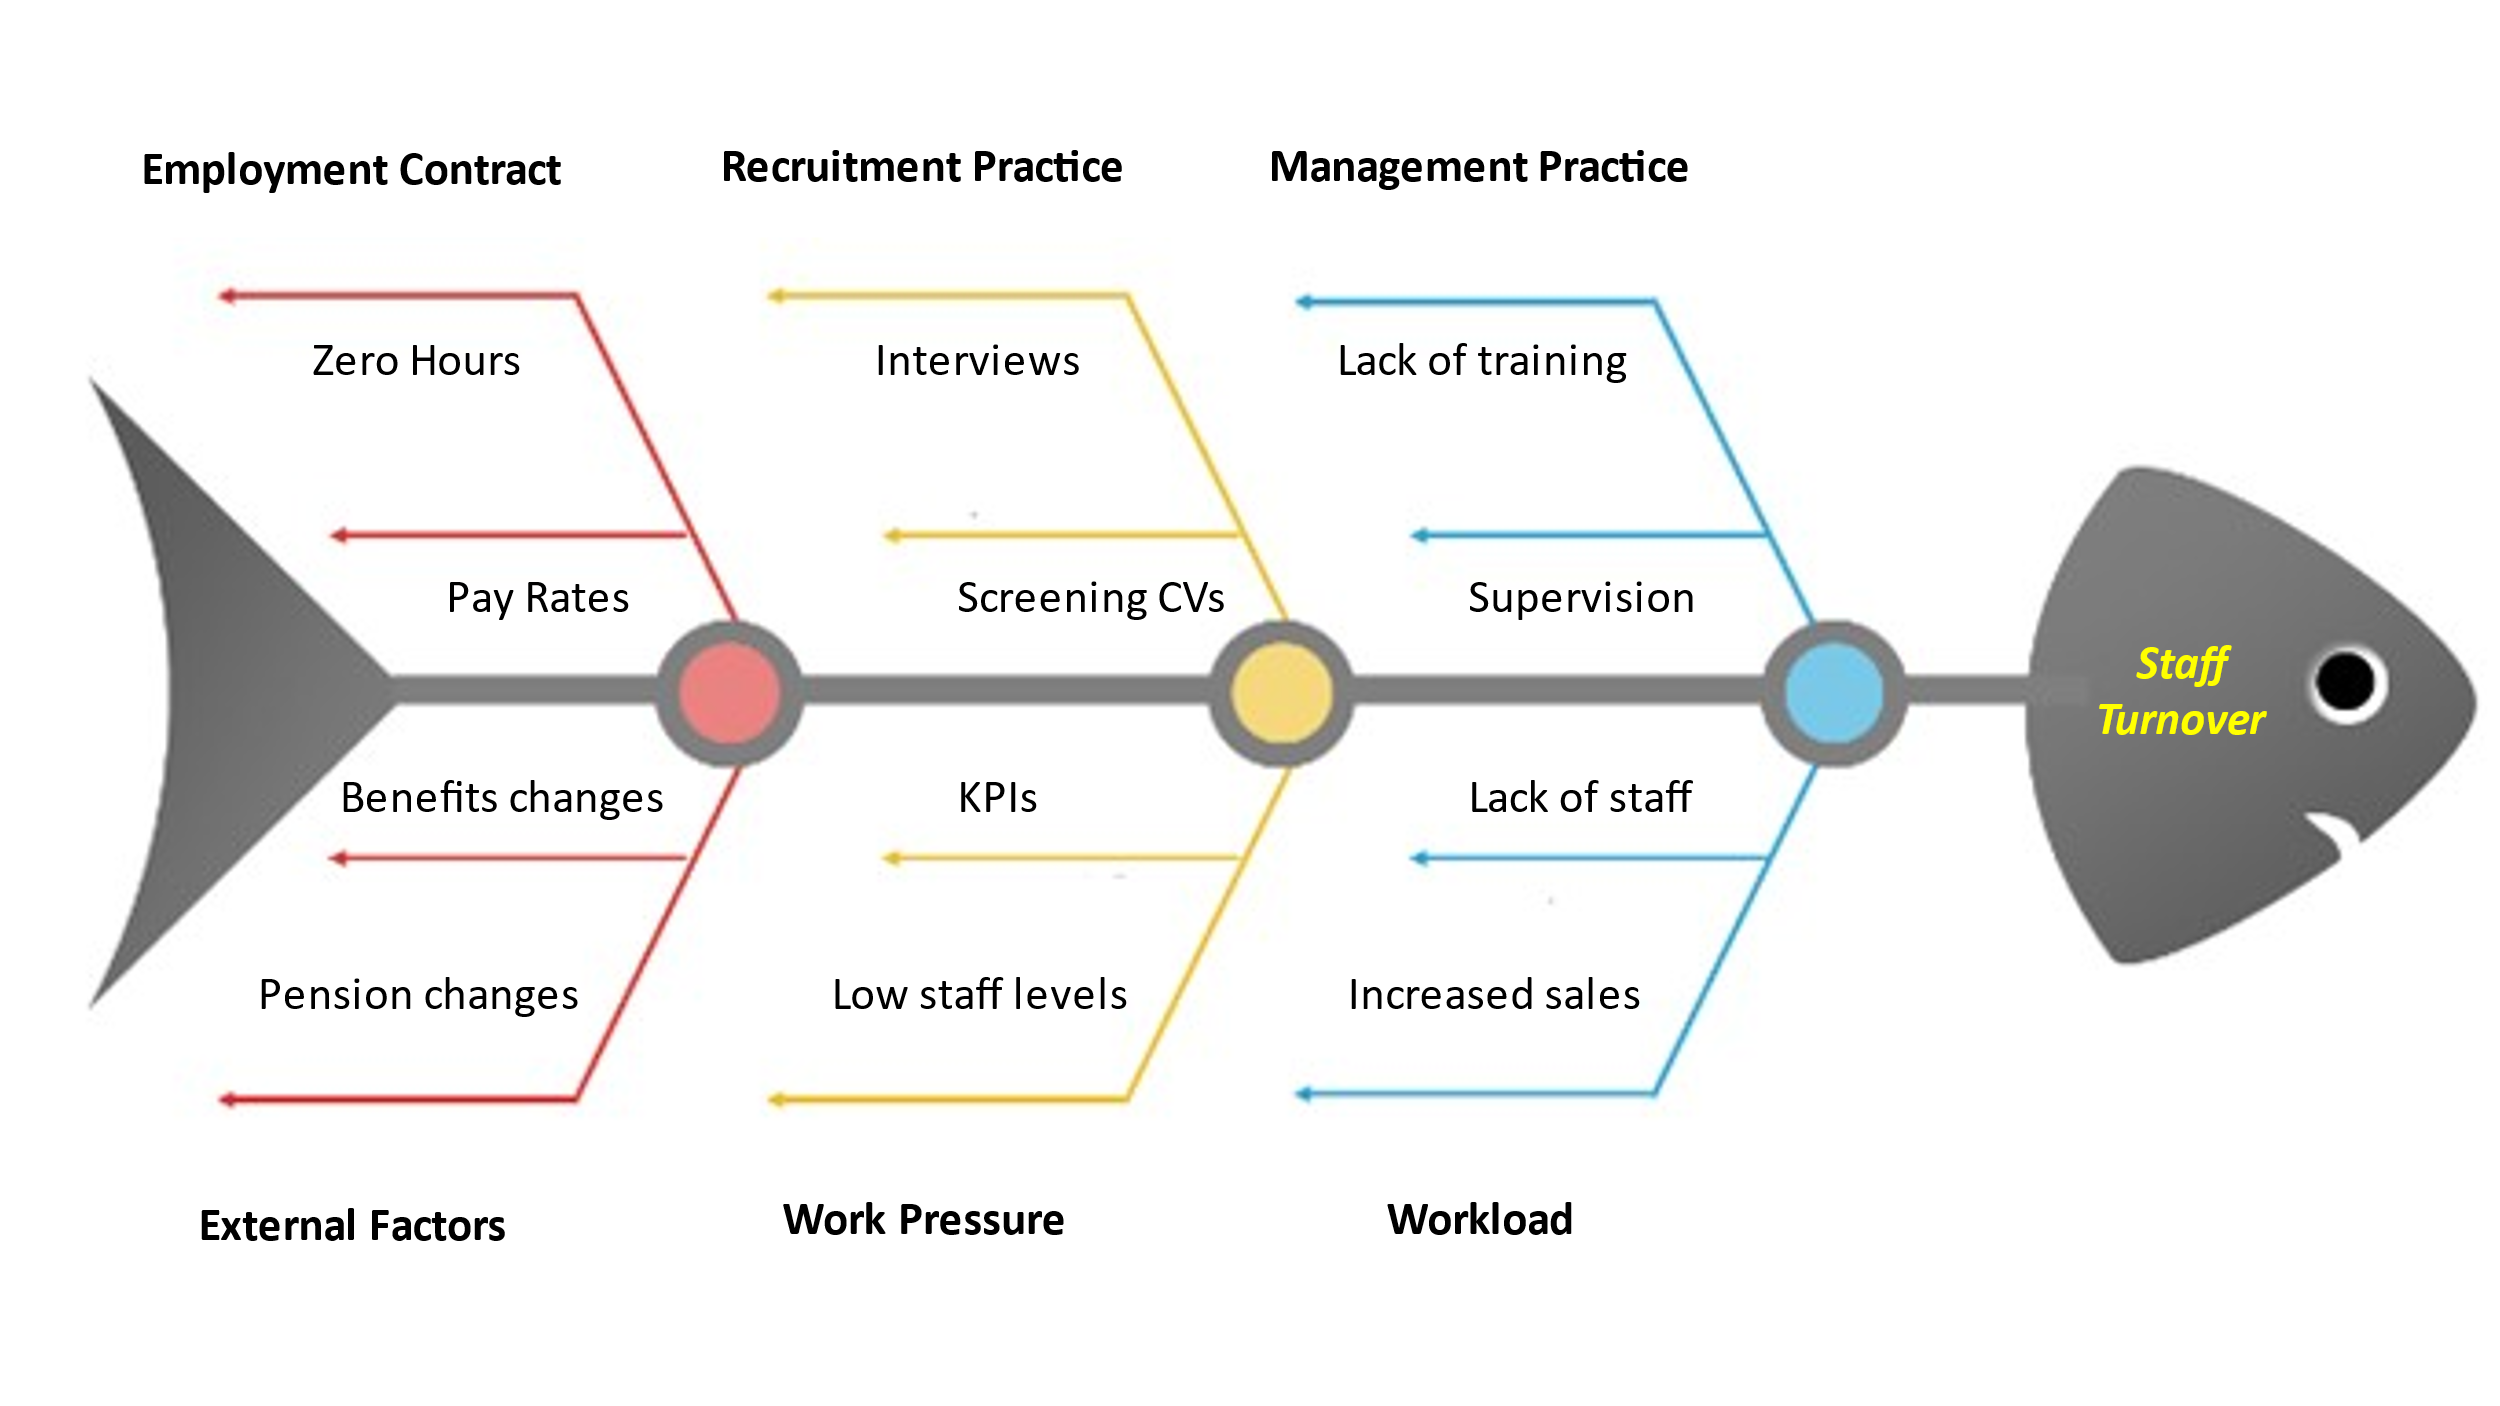
Course Exercise 10 – Root Cause Analysis
Apply your understanding of Human relations, Systems and Work Enjoyment theories to your own context and the data you have collected so far and use it to carry out a Root Cause Analysis on the one part of the business performance your group has been allocated:
• People / Staff satisfaction
• Product
• Quality
• Culture
• Customer Satisfaction
• Financial Performance
• KPI performance

Course Manual 11: Identifying Data Gaps
We use data to guide our management of organisations. The quality and coverage of the data that we have and how we use that data determines how effectively we can manage our organisations. Its like driving a car. Without a speedometer and a fuel gauge we wouldn’t know how far we can drive and how fast we are travelling (and whether we are breaking the speed limit). Similarly our Satnav shows us the route and we are using a system such as Apple Car Play gives us live traffic updates and suggests faster routes. A lot of us wouldn’t dream of leaving home without that quality of information available to us yet we are prepared to run our businesses with much poorer quality information.
It’s also important to distinguish between data and information. They are not necessarily the same thing. Data is a collection of potentially unconnected facts. Information puts those facts into context. There is a whole science to Data Visualisation where analysts put basic data “facts” into context and display them as information in an easy-to-understand way. Gone are the days when everything was just displayed as a table or histogram.
Modern in-car navigation systems benefit from many years of development and billions of pounds worth of investment by the big players in the market. In most cases they have been able to reduce the production and display of data to a repeatable process without human intervention. You don’t load the destinations into you satellite navigation system you look them up in Google (or Siri looks them up for you) and they are then automatically pushed to the Navigation system. The information you need is then automatically displayed.
To achieve that seamless level of integration the various companies involved have identified the data points (facts) that they need and agreed standard ways that the information can be exchanged. So Google Maps on Apple Car Play will perform in the same way whether you have a Mini or Mercedes.
As organisations we need to go through a similar process when identifying our information needs. First we need to work out what we want to know about, then we need to identify the facts required to provide that understanding. At some point a data dictionary will need to be established and within that will be a list of the facts that we have in our armoury and those that we would like to have.
We then going through the process of working out how to fill in the gaps. We also need to think about how often we are going to need to collect those facts. Is it just once a year or do we need them every day or hour or minute? The time factor defines how we go about collecting the information. Where information is required on a frequent basis it makes sense to automate the collection of that information if possible. Its important to have a repeatable process that is calibrated. The speedometer in your car provides information automatically every second and is calibrated when it leaves the factory so all cars at 20mph on the speedometer are doing 20mph. So we can be confident that if we drive any car at 30mph past a speed camera in a 30mph zone we won’t be breaking the law. That accuracy of information is only possible because the manufacturer has a developed a repeatable process for collecting the required data, calibrating the information and displaying it to the end user. Your car updates the speedometer every second, so the process needs to be automated.
Speed in the nautical context is measured in knots. Back in the days of sailing ships speed was measured using a device called a log. A log is basically a long piece of string with knots at regular intervals in it and a disk of wood at the end. The sailor threw the string over the side and measured how many knots were pulled through their fingers in a given period of time, hence the speed in knots.
Obviously with that method you can measure the speed of a relatively slow-moving object infrequently and with a limited accuracy, but something moving faster or where the reading needs to be taken more frequently a different method will be required so mechanical/ electronic/ automated means of calculating speed are adopted.
We need to think about our business information needs in the same way. What do we need and how often?
Once we have worked out what and how often we can start to think about the most effective collection method for a particular aspect of the interest. As we have already seen collecting information is not always straightforward. There are a number of ways that the information we collect may not reflect reality. We need to think about how we are you going to determine whether the information we collected is accurate and representative of the information domain.
Coming back to the satellite navigation example. One key aspect of navigation is that you never rely on a single point of reference to determine your location. You find one location reference then look for another reference point to confirm the location. So, you might be looking at the information on your cars satellite navigation system then searching for signs on the roadside to confirm the information that the system is telling you.
Data collection about a subject area needs to be the same. You need to be looking for multiple sources of information about the same subject. Talk to multiple people about a problem area not just one. Pick the items that you think you can verify in other areas. For instance progress about sales targets can be verified using invoices. So information in a CRM system should correlate to information in an accounting system.
Think about how you will allow you observers to verify the information you have collected.
You need the subject to confirm what you have recorded is an accurate reflection of their understanding of a problem environment. It may not be the same as other people within the same environment but that’s not important you are not making judgement about who is right/wrong at this point. For the subject to be able to verify the information you reflect back to the effectively that information needs to be in a form they understand. You may need to do a level of education or amend the data presentation techniques to match the audience.
Think about how you are going to verify the accuracy of the information you have collected. Is it an up to date set of financial numbers. Are the working hours recorded accurate. Are there hidden costs that are being absorbed in other areas. Do you need to treat particular pieces of information with a pinch of salt. Does the individual you have talked to really have the in-depth information they claim.
The stakeholders you need to engage in order to collect the information. You are going to need access to people and their time. You will need to clear this in advance with the appropriate management chain and the relevant stake holders. The earlier you start that process the more flexibility you will have in the timings for the collection process.
Did he/she really say that? You need to remember that where information from diverse sources is in conflict you may wish to go back and review the information you collected earlier. Contingency time needs building into the plan to allow you to do that.
The resources required to create the information collection resources.
You will need resources to collate the information you collect. That may just be licenses for software so that you can produce process maps but in a larger organisation you may need extra manpower to produce the data analysis artefacts or just to carry out observations. Can you do that all yourself or does it makes more sense to outsource all or part of a task to a third party.
There are dozens of companies that specialise in everything from process mapping to customer interviewing. Do you want to do it yourself or should you produce a brief that you hand to a skilled third party to execute.
You want to collect a 360 degree understanding of a problem domain. That is going to require discussions with everyone involved in the customer journey including both existing and prospective customers. Think about how you will identify and communicate with those customers who choose not to buy as well; there rational can be as interesting

The timing for the collection activity
People take holidays, businesses have busy periods. You need to have a basic understanding of how the business works so that you can access to the required resources when you are available. There will be an optimal sequence for collecting the information you require. Planning using a software tool such as Microsoft Project will give you the critical path for your data collection activity.
The success criteria
How will you definite if your data collection process is a success? Think about what success looks like. Have you covered the whole scope of your problem area. Are there any subjects that you have not been able to cover in sufficient detail. Do you have mitigation strategies in place that will allow you cover the lack of information; revisits to subjects; alternative sources of information and so forth.
Course Exercise 11 – Identifying Data Gaps
In your group look at the data that has been collected against the original requirements and using the info from the benchmarking, SWOT, PESTLE and root cause to identify what data still needs to be collected by next workshop to give a full picture of current performance
Group 1 – People, Processes, Technology, Systems
Group 2 – Management, Product, Quality, Culture
Group 3 – Customer Reviews, Financial Performance, Staff Satisfaction
Group 4 – Staff Performance, KPIs, Business Culture, Comparative Performance

Course Manual 12: Systems Architecture Plans
Technology has become a key factor in allowing businesses to achieve a relative competitive advantage within their market. The business with the best IT systems and use of data will generally over time achieve market dominance.
To succeed business leaders, need to understand a basic level how technology and data works. They may not be able to write code, but they do need to be able to engage in the strategic discussions with IT leaders. The quality of the solutions developed and deployed will depend on the way dialog between the two parties involves.
To have that effective dialog business leaders need to have a basic understanding of how software and system architecture work. They also need to understand the why as well as the how. That will enable them to make the correct choices around architecture and what the developed business solutions are capable of.
Modern computer systems are on the face of it increasingly complex. But in essence its about bringing together a reasonably homogenous set of techniques, processes and technologies to make a larger system architecture.
One of the most important developments over the last 20 years has been the acceptance of the design pattern. Design Patterns are effectively reusable templates for putting systems together. The vast majority of companies have core systems that effectively do the same thing. Most companies have CRM, Accounting, Email and File management. Specialisation will then occur at the business sector level. This consistency of business processes between organisations has driven the evolution of cloud based computing and software as a service. You don’t build your own accounting system you pick which cloud accounting package you will use whether its Xero, Sage, Quickbooks or something similar. A high proportion of the average business systems should be of this type of form lets say 90% of the processing capacity. The remainder will be specific to the business itself. That 10% however is likely to consume significantly more than 10% of the organisations spend on IT.
The competitive advantage comes from the way that these systems are combined and how effectively the information within the system can be leveraged. It’s all about the way that the information is combined and organised.
There are two key organization concepts: software architecture and system architecture.
Software architecture refers to the logical organization of a distributed system into software components; how we put the homogeneous components together. Instead of one big monolithic application, distributed systems are broken down into multiple components. The way in which these components are broken down impacts everything from system performance to reliability to response latency.
System architecture refers to the placement of these software components on physical machines. Two closely related components can be co-located or placed on different machines. The location of components will also impact performance and reliability.
The resulting architectural style ultimately determines how components are connected, data is exchanged, and how they all work together as a coherent system.
System architecture is a conceptual model that defines the structure, behaviour, and rationale of a system. The architecture plan is a formal description organized in a way that aids understanding of the important structures and behaviours within the system.
Components and subsystems for instance; software applications, network devices, hardware, and even other machinery related to the system are included in scope. It will use an Architecture Description Language (ADL) to describe the entire system.
This is a very broad topic. System architecture can be broadly categorized into centralized and decentralized architectural organizations. Generally system architectures are in layers. The lowest level of granularity might be individual modules within applications. At the top level the plan might be very abstract just showing the relationships between individual subsystems.
System architecture activities are used to define a complete solution using a set of principles, concepts, and properties that logically relate to each other. The features of the solution architecture should have characteristics that satisfy as far as possible, the problem defined in the system requirements. Those in turn should relate back to the business and stakeholder requirements. Though in some instances they may be driven by technology aspects for instance, operational or support needs that are implemented through technology; mechanics, electronics, hydraulics, software, services, procedures, human activity.
System Architecture activity is by its nature abstract and conceptual with a global scope focused to achieve the mission and life cycle concepts of the system. Whilst it addresses the architectural principles, concepts, properties, and characteristics of the system-of-interest it may also be applied to more than one system. Standardisation of approaches and terminology is desirable across organisations using design patterns or standards driven technologies.
Generally, interpretations of system architecture are based on the intangible idea of structure (i.e. relationships between elements). Some authors limit the types of structure considered to be architectural; for example, restricting themselves to functional and physical structure. Recent practice has extended consideration to include behavioural, temporal and other dimensions of structure.
The aim of the approach is to progress from system requirements (representing the problem from a supplier/designer point of view, as independent of technology as possible) through an intermediate model of logical architecture to allocate the elements of the logical architecture model to system elements of candidate physical architecture models.
System requirements and logical architecture models have many common components. Both organized along functional lines deliberately independently of the implementation design. Some methods combine the two into a single model with multiple simultaneous views.
Engineers and architects combine mathematical principles and heuristics to create models of the things that they will build. Heuristics are lessons learned through experience, but not mathematically proven. However where an issue is identified and defined through system requirements, principles and heuristics may or may not be able to directly address it.
The principles and heuristics used in system views or models can be classified according to the domains in which those system views or models are used.
Static domain describes a physical structure or organization of a system that can be broken down into systems and system elements. It deals with partitioning systems, system elements, and physical interfaces.
Dynamic domain relates to logical architecture models, particularly to the representation of the behaviour of the system. It includes a description of functions, transformations of input flows into output flows and interactions. It will also describe the interactions between the functions of the system and any external objects or systems.
Systems architecture models are often event driven describing the events that launch or stop the processing within the system. Information about scale and performance will also be recorded, how many transactions per hour or users concurrently on the system.
Temporal domain describes time related requirements for the functions of the system. This talks the timing of activities within the system. Activities can be synchronous or asynchronous. Much processing or activity will be queue based on asynchronous.
The environmental domain relates to the enablers production, logistics support, and so forth, but also considers factors related to business continuity.
Design decisions are made, and technological solutions selected based on performance criteria and other non-functional requirements. Intermediate models, such as logical architecture models, allow us to validate the functional, behavioural, and temporal domain properties of the system against the system requirements. These can be done without questioning the logical functioning of the system it’s a question of abstracting the why we are doing something from the how are we doing something and recognise that’s there are multiple routes to the same result.
Course Exercise 12 – Systems Architecture Plans
Work with your project team colleagues to begin investigating what IT systems sit where in your organisation. Think about:
• Hardware
• Software
• Data
This work needs to be completed by workshop 5.
Project Studies

NEED CLEARER IMAGE FOR PROJECT STUDY IMAGE 1
By the second workshop, we expect your initial data collection to be complete, and for you to be able to deliver a succinct 10 minute presentation at the start of the second to the workshop setting out what the data tells you about the current performance situation in your organisation.
Your analysis will include the following aspects of the business and how each aspect of the business functions:
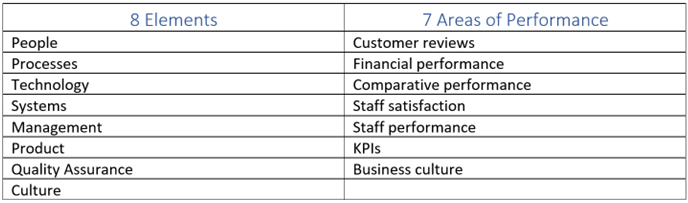
By the end of the first workshop you will need to collate the findings from each of the groups in the first workshop for these topics to capture the organisations thoughts:
• SWOT
• PESTLE
• Missing Data
• Data Quality issues
• Barriers to improving the quality of the data
• Internal and external benchmarks
• Barriers to adopting quantitative management by area of the business
• Root Cause Analysis
• Data to still be collected
From this idea collation you will need to update your data collection plan, using SMART targets, and then make sure you fully implement your plan in good time.
While the bulk of this task is to be completed as a Project Team, complete your own individual analysis of the data, and submit this as your Project Study. Use the information gleaned from the workshop exercises to provide context for your analysis. Use the analysis to present your own conclusions concerning current business performance, and ideas for future development focus.
To prepare for the second workshop you have these tasks:
• Collate the thoughts from the first workshop and use these to inform your data collection plan
• Update your Data Collection Plan
• Put together a 10-minute presentation setting out what the data tells you about the current performance situation in your organisation
• Collectively arrange a meeting with representatives from the Senior Leadership to make enquiries regarding:
– The vision and mission of the organisation
– The organisations’ view concerning if staff should be aiming for good or excellent performance
Program Benefits
Management
- Performance improvement
- Stakeholder management
- High performance
- Iterative evaluation
- Informed decisions
- improved sustainability
- Enhanced reputation
- Business analysis
- Problem definition
- Targeted solutions
Technology
- Process improvement
- Innovation
- Product innovation
- Service improvement
- Streamlining
- Continuous improvement
- Agile
- Quality data
- Developing expertise
- Digital transformation
Human Resources
- Achieving excellence
- Employee ownership
- Customer experience
- Talent retention
- Team building
- Empowering staff
- Strategic engagement
- Performance mindset
- Lifelong learning
- Emotional intelligence
Client Telephone Conference (CTC)
If you have any questions or if you would like to arrange a Client Telephone Conference (CTC) to discuss this particular Unique Consulting Service Proposition (UCSP) in more detail, please CLICK HERE.