
Clinical Process Improvement Program
Corporate Training Program

The Appleton Greene Corporate Training Program (CTP) for Clinical Process Improvement is provided by Professor Zimpfer MD MBA Certified Learning Provider (CLP). Program Specifications: Monthly cost USD$2,500.00; Monthly Workshops 6 hours; Monthly Support 4 hours; Program Duration 12 months; Program orders subject to ongoing availability.

Personal Profile 

Professor Zimpfer MD MBA is an approved Certified Learning Provider (CLP) at Appleton Greene and he has experience in customer service, operations and management. After having been trained as a research oriented medical doctor at Harvard medical school, he is professor and chairman at the Vienna General Hospital, medical university of Vienna, appointed to develop a world class facility with regards to patient care, teaching and research yielding a respectable bunch of top medical careers of his former fellows. As a medical court expert he has been consulted to deal with about 150 national and international cases, he also has achieved an MBA, University of Chicago. His personal education, with the aim of organizational excellence, strategy and patient experience, also included programmes at Harvard business school, Wharton, Cleveland and Massachusetts institute of technology. He has industry experience within the following sectors: Healthcare; Education; Pharmaceutical; Biotechnology and Manufacturing. E.g., serving as chairman of the board of a renowned private hospital and nursing training facility that has been exposed to financial difficulties, by supporting strategy and clinical advice, in a gentle way, he was able to achieve a full turnaround. He has had commercial experience within the following countries: Austria; United States of America and United Kingdom, or more specifically within the following cities: Vienna AT; London UK; Boston MA; Washington DC; New York NY. Being awarded a series of fellowships and grants himself, he launched a foundation that was able to support a series of colleagues by means of fellowships and to help establish emerging medical technologies. Decorated for services to the Republic of Austria – Grand Medal of Honour. Fluent in English and German. His service skills incorporate: clinical process improvement; program development; medical teaching; leading physician; certified expert and court witness.
To request further information about Professor Zimpfer through Appleton Greene, please Click Here.

(CLP) Programs

Appleton Greene corporate training programs are all process-driven. They are used as vehicles to implement tangible business processes within clients’ organizations, together with training, support and facilitation during the use of these processes. Corporate training programs are therefore implemented over a sustainable period of time, that is to say, between 1 year (incorporating 12 monthly workshops), and 4 years (incorporating 48 monthly workshops). Your program information guide will specify how long each program takes to complete. Each monthly workshop takes 6 hours to implement and can be undertaken either on the client’s premises, an Appleton Greene serviced office, or online via the internet. This enables clients to implement each part of their business process, before moving onto the next stage of the program and enables employees to plan their study time around their current work commitments. The result is far greater program benefit, over a more sustainable period of time and a significantly improved return on investment.

Appleton Greene uses standard and bespoke corporate training programs as vessels to transfer business process improvement knowledge into the heart of our clients’ organizations. Each individual program focuses upon the implementation of a specific business process, which enables clients to easily quantify their return on investment. There are hundreds of established Appleton Greene corporate training products now available to clients within customer services, e-business, finance, globalization, human resources, information technology, legal, management, marketing and production. It does not matter whether a client’s employees are located within one office, or an unlimited number of international offices, we can still bring them together to learn and implement specific business processes collectively. Our approach to global localization enables us to provide clients with a truly international service with that all important personal touch. Appleton Greene corporate training programs can be provided virtually or locally and they are all unique in that they individually focus upon a specific business function. All (CLP) programs are implemented over a sustainable period of time, usually between 1-4 years, incorporating 12-48 monthly workshops and professional support is consistently provided during this time by qualified learning providers and where appropriate, by Accredited Consultants.
Executive summary

Clinical Process Improvement – Augmented Reality
Healthcare is an industry that affects everyone, but one that has historically had a reputation for less-than-positive customer experiences. However, customer experience is now becoming a focus of many healthcare companies and clinics. This is aided by new approaches and technology that have the power to transform healthcare. Here are five top trends for healthcare customer experience for 2019 and beyond.
Augmented Reality Training For Healthcare
Augmented reality is a trend across all industries, but it is especially powerful in the healthcare field. One of the strongest applications is in medical training. Using AR, healthcare providers can see diagnoses and procedures right in front of them to learn new skills and expand their knowledge. Augmented reality also makes it possible to train more providers at once, which could fight the shortage of trained professionals around the world. Imagine a doctor being able to have treatment options pop up on a screen as he looks at different conditions or have growth charts appear around a child during a checkup. Instead of doctors having to spend more time reading studies to refine their skills, the information they need can simply appear in front of them as they seamlessly treat patients.
Leveraging Data For Healthcare
Healthcare has always used data, but new types of data and ways of collecting it will impact customer experience. Automated systems can comb through huge amounts of data in real time to provide the best patient experience. Healthcare data comes in many forms, from post-visit feedback surveys to numbers of what days and times are the busiest so clinics can properly staff their offices. Data can predict when a patient will get sick so that preventative action can be taken, create personalized healthcare plans, and potentially limit the spread of diseases before they grow out of control. It also allows providers to have a more complete view of each patient, which can potentially remove the pre-visit intake questionnaires, which customers say is the most frustrating aspect of healthcare.
Patient Personalization
Customers today don’t have time to be sick, and they don’t want to wait around for services they don’t need. With the growth of data comes the ability to personalize the healthcare experience. Starting today and growing in the future, healthcare offices will be able to create a completely personalized experience for each customer. Instead of everyone being treated the same, clinics will be able to use data to see what doctors a patient prefers, if they like being seen in person or remotely, their health history, and any potential health issues. That means that instead of having to navigate through a complicated web of healthcare representatives, a patient’s information will be easily accessible so the right treatment options, preventative care, and recommendations can be made.
Using Wearable Devices In Healthcare
Wearable devices are powerful tools to keep patients involved and invested in their personal health. The most frequent users of wearable devices are people who are less healthy than average and more likely to need to be hospitalized. Devices like activity trackers help customers stay more active and healthier on their own, which can decrease their need to see a doctor, while more advanced devices can monitor patient health metrics such as blood pressure, heart rate, and diet on the go. Instead of having to go to a clinic for monitoring, patients can do it at home and always be connected to a doctor. If a monitored patient’s blood pressure spikes, the doctor can receive a notification and take action. Wearable devices are a less invasive way to still get great care.
Hospitals Using Smart Technology
Advances in technology have created a new wave of products to improve patient comfort and care. Using connectivity and automation, these tools alleviate some of the pressure on healthcare providers and once again put customers in control. An overwhelming 94% of healthcare executives said in a recent survey that they plan to implement smart technology in their organizations. Smart technology comes in a variety of forms to increase comfort and efficiency and decrease risks. Hospitals around the country have started using smart beds that self-adjust to the correct pressure and support for each patient’s preferences and condition. Other clinics are using robots that can monitor a patient without a human provider being in the room. Smart devices and applications will continue to grow and spread throughout the healthcare field.
Blake Morgan is a customer experience keynote speaker, author of More is More and futurist.

Clinical Process Improvement – The Innovator’s Prescription
The Innovator’s Prescription (published by McGraw-Hill) argues that disruptive innovation is required to make health care affordable. In this excerpt, the authors look into the ways disruption can help hospitals, which in our current health care system are tasked with the impossible job of doing everything well and keeping costs down at the same time.
In order to understand how to “fix” hospitals, first it’s important to understand the value proposition of hospitals. Hospitals have become the workshops within which physicians could be trained and practice their intuitive craft, clinical laboratories where complex medical cases could be solved and unanticipated emergencies and complications could be resolved with as much certainty as possible. This value proposition has been a great fit for solving poorly understood problems of the past, such as tuberculosis in the early 1900s, poliomyelitis in the 1950s and AIDS in the 1980s. When these diseases were first encountered, they had to be addressed in hospitals. However, in terms of the complexity of diagnosing and treating disease, for a century hospitals have been on a relentless upmarket march on the trajectory of sustaining innovation.
An administrator in one of the major Boston-area teaching hospitals estimated for us that 70% of the patients in his hospital today would have been in the intensive care unit 30 years ago, and that 70% of the patients in his intensive care unit today would likely have been dead 30 years ago. His hospital has become extraordinarily capable of dealing with very complicated problems. But in the process of adding all of that capability and its attendant costs, the hospital has overshot what patients with straightforward disorders can utilize when they are admitted. An important lesson from our studies of disruptive innovation is that the hospitals providing much of today’s health care cannot, and therefore ought not, be relied upon to transform the cost and accessibility of health care. Instead, hospitals need to be disrupted. We need them to cede market share to disruptive business models, patient by patient, disease by disease starting at the simplest end of the spectrum of disorders that they now serve.
The Business Model of Hospitals
Why are hospitals so costly? The answer lies in an examination of their business model. Every viable business model starts with a value proposition–a product or service that helps customers do more effectively, affordably and conveniently a job that they’ve been trying to do. “We will do everything for everybody” has never been a viable value proposition for any successful business model that we know of–and yet that’s the value proposition managers and directors of general hospitals feel they are obligated to put forth. A company might want to be all things to all people, but this isn’t what customers need. There are few patients who are searching to “hire” a health care provider that can do everything for everyone else. Rather, customers of health care delivery generally find themselves needing one of two jobs done. The first might be summarized as, “I need to know what the problem is, what is causing it and what I can do to correct it.” The second job would be, “Now that I know what needs to be done to fix my problem, I need it to be done effectively, affordably and conveniently.” Delivering a value proposition to do the first job requires a solution-shop business model organized around intuitive diagnostic activities; the second job requires a value-adding process business model organized around the efficient delivery of specific procedures.
We know of no business that has successfully housed two fundamentally different business models within the same operating unit. Were it not for today’s tangled web of subsidies, administered prices and regulations that constrain competition, today’s general hospitals would not be economically or competitively viable.
Problems Created by Commingling Business Models
When the same hospital seeks to fulfill these two very different value propositions, the consequent mandate for two types of business models creates extraordinary internal incoherence. The resources and the essential nature of the processes inherent in the two business models are different. Their profit formulas are different as well. Solution shops need to get paid on a fee-for-service basis. Their fees cannot be based on outcomes, because many factors beyond the accuracy of diagnosis affect the results. In contrast, value-adding process businesses can routinely sell their outputs for a fixed price, and they can guarantee their results. Many market-oriented students of our health care systems bewail the fact that hospitals and physicians don’t readily disclose the prices of what they do, or the outcomes they achieve. The value of the services being offered therefore isn’t measured–and as a result, the normal market mechanisms that drive performance, efficiency and customer-centeredness don’t exist in our health care systems. What these critics have not yet understood, however, is that the value actually cannot be measured, because the metrics of value in the two different business models are so different.
The value of products and services can only be calculated by comparing their prices and expected outcomes, relative to the job to be done, but the jobs for which the solution shops and value-adding process services of hospitals are “hired” to do are very different. Meanwhile, reimbursement formulas typically price both types of hospital services on a fee-for-service basis, with overhead costs spread across them in highly distorted ways. The result is that the value of what general hospitals do simply cannot be measured–let alone compared.
Recommendations for Hospitals
Our first recommendation is that hospitals need to deconstruct their activities operationally into the two different business models: solution shops and value-adding process activities. This can be done by creating hospitals-within-a-hospital, or by building distinct facilities. In either case, the work done within each business model must be organized differently, and their cost accounting and pricing systems must be separated and structured in ways appropriate to each. Our biggest and best medical centers will be able to bifurcate themselves. Smaller hospitals, however, will need to focus on becoming solution shops or value-adding process hospitals, or simply expect to be liquidated through disruption. The reason why this division is such a crucial first step is because of the two different jobs-to-be done for general hospitals. Only when an organization’s resources, processes and profit model are focused around a job-to-be-done can they be integrated in a correct and optimized way that does the job as perfectly as possible. Dividing hospitals into solution shop hospitals and value-adding process hospitals ensures that each type of hospital can be integrated in a way that gets its particular job done most effectively.
Solution Shop Hospitals
The typical general hospital’s solution shop is set up to tackle any disorder in any part or system within the body. To deliver on this promise, a good general hospital must have one of every type of diagnostic equipment and at least one physician from every sub-specialty on staff. The capability to address such problems cannot reside in standardized processes. Rather, it is largely resident in the hospital’s resources–the intuition, training and experience of the people who practice there and the equipment at their disposal. Indeed, these individual pieces of equipment and the individual specialist physicians must be kept separate, not tightly linked by processes, in order to have the flexibility to do anything for anybody. A friend of ours has suffered from asthma for much of his life. Each specialist he saw seemed to have another possible remedy. It got to the point that he was taking multiple medications with multiple side effects, whose combined cost at one point exceeded $1,000 per month–yet he was still not well. Then he visited the National Jewish Medical and Research Center in Denver. National Jewish is a solution shop focused on pulmonary disease, particularly asthma. National Jewish is integrated in an optimal way to diagnose the root cause and prescribe the best possible course of therapy, for disorders of the respiratory system. When our friend arrived, they administered a unique battery of tests, then assembled an allergist, a pulmonologist and an otolaryngologist–also known as an ear, nose and throat, or ENT, specialist–to meet with him. They integrated their perspectives on his long medical history together with the test results, told him what was causing his symptoms and prescribed a straightforward course of therapy that finally solved his problem.
In the general hospital systems in which our friend previously sought solutions, each of these specialists existed. But they weren’t integrated in the right way. He had seen each of them individually and was passed from one individual specialist to the next. Indeed, the individuals he saw were typically trying to participate in both the solution shop and value-adding process business models in their hospitals. What these disjointed general hospital solution shops had been unable to do, a coherently integrated solution shop could readily do. Why? A key reason diseases remain in the realm of intuitive medicine is that they arise at the interdependent intersection of two or more systems of the body. Studying the disease from the perspective of only one of those systems, therefore, can’t develop an integrated solution consonant with the integrated nature of the disease. The Texas Heart Institute is a focused solution shop for cardiovascular disease. The Cleveland Clinic has created “institutes” within the clinic that are focused solution shops. One is a heart and vascular institute. Another is a neurological institute populated by neurosurgeons, neurologists, psychiatrists, and others whose work processes are integrated together in a way that optimizes diagnosis and therapeutic recommendations.
The Mayo Clinic is similarly organized. Patients there are processed through solution shops whose specialists, equipment, and procedures are knitted together across each of the potentially relevant organ system specialties, in order to provide the best possible diagnosis as fast and at as low a cost as possible. Once the diagnosis and recommendations have been made, they tell their patients, in essence (and using our language), “Now this is what needs to be done. You can go over there to our value-adding process organization to have it done, where we’ll charge you on a fee-for-outcome basis. Or you can return to your hometown and have it done there. Your choice.” Isn’t it too expensive for the average patient to travel to these distant solution shops? No. It’s cheap. Two thousand dollars for our friend to travel to Denver was a pittance to the system, compared to thousands of dollars spent on the wrong prescription drugs and devices that were the result of inaccurate, incomplete diagnoses by a stream of individually operating specialists. An accurate diagnosis ensures that you don’t waste money and lives solving the wrong problem.
We believe that, ultimately, focused solution shops will be able to bill fee-for-service rates that cover not just the full cost of their services, but also begin to reflect the value of their work. Current reimbursement formulas constrain and distort this at present. Are value-adding process clinics good or bad for health care? The “specialty vs. general” categorization scheme is a faulty distinction that leads to serious misunderstanding and miss-measurement. Some specialty hospitals such as National Jewish, noted earlier, are coherent solution shops. Their focus allows them to put processes into place that integrate the work of multiple specialists in a way that optimizes delivery of the value proposition. Because the care is still the realm of intuitive medicine, and because feedback from treatment decisions is essential to the learning that takes place, diagnosis and therapy in these institutions must be one and the same. The organizational structure of coherent solution shops like National Jewish makes it possible for the patient to be in the care of a true team. On the other hand, the organizational structure of the typical general hospital, with its separate departments of specialty care, typically leaves patients in the care of individuals–often several individuals passing the patient from one to another–since the current structure makes working together and coordinating care cumbersome.
Other specialty hospitals are value-adding process hospitals. These include surgery centers, both inpatient and ambulatory. Some of these do many types of surgery, while others specialize in a specific type. For example, the Shouldice Hospital, north of Toronto, repairs only external abdominal wall hernias. The Aravind Hospitals in India do eye surgery, and the Coxa Hospital in Finland focuses on hip and knee replacement surgery. Meanwhile, the Cancer Treatment Centers of America offer treatment for dozens of cancer types, even integrating complementary and alternative treatments not typically offered at traditional hospitals but all in a value-adding process model aimed at following the diagnosis of cancer made elsewhere. Just as solution shops focused on a job can integrate in ways that optimize their effectiveness, VAP hospitals, because they focus on a job, can integrate in optimal ways as well. Because they can optimally integrate the entire process–from pre-admission preparation to the surgery process to rehabilitation to discharge–value-adding process hospitals can do their work at substantially reduced cost, with much higher levels of quality.
A hernia repair at the privately owned, for-profit Shouldice Hospital, for example, entails a four-day visit for preparation, surgery and rehabilitation in a truly country-club-like setting. In the typical U.S. general hospital, this procedure is done on an outpatient basis. Yet the entire cost at Shouldice is still 30% lower than CPT #49560, the standard reimbursement given for comparable hernia repair in the United States. In the typical U.S. hospital, unanticipated complications that necessitate additional surgical intervention arise in 5% to 10% of cases. At Shouldice, complications arise only 0.5% of the time. The Coxa Hospital for Joint Replacement in Tampere, Finland, achieves similarly better costs than general hospitals. The 64 general hospitals in Finland that perform similar surgeries average unanticipated complication rates of 10% to 12%; the rate at Coxa is 0.1%. These differences are not simply attributable to intrinsically better and worse doctors; it’s in the nature of the integration enabled by a value proposition that focuses on a specific job to be done. Doctors at Shouldice, Coxa, and other focused value-adding process hospitals may get better at doing certain procedures by doing them over and over, but everything within these institutions is optimized for a focused job.
A Question of Focus
One of the things Toyota taught the world is that, if we do a task differently every time, it’s very hard to improve the result. It’s when we standardize that we’re able to continuously improve and respond to unanticipated problems in predictably effective ways. This is why focused VAP clinics get so good. Two “Yeah, but” objections are frequently leveled against arguments for focus. The first is that the kinds of focused solution shop and value-adding process hospitals described here can’t handle emergencies and complications of their work–and that to be truly effective, they should be backed up with an emergency department and the full arsenal of a general hospital. It’s interesting that the medical establishment long ago became comfortable with the idea that it’s OK for many community hospitals not to offer the full extent of services and expertise as some of their larger brethren. But this is rarely used as an argument against the existence of community hospitals. We accept that these hospitals may not offer the full arsenal because patients who need more sophisticated care can be rushed to a tertiary care hospital. There’s little reason why similar transfers and referrals couldn’t be made from focused hospitals as well.
The second objection is that specialty hospitals and other value-adding process businesses are accused of “cherry picking” or “cream skimming” the youngest, healthiest and most profitable patients, while the sickest patients typically go to the general hospitals. To this we say, “Of course.” Patients whose multiple, interdependent illnesses ensconce them solidly in the realm of intuitive medicine need the broad and unstructured arsenal of capability that only the best tertiary care hospitals can offer. We will always need such hospitals. But because much of what is done within them today can be done elsewhere much more effectively and at much lower cost, we just don’t need as many of them. The finger pointing we have seen from general hospital executives is rooted in a faulty cost accounting and reimbursement system that maintains the commingling of business models through cross-subsidization. General hospitals ought to get paid much more than they’re paid today for the complex, intuitive work that only they can do. If the business model of general hospitals today can be separated into its component value propositions with distinct business models of care delivery, and the payment system properly rewards each for their work, what seems to be cherry picking today will in reality be recognized as the efficient distribution of resources.
Clayton M. Christensen & Michael E. Raynor
The Innovator‘s Solution – Creating and sustaining successful growth
Harvard Business Review Press, 2003, 978-1-57851-852-4

Clinical Process Improvement – Re-defining Healthcare
The U.S. health care system is facing major challenges. At stake are the quality of care for millions of Americans and the financial well-being of individuals and employers squeezed by skyrocketing premiums–not to mention the stability of state and federal government budgets. In Redefining Health Care, internationally renowned strategy expert Michael Porter and innovation expert Elizabeth Teisberg reveal the underlying–and largely overlooked–causes of the problem, and provide a powerful prescription for change. The authors argue that competition currently takes place at the wrong level–among health plans, networks, and hospitals–rather than where it matters most, in the diagnosis, treatment, and prevention of specific health conditions. Participants in the system accumulate bargaining power and shift costs in a zero-sum competition, rather than creating value for patients. Based on an exhaustive study of the U.S. health care system, Redefining Health Care lays out a breakthrough framework for redefining the way competition in health care delivery takes place–and unleashing stunning improvements in quality and efficiency. With specific recommendations for hospitals, doctors, health plans, employers, and policy makers, this book shows how to move health care toward positive-sum competition that delivers lasting benefits for all.
The Paradox of U.S. Health Care The United States has a private system with intense competition But: Costs are high and rising; Services are restricted and fall well short of recommended care; In other services, there is overuse of care; Standards of care often lag and fail to follow accepted benchmarks; Diagnosis errors are common; Preventable treatment errors are common; Huge quality and cost differences persist across providers; Huge quality and cost differences persist across geographic areas; Best practices are slow to spread Innovation is resisted; Competition is not working. How is this state of affairs possible? Competition on the Wrong Things Zero-Sum Competition in U.S. Health Care • Competition to shift costs • Competition to increase bargaining power • Competition to capture patients and restrict choice • Competition to restrict services in order to reduce costs • None of these forms of competition increases value for patients.
Moving to Value-Based Competition Health Plans Provide Health Information and Support to Patients and Physicians: 1. Organize around medical conditions, not geography or administrative functions 2. Develop measures and assemble results information on providers and treatments 3. Actively support provider and treatment choice with information and unbiased counselling 4. Organize information and patient support around the full cycle of care 5. Provide comprehensive disease management and prevention services to all members, even healthy ones Re-structure the Health Plan-Provider Relationship 6. Shift the nature of information sharing with providers 7. Reward provider excellence and value-enhancing innovation for patients 8. Move to single bills for episodes and cycles of care, and single prices 9. Simplify, standardize, and eliminate paperwork and transactions Redefine the Health Plan-Subscriber Relationship 10. Move to multi-year subscriber contracts and shift the nature of plan contracting 11. End cost shifting practices, such as re-underwriting, that erode trust in health plans and breed cynicism 12. Assist in managing members’ medical records.
Employers
Set the goal of increasing health value, not minimizing health benefit costs; Set new expectations for health plans, including self-insured plans; Provide for health plan continuity for employees, rather than plan churning; Enhance provider competition on results; Support and motivate employees to make good health care choices and manage their own health; Find ways to expand insurance coverage and advocate reform of the insurance system; Measure and hold employee benefit staff accountable for the company’s health value received.
Consumers
Participate actively in managing personal health; Expect relevant information and seek advice; Make treatment and provider choices based on excellent results and personal values, not convenience or amenities; Choose a health plan based on value added; Build a long-term relationship with an excellent health plan; Act responsibly Consumers cannot (and should not) be the only drivers.
Roles of Government in Value-Based Competition
Require the collection and dissemination of the risk-adjusted outcome information; Open up value-based competition at the right level; Enable bundled prices and price transparency; Limit or eliminate price discrimination; Develop information technology standards and rules to enable interoperability and information sharing Invest in medical and clinical research.
How Will Redefining Health Care Begin?
It is already happening: Each system participant can take voluntary steps in these directions, and will benefit irrespective of other changes; The changes are mutually reinforcing; Once competition begins working, value improvement will no longer be discretionary or optional; Those organizations that move early will gain major benefits.
Michael E. Porter, Elizabeth Olmsted Teisberg,
Redefining Health Care – Creating value-based competition on results.
Harvard Business Review Press, 2006, ISBN 978-1-59139-778-6

Clinical Process Improvement – Who killed Healthcare
We turn over $2.2 trillion of our money each year to those who manage our healthcare, without holding them accountable for efficiency or quality. Not surprisingly, these folks – hospitals, insurers, governments – they use the money to benefit themselves. Jack Morgan, the insured, middle-class protagonist in Who Killed Health Care? was killed by this system. Insurers, hospitals, and governments have gotten fat on our bloated healthcare costs, which kill the competitiveness of US firms. More than 40 million Americans are uninsured, mostly because they cannot afford it, while 300,000 people die every few years from medical errors. Arrogant insurance bureaucrats deny people the services they paid for, while many insured find their coverage inadequate for serious illnesses. The uninsured – they are charged the highest prices by our allegedly nonprofit, ostensibly “charitable” hospitals and are all too often driven to bankruptcy. Meanwhile, many doctors leave the profession because of insurer, hospital, and government micromanagement of their activities. Physicians enrolled in my MBA courses at the Harvard Business School tell me, “I can no longer practice medicine.” The grip of the powerful status quo also scares off those entrepreneurs who represent the best hope of transforming healthcare. Only 1 stakeholder can fix this – you and me. We must take back our money so we can decide how to spend it. We should be buying health insurance for ourselves, using the foregone salaries and massive taxes we once turned over to the self-serving healthcare industry crew. Switzerland’s consumer-driven healthcare system points the way: With their excellent, private healthcare system, the Swiss have universal coverage and spend 40% less. We are at war for control of an annual $2.2 trillion – an amount equal in size to China’s whole economy. If we do not win it, our health and economy will go down in flames. My new book Who Killed Health Care? details the consumer-driven battle plan that can revive our doctors, our economy, and our good health. That’s my opinion. I’m Professor Regina Herzlinger of the Harvard Business School.
Regina Herzlinger
Who Killed Health Care
McGraw-Hill, 2007, ISBN 978-0-07-148780-1

Clinical Process Improvement – Service Fanatics – how to build superior patient experience the Cleveland Clinic Way
An in-depth case study of Cleveland Clinic’s revolutionary transformation around the customer—a powerful model for any leader seeking to drive positive organizational change although Cleveland Clinic was recognized as having among the best clinical outcomes in the nation, the same was not true regarding patient experience. Service Fanatics shows the specific steps the Clinic took to go from the bottom 10th percentile in Medicare’s survey to above the 90th percentile in less than 10 years. Today, the Clinic is recognized as a thought leader in the emerging field of patient experience. How did they do it? More important, how can others do the same? Service Fanatics explains the strategies and tactics any leader can emulate to turn his or her organization into a patient- and family-centric healthcare delivery model. It also candidly describes the challenges in execution and the solutions leaders can apply. Featuring customer service case studies from other industries and interviews with C-level executives at top corporations, it offers specific lessons per chapter for any manager and business leader beyond healthcare.
James Merlino
Service Fanatics – how to build superior patient experience the Cleveland Clinic Way
McGraw Hil Education, 2015, ISBN 978-0-07-183325-7

Clinical Process Improvement – Communication the Cleveland Clinic Way
The proven strategy for driving patient satisfaction, physician engagement, and better clinical outcomes with improved doctor-patient communication—from the thought leaders at Cleveland Clinic. This book outlines Cleveland Clinic’s pioneering, nationally-recognized REDE to Communicate program, which the legendary hospital system has used to become a world leader in relationship-centered communication. It reveals why the Clinic made effective communication a top strategic priority and how it successfully overcame obstacles to implementing it, including internal resistance from physicians, and adapted it for advanced care providers. This practical guide provides the information decision-makers need to design, develop, and implement communication skills training in their own institutions. Learn how to: Cultivate leadership and clinician support for your new patient experience strategy; Highlight relationships as a foundation for all communication with patients and colleagues using an evidence-based framework, the REDE Model (Relationship: Establishment, Development, and Engagement); Build effective and relevant communication skills programs for experienced physicians, residents, and medical students; Leverage creative communication skills program design and data transparency to engage physicians and advanced care providers form various backgrounds and specialties in patient experience; Identify common misconceptions and myths in healthcare communication and how to respond to them successfully.>/p>
Adrienne Boissy, Timohy Gillighan,
Communication the Cleveland Clinic Way,
McGraw Hill Education, 2016, ISBN 978-0-07-184534-2

Clinical Process Improvement – Marketing Communications
Core Curriculum in Marketing is a series of Readings that cover fundamental concepts in Marketing Management. Readings include Interactive Illustrations which help readers quickly master complex concepts. For classroom use in higher education, this Reading is accompanied by a Teaching Note, test bank, and exhibit slides. This Reading begins with an overview of marketing communications strategy and then presents a framework for designing strategies to optimize consumer engagement. This framework offers managers three broad phases for developing a marketing communications plan: strategic intent, strategic execution, and strategic impact. Crafting such a plan ensures that coordinated and complementary messages are delivered in an integrated marketing communications plan across all consumer touch points. This Reading contains two Interactive Illustrations, “Budgeting for Marketing Communications,” which illustrates the objective-and-task budgeting method with a hierarchy of effects perspective, and “Viral Effect of Marketing,” which explores the likelihood that a shared YouTube video will “go viral.” The Reading also contains links to two video clips, the Taco Bell “Routine Republic” advertisement, a classic example of a conflict-based story, and “Cracking the Code of Super Bowl Ad Effectiveness,” which describes research linking viewers’ brain activity to the emotional connection of effective ads. Please note: this Reading does not cover the complexity of digital marketing. Its influence on marketing communications is covered in greater depth in Core Reading: Digital Marketing (HBP No. 8224), which is a recommended pairing (assignment) with this Reading.
Thales S. Teixeira, Marketing Communications,
Harvard Business School Publishing, 2018
Curriculum
Clinical Process Improvement – Part 1- Year 1
- Part 1 Month 1 Internal Analysis
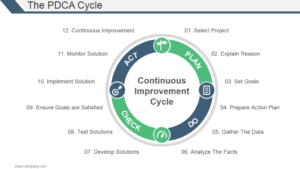
- Part 1 Month 2 Select Project & Explain Reason
- Part 1 Month 3 Set Goals
- Part 1 Month 4 Prepare Action Plan
- Part 1 Month 5 Gather The Data
- Part 1 Month 6 Analyse The Facts
- Part 1 Month 7 Develop Solutions
- Part 1 Month 8 Test Solutions
- Part 1 Month 9 Ensure Goals Are Satisfied
- Part 1 Month 10 Implement Solution
- Part 1 Month 11 Monitor Solution
- Part 1 Month 12 Continuous Improvement
Program Objectives
The following list represents the Key Program Objectives (KPO) for the Appleton Greene Clinical Process Improvement corporate training program.
Clinical Process Improvement – Part 1- Year 1
- Part 1 Month 1 Internal Analysis The first stage of the program is to understand the history, current position and future outlook relating to Clinical Process Improvement, not just for the organization as a whole, but for each individual department, including: customer service; e-business; finance; globalization; human resources; information technology; legal; management; marketing; production; education and logistics. This will be achieved by implementing a process within each department, enabling the head of that department to conduct a detailed and thorough internal analysis to establish the internal strengths and weaknesses and the external opportunities and threats in relation to Clinical Process Improvement and to establish a MOST analysis: Mission; Objectives; Strategies; Tasks, enabling them to be more proactive about the way in which they plan, develop, implement, manage and review (GSCD), within their department. These constitute general departments, which would be appropriate for the majority of healthcare service organizations, but clients can determine their own departments in order to ensure that the program specifically relates to their organization. For example, a typical hospital could incorporate the following 24 departments: Appointments Office/Central Booking; Accident & Emergency; Day Hospital; Day Procedure Unit; Endoscopy; Eye Centre; Hemodialysis Unit; Intensive Therapy Unit; Labor Suite; Physiotherapy; Radiology; Occupational Therapy; Out Patients – Ante Natal; Appliances; Audiology; Dental; Gynecology; Main Out Patient Department; Orthodontics; Orthopedics; Out Patient Department (Main); Podiatry (Chiropody); Physiological Measurement; Pain Clinic.. For the purpose of this workshop, we will retain the original 12 departments, unless individual clients specify otherwise.
- Part 1 Month 2 Select Project & Explain Reason Identify which area or department requires improvement. Is the customer care getting poor reviews? Identify the Key Performance Indicators that show there is an actual problem. For instance, the average handle time is too high in the last quarter compared to the average handle time and so on. Try to identify the reasons leading to poor performance. Remember everyone is involved in Kaizen, so you need to visit the call centre, meet the customer care representatives face to face and ask them to share the problems faced and reasons for unproductivity. You might come to know that with expansion of services, more manpower was needed but was not provided resulting in work pressure. Or they were not given proper training about the products and services resulting in confusion.
- Part 1 Month 3 Set Goals Based on the initial data you have collected, set goals for improvement. While setting goals, try adhering to the SMART model i.e. the goals should be Specific, Measurable, Achievable, Relevant, and Time Bound. For example, your goals could be to hire 50 new customer reps in a month, hold exhaustive training sessions twice a week and reduce average handle time from 5 minutes to 3.5 minutes.
- Part 1 Month 4 Prepare Action Plan Now is the time to prepare a detailed action plan by involving all the stakeholders. If the goals require efforts by the HR department, team leaders, staff or any specific department, involve them in preparing a detailed action plan. Try to answer the below 5Ws and 1H while doing so. The point is that it is fact and data-driven and encompasses all the relevant criteria like time and ownership. WHY are we undertaking this project? WHAT are we going to do? WHAT date is required? WHO is responsible for each task? WHO should be involved? HOW must it be accomplished? HOW do we review? WHERE do we find relevant data and facts? WHEN must a task be complete?
- Part 1 Month 5 Gather The Data We need hard facts and reliable data to recognize the patterns. Is the lower conversion on your site a seasonal fluctuation or has it been a downhill after the introduction of new interface? Data collected for the past few years helps you arrive at reliable conclusions. You can use multiple data collection tools like interviews, online surveys, telephonic chats, field studies, and so on to collect the data. Kaizen recommends visiting the shop floor (the place where actual operations take place) to see for yourself the operation in action and identify problem areas. In lean manufacturing, this concept is called gemba meaning “the real place”. Gemba kaizen suggests that whenever a problem occurs, visit the site and gather data from all sources. This is the place where the best improvement ideas will come. Collect data for all the KPIs you have identified like lead time, cycle time, average handle time, and so on.
- Part 1 Month 6 Analyze The Facts You can use seven basic Quality Tools at this stage for data analysis and presentation: 1. Checklist- A checklist or a check sheet is a simple way to analyse data. Rather than relying on memory, use a checklist to remember the things that need to be done or items that need to be obtained. 2. Control Chart- Are your processes under control or out of control? Use Control Charts to show how processes are changing over time. A control chart has a center line (average), an upper limit line and a lower limit line. Plot your data on this chart and compare the same with these lines to draw conclusions. 3. Flow Chart- Visually represent the steps in a business process as it moves through various departments using a flow chart. This removes any confusion and the process is clear to all. 4. Histogram- Show the variation in sets of data using Histograms. A histogram is often confused with a bar graph but unlike bar graph, in a histogram there are no spaces between bars. 5. Scatter Diagram- Scatter Diagrams are basically line graphs but with no line. It is used to see whether a relationship exists between two items. Plot the cause on X axis and the effect on Y axis and interpret the data accordingly. 6. Cause and Effect Analysis- While analysing and visually presenting the data, one can use the Cause and Effect Analysis diagram also known as “Fishbone” diagram. Place the problem at the mouth of the fish and list the possible causes on the branches or bones of the fish. Have main categories like people, equipment, policies, and procedures as the branches and put sub-causes on the sub-branches. It is a great visual to clearly see all major and minor causes of a problem. 7. Pareto Analysis- You may also use Pareto Analysis, a statistical technique based on the 80/20 rule. According to this rule, 80% of the problems are caused by just 20% causes. While doing Pareto Analysis, you score each problem, group related problems together, and focus all your efforts on the most important causes while ignoring the smaller ones.
- Part 1 Month 7 Develop Solutions After collecting and analysing the data, it’s time for all team members to have an open brainstorming session to develop solutions to the problem. You need to follow all rules of brainstorming like participation by all, no criticism of any idea, no judgmental looks, and no limitations on the number of ideas a person can share. You can follow the most popular brainstorming techniques to have a fruitful discussion round.
- Part 1 Month 8 Test Solutions The solutions developed in the previous stage need to be tested and their effectiveness measured.
- Part 1 Month 9 Ensure Goals Are Satisfied Are the goals set in the first stage being met with the solutions suggested? If not, you need to develop more effective solutions or you need to reevaluate the goals set earlier. So you need to go back to reassess your goals and see which goals were achieved and which were not.
- Part 1 Month 10 Implement Solutions The success in trial phase now needs to be implemented fully to bring about Kaizen- change for good. The new way becomes the standard way and this becomes the baseline for further improvement. Maintain a standard operating sheet that will be followed by all. The standard operating sheet will lay out the work sequence to be followed, time in which the task must be finished, the inventory needed for smooth operation and safety guidelines.
- Part 1 Month 11 Monitor Solutions Once the solutions have been implemented successfully, they need to be monitored over a sustainable period of time in order to evaluate and assess internal strengths and weaknesses and external opportunities and threats. Use Key Performance Indicators (KPI) to evaluate and assess performance on an ongoing basis.
- Part 1 Month 12 Continuous Improvement Kaizen is a continuous process – a mindset for continuous improvement. So in this stage you need to keep monitoring the solutions, improvise them and as bottlenecks emerge, repeat the cycle once again- Plan, Do, Check, Act. This should become a culture, a habit so that you never stagnate and keep improving and improving.
Methodology

Clinical Process Improvement – Harvard Review
Within both ambulatory and inpatient settings, there is mounting pressure to improve quality, safety and efficiency. The key question, is how? Attendees will leave this corporate training program with evidence-based quality and safety strategies to enable them to effectively execute these approaches for sustainable daily practice. A 360-degree education is unique to this program, delivering diverse perspectives relating to:
Healthcare Quality
• Maintaining Qualifications for CPPS, CPHQ and CPHRM
• Addressing barriers to a culture of collaboration
• Achieving better results on quality metrics
• Preventing healthcare provider burnout through resilience
• Peer-to-peer assessment
Patient Safety
• Utilizing Ambulatory Safety Nets in order to prevent missed and delayed diagnoses
• Innovative transparency efforts to promote disclosure and a culture of safety
• Encouraging non-punitive error reporting to promote the highest-quality care
• Supporting patients and providers with communication and resolution programs
Medication Safety
• Responding to the Opioid Crisis with advances in addiction management
• Improving medication safety to reduce risk of adverse events
• Maintaining safe care during national medication shortages
• Developing clinical decision support tools to improve electronic health record functionality
Innovative Care Delivery and Re-design
• Equity in healthcare
• Standardizing care to improve outcomes with sustainable clinical pathways
• Rethinking care delivery method
• Population health management solutions
Process Improvement and Change Management
• Engaging staff to incorporate change management systems into practice
• Utilizing project charters to define goals
• Increasing the value of process improvement initiatives
• Sustaining high performance through reliable processes
Leadership
• Aligning senior leadership, management, and frontline caregivers to deliver safe and effective care
• Engaging leadership in risk mitigation and compliance strategies
• Advancing successful quality and safety committee structures
• Developing a supportive model of shared accountability with Just Culture
Quality and Safety in Primary Care and Cancer Care Settings
• Leveraging analytics to transform care
• Aligning clinical, financial, operational and research resources
• Improving patient experience using non-traditional sites of healthcare delivery
• Extending healthcare access through telehealth

Clinical Process Improvement – Kaizan
Doing the Impossible
Achieving tangible process improvement in the clinical setting is neither magical nor impossible. The use of Kaizen, in particular, is a short-term intense action that makes processes more reliable and less wasteful while encouraging legitimate and meaningful employee involvement.1 During Kaizen, understanding the flow of information and people allows the “impossible” to become surprisingly apparent. Knowing this, let’s dive deeper into the idea of transforming the “impossible” into realistic solutions. For example, a radiology special procedures room needed to speed up the change-over process before the next procedure, yet everyone seemed extremely busy, giving off the impression that each person was going as quickly as possible to achieve the best results. The hospital nurses, who insisted that improvement was impossible, only saw the rushed chaos when making their assessment – how much faster could everyone really move to achieve better performance?
Since the busy change-over provided the illusion of productivity, an observer had to look at the interactions among each individual part to analyse how it flowed to find the challenges to the process. The initial steps of this Kaizen discovered these silent threats, so addressing them became the next stage in locating realistic ways to speed up the process. To get the radiology room performing at its best, the leaders (physician, nurses, and tech staff) charted the process in its entirety with the help of a time study, spaghetti chart, and other Kaizen tools. By the end, the leaders were able to minimize the 30+ minute process to 22 minutes, while also removing the need for an additional nurse – saving time, resources, and costs.
What this anecdote hopes to demonstrate is that, like a magic show, a hospital’s “impossibilities” can be an illusion. While hospital leaders are bombarded by people who all seem to have “the solution” to one problem or another in the clinical setting, each of these offered solutions only muddles the process of finding the best answer. Kaizen, however, gets the best out of everyone, allowing clinical leaders to do the “impossible” with proven industrial tools.
Assessing the Clinical Setting
In assessing the clinical setting, progress is made by having the hospital staff identify the biggest time wasters and processes that lead to inefficiencies. These processes can be examined and new procedures can be tested. Before attempting to make changes, however, a Kaizen requires a strategy and a clear vision, so answering some fundamental questions about the nature of the organization can help a Kaizen team locate its mission. Fundamental questions: • What is the purpose of the organization? • What is the value proposition of the company? • Why does it exist? • By what means and principles will the vision be obtained? • How is success toward that purpose measured?
Three Perspectives: Time, Space & Concurrent Sequence
To get a clearer picture of what is occurring in a given process or system, the three perspectives of time, space and concurrent sequence should be analysed to spotlight improvement opportunities. Here, multiple perspectives help to paint visible pictures to “impossible” problems. While observing the department in motion, address the following questions: • How long does it take? • What kinds of defects or errors might occur at this step in the process? • What do you have to do to get ready to do the next case? • How many can be done in a day? • What triggers the work? • What preventative actions or rework occurs to handle defects?
Value Stream Mapping
One tool for observing current processes relies on value stream mapping (VSM). VSM shows how materials, people, equipment, methodology, and measures interact over time to create value for the customer. VSM illuminates the flow of physical events while keeping disruption and confusion to a minimum. Although VSM may end up looking like a convoluted mess to the untrained eye, the map is a very powerful way to identify problems and constraints for Kaizen topic selection. Since the map has the potential to be over-drawn, remember that the intent of the map is to enable people to see how time and resources are lost along the path of the work flow. This map allows techs, RNs, physicians, or surgeons the ability to become engineers, seeking to drastically reduce time, complexity, and errors in each step of a clinical process.
The Value of Physician-Led Teams
In response to healthcare reform, hospital LEADERS have been trying to reduce costs while maintaining quality patient care. However, knowing only the basics of Kaizen can bring a hospital more harm than good. To attain true Lean transformation, the type thriving in both industrial and clinical settings, Kaizen needs to be done as a long-term project with the help of an expert Kaizen facilitator and the support of the entire medical staff. One mistake in the broader clinical community is that anything done to cut costs may be considered “Lean,” including staff elimination. True Lean methodology, however, focuses on continuous improvement and the genuine respect for each worker – not their elimination. Here, respect means wanting to see everyone excel, increasing staff morale through cross-level buy-in.
Kaizen promotes using the creative minds of people at all levels of the organization, so one person or one job type cannot represent the “hero” of the group. Still, in the clinical setting, special attention should focus on physician involvement – a key factor that influences a protocol’s clinical acceptance and long-term sustainability. A clinical Kaizen team consists of a variety of hospital staff, but without physician buy-in, many Kaizen teams find that their process improvement goals get blocked by physicians who are unwilling to change. While physicians’ participation hinges on many factors, studies suggest that physicians are reluctant to participate in process improvement projects due to fear of hospital motives and lack of time, and these barriers impede the success of process improvement efforts.2 To counter such reluctance, executive leadership should enact company-wide initiatives for process improvement based on successful Lean principles used in other industries.
When hospitals have access to extensive in-house process improvement resources, including the expertise of senior leadership and transitional leaders in operations and management, they gain a stronger culture of “Lean Thinking.” Whether trying to combat low case volume, high wait times or poor staff satisfaction, physicians who establish quality as priority and who work in a quality focused culture have the greatest ability to organize the resources necessary to support ongoing Lean transformation. Only then can hospitals significantly differentiate themselves from their competition as they strive to continually optimize efficiency and the utilization of resources.
Overcoming Fear of Change
Even though this paper focuses on Kaizen in the clinical setting, it’s good to remember Lean thinking from its start at Toyota in the 1930s. At Toyota, their continual small improvements (Kaizen) added up to major benefits: faster delivery, lower costs, and greater customer satisfaction.3 Today, as noted in the Harvard Business Review, all levels of hospital staff are “radically increasing the effectiveness of patient care and dramatically lowering its cost by applying the same capabilities in operations design and improvement that drive the famous Toyota Production System.”4 Through Kaizen, “impossible” problems become visible, thereby reducing a leader’s anxiety when making decisions to forward a hospital’s growth and success. When hospital leaders have access to in-house process improvement resources, they no longer need to seek out multiple, outside consultations because leaders finally have the tools at hand to generate novel solutions to dynamic problems–an option, before Kaizen, that truly once seemed impossible.
References
1. Cooper, M. (2008). Kaizen sketchbook: A comprehensive illustrated field guide for lean transformation. Lake Forest, IL: Moffitt Associates, LLC. 2. Weiner, B., Shortell, S., Alexander, J. (1997). Promoting clinical involvement in the hospital quality improvement efforts: The effects of top management, board, and physician leadership. Health Services Research. Retrieved from http://findarticles.com/p/articles/mi_m4149/is_n4_v32/ai_20123544/ 3. Kaizen History. QualitiAmo. Retrieved from http://qualitiamo.com/en/improving/kaizen/history.html 4. Spear, S. (2005). Fixing health care from the inside, today [Abstract]. Harvard Business Review, 83(9), 78-91.

Clinical Process Improvement – The Mayo Clinic
By Derek A Haas, Richard A Helmers, March Rucci, Meredith Brady and Robert S Kaplan.
In the last six years, a Harvard Business School team has worked with dozens of health care organizations to help them understand the true costs of their treatments for many medical conditions. These efforts were part of the providers’ quest to increase the value of their care delivery — in other words, achieve better outcomes at the lowest-possible cost. The HBS team has been using Time-Driven Activity-Based Costing (TDABC), an approach initially proposed by one of us (Bob Kaplan) and Michael Porter, to help providers pursue the value-based delivery of care. One of the team’s central findings is that TDABC cannot be delegated to the finance function. The most successful implementations have had strong executive support, exceptional clinical leaders, and dedicated, multi-disciplinary project teams. Among the implementing provider groups, Mayo Clinic stands out for its exemplary approach, which has enabled it to consistently enhance care delivery and realize cost efficiencies. We believe that others can learn from Mayo’s disciplined approach for value realization projects. Each Mayo Clinic value-improvement project must: • gain senior leadership support, including an approved charter • select a project team with the right skill sets • engage local physicians for each medical condition studied • measure both costs and outcomes for comparative analyses of care variation • test process-improvement suggestions • record and share end-of-project learnings.
We selected one of the most successful Mayo projects, the “Orthopaedic Project” for total knee and hip replacements (arthroplasties), to illustrate how a structured and well-executed implementation can improve health care value. Gain senior leadership support. The clinic created a high-level steering committee to oversee all its costing and value-improvement projects. Establishing this committee signalled that implementing value-based healthcare delivery was an institutional priority. The committee includes the leaders of its clinical practice committee (the dean and the vice dean for practice); its Center for the Science of Health Care Delivery (a hybrid research practice center); and its quality, supply chain, analytics, marketing, contracting, systems and procedures, finance, and planning functions. The steering committee selects projects to undertake, defines the project charter, generates the buy-in of the leadership of the project’s service line, provides staff support and education for project personnel, and participates in periodic calls with the project team and the HBS team to keep the work moving along the agreed-upon timeline. The charter for the Orthopaedic Project specified the project goals: determine the relevant quality-outcome metrics, use TDABC to identify the resources used and their costs for the existing treatment pathways, and pursue opportunities to improve the value of care delivered. The charter also specified the project’s scope, the timeline and major checkpoints, and the key personnel that would be involved. The scope of the Orthopaedic Project included all the direct personnel and major supply costs used — from the pre-surgical visit, when the decision for surgery was made, through the first post-discharge orthopaedic follow-up visit.
The Orthopaedic Project began at Mayo’s flagship campus in Rochester, Minnesota, and then was extended to its locations in Jacksonville, Florida, and Phoenix, Arizona. Select a project team. Mayo staffs it value improvement projects with a project leader to coordinate the team’s work, a systems engineering analyst to conduct process mapping, and a financial analyst to provide relevant data. Each person works only part-time on any given project but could work on multiple projects to build a base of experience with applying TDABC to varied clinical treatments. For the Orthopaedic Project, each of the three sites had its own project leader and financial analyst; a single systems-engineering analyst led the process mapping at all locations to ensure a common level of detail across them. Engage local physicians. Every project must have the support of a senior clinician for that medical condition. In addition, each project team interviews several physicians at each site to ensure the process maps captured the existing treatment protocols. Local clinicians and staff generate multiple ideas for improvements and subsequently help to test and implement the recommended changes. Involving the physicians in this way helps ensure that they view the resulting process maps as credible and actionable. Measuring and tracking outcomes in value-improvement projects is essential to ensure that any changes will maintain or improve care quality. The Orthopaedic Project team reviewed data, which showed that all three Mayo locations were already performing well on length of stay, complication rates, and 30-day readmission rates compared with a range of national benchmarks. The team also analysed patient-pain scores during the hospital stay and attempted to access data on patient-reported pain and functionality, both pre-and post-operatively. Unfortunately, fewer than 20% of patients had completed both pre- and post-operative surveys. The project team developed TDABC process maps at the three locations. These revealed significant practice variations, a source of opportunities for practice improvements.
For instance, the Mayo hospitals used different approaches for controlling patients’ pain. For total-knee-replacement procedures, anaesthesiologists in Florida used more peripheral nerve blocks, which involved placing catheters to block the femoral nerve. Arizona orthopaedists more frequently injected a combination of anaesthesia and analgesics into the operative joint. Analysis revealed that patients at the two hospitals reported about the same level of pain during the post-surgery hospital recovery. But the Florida’s patients who received the nerve block waited longer before starting to walk and undergo physical therapy. The team hypothesized that these delays could be the cause of Florida’s longer hospital stays and higher rates of discharge to skilled nursing facilities. Test process-improvement suggestions. Every Mayo value-improvement project tests one or more innovations for improving the value of care. In the Orthopaedic Project, the Florida hospital changed its pain-control regimen, switching from a peripheral nerve block to the use of peri-articular anaesthesia and analgesics. Florida also changed its communications to patients and their families pre-operatively to set clearer expectations for the expected length of stay and where the patient would be discharged from the hospital. Its patients’ median pain score during the hospital stay declined from a 3 to a 2 on a 1-10 scale. The mean length of stay declined by 0.4 days to become the lowest of the three sites. It also realized a 24-percentage-point decrease (from 46% to 22%) in the percentage of patients discharged to expensive skilled nursing facilities. Florida site’s costs decreased by 15%, now the lowest among the three hospitals.
The Orthopaedic Project also led Mayo to pursue other improvement opportunities. It began a pilot study for obtaining patient-reported outcomes from tablets and smartphones and started to address how to eliminate the major variations in cost of prostheses and other supplies at the three sites. A culture of continuous improvement has been established: Personnel at each location now continually review the process maps and associated costs to identify additional process-improvement projects. Record and share learnings. At the conclusion of every value-improvement project, the project team prepares a summary report. The report includes a comparison of the actual time line and resources used with those planned in the charter. It documents the process and assumptions used for the project, lessons learned, key success factors, recommendations for future projects, and planned next steps. This documentation facilitates learning across multiple sites and projects. Mayo Clinic’s governance structure and project-management approach allow it to support a continual flow of value-improvement projects that consistently deliver better outcomes and lower costs for each medical condition it accepts for study. Following this disciplined, transparent approach should enable all medical institutions to improve the value they deliver, medical condition by medical condition.
The Kaizen Process
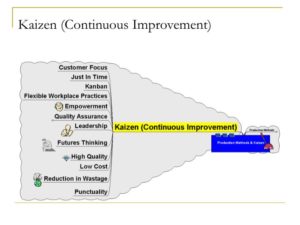
Kaizen is an approach to creating continuous improvement based on the idea that small, ongoing positive changes can reap major improvements. Typically, it is based on cooperation and commitment and stands in contrast to approaches that use radical changes or top-down edicts to achieve transformation. Kaizen is core to lean manufacturing, or The Toyota Way. It was developed in the manufacturing sector to lower defects, eliminate waste, boost productivity, encourage worker purpose and accountability, and promote innovation.
As a broad concept that carries myriad interpretations, it has been adopted in many other industries, including healthcare. It can be applied to any area of business, and even to personal life. Kaizen can use a number of approaches and tools, such as value stream mapping, which documents, analyzes and improves information or material flows required to produce a product or service, and Total Quality Management (TQM), a management framework that enlists workers at all levels to focus on quality improvements. Regardless of methodology, in an organizational setting, the successful use of Kaizen rests on gaining support for the approach across the organization, and from the CEO down.
Kaizen is a compound of two Japanese words that together translate as “good change” or “improvement,” but Kaizen has come to mean “continuous improvement” through its association with lean methodology. Kaizen has its origins in post-World War II Japanese quality circles. These circles or groups of workers focused on preventing defects at Toyota and were developed partly in response to American management and productivity consultants who visited the country, especially W. Edwards Deming, who argued that quality control should be put more directly in the hands of line workers. Kaizen was brought to the West and popularized by Masaaki Imai via his book Kaizen: The Key to Japan’s Competitive Success in 1986.
As with lean, Kaizen is complementary to Six Sigma.
Ten principles of Kaizen
Because executing Kaizen requires enabling the right mindset throughout the company, 10 principles that address the Kaizen mindset are commonly referenced as core to the philosophy. They are:
01. Let go of assumptions.
02. Be proactive about solving problems.
03. Don’t accept the status quo.
04. Let go of perfectionism and take an attitude of iterative, adaptive change.
05. Look for solutions as you find mistakes.
06. Create an environment in which everyone feels empowered to contribute.
07. Don’t accept the obvious issue; instead, ask “why” five times to get to the root cause.
08. Cull information and opinions from multiple people.
09. Use creativity to find low-cost, small improvements.
10. Never stop improving.

How Kaizen works
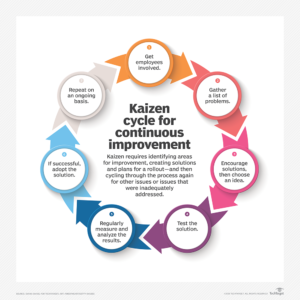
Kaizen is based on the belief that everything can be improved and nothing is status quo. It also rests on a Respect for People principle. Kaizen involves identifying issues and opportunities, creating solutions and rolling them out — and then cycling through the process again for other issues or problems that were inadequately addressed. These following seven steps create a cycle for continuous improvement and give a systematic method for executing this process.
Kaizen cycle for continuous improvement
Get employees involved Seek the involvement of employees, including gathering their help in identifying issues and problems. Doing so creates buy-in for change. Often, this is organized as specific groups of individuals charged with gathering and relaying information from a wider group of employees.
Find problems Using widespread feedback from all employees, gather a list of problems and potential opportunities. Create a shortlist if there are many issues.
Create a solution Encourage employees to offer creative solutions, with all manner of ideas encouraged. Pick a winning solution or solutions from the ideas presented.
Test the solution Implement the winning solution chosen above, with everyone participating in the rollout. Create pilot programs or take other small steps to test out the solution.
Analyze the results At various intervals, check progress, with specific plans for who will be the point of contact and how best to keep ground-level workers engaged. Determine how successful the change has been.
Standardize If results are positive, adopt the solution throughout the organization.
Repeat. These seven steps should be repeated on an ongoing basis, with new solutions tested where appropriate or new lists of problems tackled.
Kaizen 5S framework
A 5S framework is a critical part of the Kaizen system and establishes an ideal physical workplace. The 5Ses focus on creating visual order, organization, cleanliness and standardization to improve profitability, efficiency, service and safety. Below are the original Japanese 5Ses and their common English translations.
Seiri/Sort (organize) — Separate necessary workplace items from unnecessary ones and remove unnecessary items.
Seiton/Set in order (create orderliness) — Arrange items to allow for easy access in the way that makes the most sense for work.
Seiso/Shine (cleanliness) — Keep the workspace clean and tidy.
Seiketsu/Standardize (standardized cleaning) — Systematize workplace cleanup best practices.
Shitsuke/Sustain (discipline) — Keep the effort going.

Advantages and disadvantages
While the benefits of Kaizen are many, there are some situations for which it is less suited. Here’s a look at some advantages and disadvantages that experts commonly cite.
Kaizen advantages
With its focus on gradual improvement, Kaizen can create a gentler approach to change in contrast to big efforts that may be abandoned due to their tendency to provoke change resistance and abandonment.
Kaizen encourages scrutiny of processes so that mistakes and waste can be reduced.
Inspection needs are lessened, because errors are reduced.
Employee morale grows, because it engenders a sense of value and purposefulness.
Teamwork increases as employees think beyond the specific issues of their department.
Client focus increases as customer requirements awareness is raised.
Systems are in place to ensure improvements are encouraged both short and long term.
Kaizen disadvantages
Companies with cultures of territorialism and closed communication may first need to focus on cultural changes to create a receptive environment.
Short-term Kaizen events may create a burst of excitement that is shallow and short-lived and, therefore, gets abandoned before long.

Real-life Kaizen examples
Toyota is arguably the most-famous for its use of Kaizen, but other companies have used the approach successfully. Here are three examples:
Lockheed Martin. The aerospace company is a well-known proponent of Kaizen. Through the use of Kaizen, it has successfully reduced manufacturing costs, reduced inventory and cut delivery time.
Ford Motor Company. When lean devotee Alan Mulally became CEO of Ford in 2006, the auto giant was on the brink of bankruptcy. Mulally used Kaizen to execute one of the most famous corporate turnarounds in history.
Pixar Animation Studios. Pixar has taken a continuous improvement model that reduced risks of expensive movie failure by using quality control checks and iterative processes.

Using Kaizen in Healthcare
Healthcare reform has placed pressure on hospitals to streamline their practices in the face of shrinking budgets and increasing demands. Budgets are strained as Medicare and Medicaid set fixed prices for services that are much lower than the prices paid by other insurances. ERs are then overwhelmed because many private practitioners refuse to take these insurances. Instead of seeing 100 patients, an ER might see 200 patients without additional resources.
Lean tools can increase efficiency and help hospitals stay within their budgets. While numerous lean tools can be used in hospitals, Kaizen is particularly useful because it focuses on continuously improving every aspect of a workplace.
Healthcare Kaizen is a lean tool that focuses on small, continuous improvements throughout the workplace. Each small change results in a minor improvement. As time passes, these minor improvements add up to significant steps forward in efficiency, quality, safety, and workplace culture.
Kaizen’s potential comes from its inclusive approach. Unlike other improvement programs, Kaizen’s success depends on participation from all employees. This means that directors, nurses, doctors, nursing assistants, technicians, accountants, purchasers, and administrators need to examine their daily routines and make suggestions for improvements. Key to the Kaizen philosophy is that it is continuous. Kaizen becomes part of the workplace culture when it is practiced every day by everyone

Continuous Improvement in Healthcare
Kaizen’s potential comes from recognizing that the people performing the work (including nurses, radiologists, and doctors) know the most about their job and how to improve it. The resulting changes are centered on what’s important in the hospital—quality of care and patient safety.
To make Healthcare Kaizen successful
Ensure everybody knows that Kaizen is becoming a critical part of the workplace. Have meetings and use visual communication throughout the hospital to remind healthcare professionals to practice continuous improvements. Ensure all department heads and supervisors know what Kaizen is, how to facilitate engagement, and how changes should be implemented.
Make a plan for getting everybody involved. Will suggestions be made through a suggestion box or idea board? Will healthcare professionals approach their supervisors to propose improvements? Make a plan for sharing improvements. For instance, idea boards can be used to track changes. Workers place their suggestions on the board, and supervisors, in turn, put their response on the board. This continues until each improvement is completed. Make a plan for keeping people involved. This could mean allowing people to implement their own suggestions, as well as letting people see the results (metrics) of the change. Make a plan for responding to every suggestion. Responses should go into detail about how the suggestion is being implemented. No change is too small to be implemented. Doing these things will ensure that Kaizen is successful, is practiced, and continues to increase efficiency.

Ideas for Continuous Improvement in Hospitals
Once Kaizen is underway, it can be difficult to know what Kaizen can improve. The good news is that Kaizen can help anywhere someone notices a need for improvement. Kaizen helps by streamlining workflow, improving organization, increasing safety, and ensuring that resources are used effectively.
Streamlining Workflow
Pay special attention to areas where work slows down. For example, unnecessary slowdowns and life-threatening emergencies can arise from equipment or people being in the wrong area at the wrong time, such as in the emergency room too early or too late. Try creating visual workflow with signs, labels, color coding, and floor marking to communicate where equipment goes and when it is needed. Empower Kaizen and use 5S to help remove clutter, streamline workflow, improve communication, and reduce the time procedures take from start to finish.
Improving Organization
Ensuring that medication and tools are stored in the proper location is essential to workflow and patient safety. Using clear visual communication improves safety by ensuring patients receive the medication and dose they need. It can also increase efficiency by letting people quickly find and store medication.
Increasing Safety
Centers for Disease Control and Prevention (CDC) reported in 2011 that 75,000 deaths were caused by healthcare-associated infections (HAIs). Many HAIs can be prevented by implementing procedures and improving surgical practices. Develop a clear visual communication system to remind healthcare workers how they can reduce HAIs, saving lives and billions of dollars each year.
Properly Using Resources
Are nurses spending time on tasks, such as changing sheets or doing laundry, which could be handled by someone else? Look for situations where nursing assistants or other non-licensed healthcare workers can take over these tasks. This will free up nurses to work in areas that require their expertise, such as seeing patients. In the long run, this will save money and increase overall efficiency. More patients can be helped during each shift.
This is by no means a comprehensive list of what Kaizen can improve. Kaizen’s guiding philosophy of continuous improvement makes it a flexible lean tool that can meet the unique challenges of any industry, from manufacturing and finance to healthcare and IT.
Industries
This service is primarily available to the following industry sectors:

Healthcare
The health care industry incorporates several sectors that are dedicated to providing health care services and products. As a basic framework for defining the sector, the United Nations’ International Standard Industrial Classification categorizes health care as generally consisting of hospital activities, medical and dental practice activities, and “other human health activities.” The last class involves activities of, or under the supervision of, nurses, midwives, physiotherapists, scientific or diagnostic laboratories, pathology clinics, residential health facilities, patient advocates or other allied health professions. In addition, according to industry and market classifications, such as the Global Industry Classification Standard and the Industry Classification Benchmark, health care includes many categories of medical equipment, instruments and services including biotechnology, diagnostic laboratories and substances, drug manufacturing and delivery. For example, pharmaceuticals and other medical devices are the leading high technology exports of Europe and the United States. The United States dominates the biopharmaceutical field, accounting for three-quarters of the world’s biotechnology revenues.
The quantity and quality of many health care interventions are improved through the results of science, such as advanced through the medical model of health which focuses on the eradication of illness through diagnosis and effective treatment. Many important advances have been made through health research, biomedical research and pharmaceutical research, which form the basis for evidence-based medicine and evidence-based practice in health care delivery. For example, in terms of pharmaceutical research and development spending, Europe spends a little less than the United States (€22.50bn compared to €27.05bn in 2006). The United States accounts for 80% of the world’s research and development spending in biotechnology. In addition, the results of health services research can lead to greater efficiency and equitable delivery of health care interventions, as advanced through the social model of health and disability, which emphasizes the societal changes that can be made to make populations healthier. Results from health services research often form the basis of evidence-based policy in health care systems. Health services research is also aided by initiatives in the field of artificial intelligence for the development of systems of health assessment that are clinically useful, timely, sensitive to change, culturally sensitive, low burden, low cost, built into standard procedures, and involve the patient.
There are generally five primary methods of funding health care systems:
1. general taxation to the state, county or municipality
2. social health insurance
3. voluntary or private health insurance
4. out-of-pocket payments
5. donations to health charities
In most countries, the financing of health care services features a mix of all five models, but the exact distribution varies across countries and over time within countries. In all countries and jurisdictions, there are many topics in the politics and evidence that can influence the decision of a government, private sector business or other groups to adopt a specific health policy regarding the financing structure. For example, social health insurance is where a nation’s entire population is eligible for health care coverage. This coverage and the services provided are regulated. In almost every jurisdiction with a government-funded health care system, a parallel private, and usually for-profit, the system is allowed to operate. This is sometimes referred to as two-tier health care or universal health care.
Health care in the United States is provided by many distinct organizations. Health care facilities are largely owned and operated by private sector businesses. 58% of US community hospitals are non-profit, 21% are government owned, and 21% are for-profit. According to the World Health Organization (WHO), the United States spent more on health care per capita ($9,403), and more on health care as percentage of its GDP (17.1%), than any other nation in 2014. Despite being among the top world economic powers, the US remains the sole industrialized nation in the world without universal health care coverage.
Health care in the United Kingdom is a devolved matter, with England, Northern Ireland, Scotland and Wales each having their own systems of publicly funded healthcare, funded by and accountable to separate governments and parliaments, together with smaller private sector and voluntary provision. As a result of each country having different policies and priorities, a variety of differences now exist between these systems. Despite there being separate health services for each country, the performance of the National Health Service (NHS) across the UK can be measured for the purpose of making international comparisons. In a 2014 report by the Commonwealth Fund ranking developed-country healthcare systems, the United Kingdom was ranked the best healthcare system in the world overall and in the following categories: Quality of Care (i.e. effective, safe, coordinated, patient-oriented), Access to Care, Efficiency, and Equity. The UK’s palliative care has also been ranked as the best in the world by the Economist Intelligence Unit. On the other hand, in 2005-09 cancer survival rates lagged ten years behind the rest of Europe, although survival rates continue to increase.
The nation of Austria has a two-tier health care system in which virtually all individuals receive publicly funded care, but they also have the option to purchase supplementary private health insurance. Care involving private insurance plans (sometimes referred to as “comfort class” care) can include more flexible visiting hours and private rooms and doctors. Some individuals choose to completely pay for their care privately. Healthcare in Austria is universal for residents of Austria as well as those from other EU countries. Enrolment in the public health care system is generally automatic and is linked to employment, however insurance is also guaranteed to co-insured persons (i.e. spouses and dependents), pensioners, students, the disabled, and those receiving unemployment benefits. Enrolment is compulsory, and it is not possible to cross-shop the various social security institutions. Employers register their employees with the correct institution and deduct the health insurance tax from employees’ salaries. Some people, such as the self-employed, are not automatically enrolled but are eligible to enrol in the public health insurance scheme. The cost of public insurance is based on income and is not related to individual medical history or risk factors.

Education
It has been argued that high rates of education are essential for countries to be able to achieve high levels of economic growth. Empirical analyses tend to support the theoretical prediction that poor countries should grow faster than rich countries because they can adopt cutting edge technologies already tried and tested by rich countries. However, technology transfer requires knowledgeable managers and engineers who are able to operate new machines or production practices borrowed from the leader in order to close the gap through imitation. Therefore, a country’s ability to learn from the leader is a function of its stock of “human capital”. Recent study of the determinants of aggregate economic growth have stressed the importance of fundamental economic institutions and the role of cognitive skills. At the level of the individual, there is a large literature, generally related to the work of Jacob Mincer, on how earnings are related to the schooling and other human capital. This work has motivated a large number of studies, but is also controversial. The chief controversies revolve around how to interpret the impact of schooling. Some students who have indicated a high potential for learning, by testing with a high intelligence quotient, may not achieve their full academic potential, due to financial difficulties. Economists Samuel Bowles and Herbert Gintis argued in 1976 that there was a fundamental conflict in American schooling between the egalitarian goal of democratic participation and the inequalities implied by the continued profitability of capitalist production. Many countries are now drastically changing the way they educate their citizens. The world is changing at an ever quickening rate, which means that a lot of knowledge becomes obsolete and inaccurate more quickly. The emphasis is therefore shifting to teaching the skills of learning: to picking up new knowledge quickly and in as agile a way as possible. Finnish schools have even begun to move away from the regular subject-focused curricula, introducing instead developments like phenomenon-based learning, where students study concepts like climate change instead. Education is also becoming a commodity no longer reserved for children. Adults need it too. Some governmental bodies, like the Finnish Innovation Fund Sitra in Finland, have even proposed compulsory lifelong education.
The United States spends more per student on education than any other country. In 2014, the Pearson/Economist Intelligence Unitrated US education as 14th best in the world. In 2015, the Programme for International Student Assessment rated U.S. high school students No. 40 globally in Math and No. 24 in Science and Reading. The President of the National Center on Education and the Economy said of the results “the United States cannot long operate a world-class economy if our workers are, as the OECD statistics show, among the worst-educated in the world”. Former U.S. Education Secretary John B. King, Jr. acknowledged the results in conceding U.S. students were well behind their peers. According to a report published by the U.S. News & World Report, of the top ten colleges and universities in the world, eight are American (the other two are Oxford and Cambridge, in the United Kingdom).

Pharmaceutical
The pharmaceutical industry is responsible for the development, production and marketing of medications. Thus, its immense importance as a global sector is inarguable. In 2014, total pharmaceutical revenues worldwide had exceeded one trillion U.S. dollars for the first time. North America is responsible for the largest portion of these revenues, due to the leading role of the U.S. pharmaceutical industry. However, as in many other industries, the Chinese pharmaceutical sector has shown the highest growth rates over previous years. Still, the leading pharmaceutical companies come from the United States and Europe. Based on prescription sales, NYC-based Pfizer is the world’s largest pharmaceutical company. In 2017, the company generated some 52.5 billion U.S. dollars in pure pharmaceutical sales. Other top global players from the United States include Johnson & Johnson, Merck & Co., and AbbVie. Novartis and Roche from Switzerland, GlaxoSmithKline and AstraZeneca from the United Kingdom, and French Sanofi are the European big five. Branded, patented medicines by far make up the largest share of pharmaceutical revenues. Humira, an anti-inflammatory drug, generated over 18.4 billion U.S. dollars of revenue worldwide in 2017. Oncologics continue to be the leading therapeutic class based on revenue. In 2017, cancer drugs made 81 billion U.S. dollars of revenue globally. Other major therapy classes were pain drugs and antidiabetics. More than any other industry, the pharmaceutical sector is highly dependent on its research and development segment. Some pharmaceutical companies invest 20 percent and more of their revenues in R&D measures. The United States is a traditional stronghold of pharmaceutical innovation. The origin of most new substances introduced to the market can be traced back to the United States. Because of the steady loss of patent protection, the invention of new drugs is of vital importance for the pharmaceutical industry. Revenue losses due to patent expiry often are very significant, as can be seen with Pfizer’s Lipitor from 2012 on.
The global pharmaceutical industry revenue is forecasted to reach an estimated $1,226.0 billion by 2018, with good growth over the next five years (2013-2018). The industry is expected to register growth led by aging population, changing lifestyles, hectic daily activities, unhealthy eating habits, increasing incidence of chronic diseases across the entire global population providing growth opportunities for the industry players. The industry is engaged in discovery, development, manufacture, and marketing of prescription drugs. Industry products include ethical drugs and consumer healthcare but animal healthcare drugs are not included. The global pharmaceutical market faces major challenge from increasing investment and strict regulation. Changing lifestyles and the fast socio-demographic shift due to urbanization in both developed and growth markets globally are expected drive the demand. The ability to create new technology and innovative drugs is a key driver for success in this market. North America is projected to lead the pharmaceutical industry. Vaccine industry is expected to record the highest growth during the forecast period. ROW industry is expected to witness the highest growth during 2013-2018. Government initiatives in Brazil to encourage drugs industries by providing free pricing policies and special financial investment options will attract the industry players. APAC holds good growth potential for the future.

Biotechnology
The global biotechnology market is expected to reach USD 727.1 billion by 2025, according to a new report by Grand View Research, Inc. The emergence of certain key themes in the biotechnology market is expected to drive growth in this industry to a lucrative extent. These key themes include regenerative medicine and genetics in diagnostics. Presence of a plethora of companies focusing on the development of regenerative therapies is anticipated to drive sector growth through to 2025. Technological advancements pertaining to the penetration of artificial intelligence in this industry is expected to fuel progress with potential avenues. The companies are engaged in unleashing machine learning in order to understand individual cancer cases, while recommending clinical trials. Supportive government (and its allied agencies) policies related to synthetic biology is a major growth impacting driver in this sector. Developed economies such as UK and the U.S. are critically monitoring and funding synthetic biology R&D initiatives. For example, in 2010, a six months’ review of synthetic biology headed by a panel of expert scientists was enforced by the U.S. President and subsequently conducted a hearing of the Energy and Commerce Committee exclusively concerning synthetic biology.
Biotechnology uses biological systems or living organisms for the development of its products, mostly biopharmaceutical drugs. The key regions for the global biotech industry are the United States and Europe. As of 2015, about 670 public companies and over 200 thousand employees in these regions generate some 133 billion U.S. dollars of biotech revenue. The United States is the leading global biotech player, with almost 108 billion U.S. dollars of revenue and the industry’s total market capitalization of some 890 billion U.S. dollars. More than 130 thousand people are employed by U.S. public biotechnology companies. The San Francisco Bay Area has the highest concentration of biotech companies within the United States, and accordingly also the highest biotech revenues. Since 2014, Gilead, from Foster City, California, is the world’s largest pure-play biotechnology company, overtaking long-time leader Amgen, also based in California. Of the top five biotech companies globally, four are from the United States. Since the acquisition of U.S.-based Genentech in 2009, Swiss pharmaceutical company Roche has the highest biotech revenue worldwide. However, Illinois-based company AbbVie is the manufacturer of the best-selling biotech drug – Humira. Cancer drugs make up the largest part of biopharmaceutical research and development. Biotechnology is also used in agriculture, mostly in form of genetically modifying crops to make them more resistant or more fruit-bearing. This issue is much discussed because of the possible consequences for the environment and human health. The United States is the country with the highest acreage of GM crops worldwide. For example, some 76 percent of all U.S. corn acreage is genetically manipulated. Top companies in the GM crop segment are Monsanto, Syngenta and Bayer CropScience, for example.

Manufacturing
In the past decade, the global economy has improved significantly, the developing countries are doing better than a decade ago and are contributing significantly to the global product output. The United States still holds the title of the world’s largest economy estimated at $18 trillion, China ranks second at $11 trillion, while Japan ranks third at $4.4 trillion. The three countries account for an estimated 45% of the global economy. The Chinese economy is rising at a speedy rate, and the Centre for Economics and Business Research (CEBR) forecasts that by 2029 the Chinese economy will surpass the US as the world’s largest economy. The rise of China’s economy can be directly attributed to the increase in the country’s output. The global economy is set to witness a 3.5% rise by the end of 2017 and 3.6% in 2018.
China has the world’s largest industrial output. In 2016 it is estimated that the country produced $4.566 trillion of industrial output. Strong factory output, stable retail sales, and an ever-growing export market have helped propel China meet its economic expectations. In the third quarter of 2017, the GDP grew by 6.8%. The industrial output grew by 6.6% in September 2017 compared to a year earlier. In 2016 china exported goods worth $2.342 trillion, it was only surpassed by the European Union which exported $2.659 trillion. The European Union ranked just behind China with an industrial output of $4.184 trillion.
Despite being the largest economy, the United States ranked behind China and the European Union in terms of industrial output. In 2016 the U.S industrial output totalled $3.602 trillion. In the same year, the U.S exported goods worth $1.620 trillion. The third quarter of 2016 witnessed a real output of $1.92 trillion the highest ever in a quarter since the Great Recession of 2008. The manufacturing sector employed more than $12.4 million in March 2017. The largest exports by the US were transportation equipment, chemicals, electronics and computers, and non-electrical machinery.
Japan ranks third in the global ranking, and Asia’s second state. A decade ago, Japan was the second largest economy until it was surpassed by China. In the recent past, Japan’s economy economic might has been put into question particular after the nuclear meltdown in Fukushima and its demographic composition. In 2016 Japan’s total industrial output was $1.368 while its export revenue totalled $683.85. Japan has the largest public debt as a percentage of the GDP, a situation that is preventing the private investments in the country. The disparity in productivity in the various sectors of the economy continues to widen hindering the growth of the export-oriented economy.
Germany is Europe’s largest economy and the fourth largest in the world. It is also Europe’s largest industrial producer. In 2016 Germany’s industrial output totalled $1.050 trillion. Germany witnessed the highest surge in industrial output in August 2017, the largest since 2010. The growth in industrial output is expected to be solid throughout the third quarter of the year. The manufacturing output increased by 3.2% as industries churned out more consumer and intermediate goods. The automobile industry was the key driver behind the surgeon industrial output.
Since the beginning of the millennium, India has proved itself as an economic powerhouse. The country has emerged to be the world’s fastest economy according to the CSO and the IMF. The world’s seventh largest economy is expected to be among the three top economies in the next two decades. The Indian economy is expected to grow by 6.7 percent for the year 2017-18. By the end of 2018, the figure is expected to rise to 7.2 percent. The manufacturing industry is among strong pillars. In 2016 the country’s industrial production produced about $672 billion. Between April and June 2017 the economy grew by 5.7 percent year-on-year.
Although not among the ten largest economies, South Korea’s industrial output continues to grow and ranks better some top economies. In 2016 the industrial output totalled $531 billion. The industrial output rose 2.7 percent year on year in August, bolstered by growth in the technological, manufacturing, and automobile industries. Asian’s fourth-largest economy has witnessed a surge in exports of chipsets and exports to China which grew by 13.5%. The consumer index grew by 1.8% as of October 2017 compared to the same time a year ago.
The United Kingdom is Europe’s second largest industrial producer after Germany. In 2016 the UK produced $505 billion from its industries. Britain’s choice to leave the EU has left uncertainties in the economy as scholars and economists try to examine impacts of the move on the economy. Industrial output in the UK has maintained a 23-year boom streak leading to the growth of the wider economy. The automobile industry grew by 3pc while the mining and quarrying grew by 0.7pc in September. Industrial outputs in France and Italy totalled $478 and $442 billion respectively.
The United States is still the world’s largest economy with a nominal GDP of $18 trillion. The European Union ranks second with $16.8 trillion while China ranks third with $11.2 trillion. Japan and Germany rank third and fourth respectively with $4.4 and $3.5 trillion respectively. The UK, France, India, Italy, and Brazil complete the top ten in the order. Nigeria is Africa’s largest economy with a GDP of $569 Billion followed by South Africa at $350 billion. Tuvalu is the world’s smallest economy with a GDP of $38million, Montserrat ($63m), Kiribati (180 m), Nauru ($182m), and Marshall Islands ($209 m) complete the five smallest economies.
Locations
This service is primarily available within the following locations:

Vienna AT
Austria is one of the 14 richest countries in the world in terms of GDP (Gross domestic product) per capita, has a well-developed social market economy, and a high standard of living. Until the 1980s, many of Austria’s largest industry firms were nationalized; in recent years, however, privatization has reduced state holdings to a level comparable to other European economies. Labor movements are particularly strong in Austria and have large influence on labor politics. Next to a highly developed industry, international tourism is the most important part of the national economy. Germany has historically been the main trading partner of Austria, making it vulnerable to rapid changes in the German economy. However, since Austria became a member state of the European Union it has gained closer ties to other European Union economies, reducing its economic dependence on Germany. In addition, membership in the EU has drawn an influx of foreign investors attracted by Austria’s access to the single European market and proximity to the aspiring economies of the European Union. Growth in GDP accelerated in recent years and reached 3.3% in 2006. In 2004 Austria was the fourth richest country within the European Union, having a GDP (PPP) per capita of approximately €27,666, with Luxembourg, Ireland, and Netherlands leading the list. Vienna was ranked the fifth richest NUTS-2 region within Europe (see Economy of Europe) with GDP reaching €38,632 per capita, just behind Inner London, Luxembourg, Brussels-Capital Region and Hamburg. Growth has been steady between 2002–2006 varying between 1 and 3.3%. After hitting 0% in 2013, growth has picked up a little and as of 2016 sits at 1.5%. Trade with other EU countries accounts for almost 66% of Austrian imports and exports. Expanding trade and investment in the emerging markets of central and Eastern Europe is a major element of Austrian economic activity. Trade with these countries accounts for almost 14% of Austrian imports and exports, and Austrian firms have sizable investments in and continue to move labor-intensive, low-tech production to these countries. Although the big investment boom has waned, Austria still has the potential to attract EU firms seeking convenient access to these developing markets.
Vienna is the federal capital and largest city of Austria, and one of the nine states of Austria. Vienna is Austria’s primate city, with a population of about 1.8 million (2.6 million within the metropolitan area, nearly one third of Austria’s population), and its cultural, economic, and political center. It is the 7th-largest city by population within city limits in the European Union. Until the beginning of the 20th century, it was the largest German-speaking city in the world, and before the splitting of the Austro-Hungarian Empire in World War I, the city had 2 million inhabitants. Today, it has the second largest number of German speakers after Berlin. Vienna is host to many major international organizations, including the United Nations and OPEC. The city is located in the eastern part of Austria and is close to the borders of the Czech Republic, Slovakia, and Hungary. These regions work together in a European Centrope border region. Along with nearby Bratislava, Vienna forms a metropolitan region with 3 million inhabitants. In 2001, the city center was designated a UNESCO World Heritage Site. In July 2017 it was moved to the list of World Heritage in Danger. Apart from being regarded as the City of Music because of its musical legacy, Vienna is also said to be “The City of Dreams” because it was home to the world’s first psychoanalyst – Sigmund Freud. The city’s roots lie in early Celtic and Roman settlements that transformed into a Medieval and Baroque city, and then the capital of the Austro-Hungarian Empire. It is well known for having played an essential role as a leading European music center, from the great age of Viennese Classicism through the early part of the 20th century. The historic center of Vienna is rich in architectural ensembles, including Baroque castles and gardens, and the late-19th-century Ringstraße lined with grand buildings, monuments and parks. Vienna is known for its high quality of life. In a 2005 study of 127 world cities, the Economist Intelligence Unit ranked the city first (in a tie with Vancouver and San Francisco) for the world’s most livable cities. Between 2011 and 2015, Vienna was ranked second, behind Melbourne. In 2018, it replaced Melbourne as the number one spot. For eight consecutive years (2009–2016), the human-resource-consulting firm Mercer ranked Vienna first in its annual “Quality of Living” survey of hundreds of cities around the world, a title the city still held in 2016. Monocle’s 2015 “Quality of Life Survey” ranked Vienna second on a list of the top 25 cities in the world “to make a base within. The UN-Habitat classified Vienna as the most prosperous city in the world in 2012/2013. The city was ranked 1st globally for its culture of innovation in 2007 and 2008, and sixth globally (out of 256 cities) in the 2014 Innovation Cities Index, which analyzed 162 indicators in covering three areas: culture, infrastructure, and markets. Vienna regularly hosts urban planning conferences and is often used as a case study by urban planners. Between 2005 and 2010, Vienna was the world’s number-one destination for international congresses and conventions. It attracts over 6.8 million tourists a year.

London UK
London has always been a commercial city and today enjoys the status of having one of the largest city economies in the world. The city thrives in trade and commerce and has a vibrant culture seeped in commerce. It has a GDP of over £565 billion, which is about 17 percent of the UK’s total GDP. The size of its economy is larger than that of several European nations. The Port of London handles 48 million tonnes of cargo every year. The nature of London’s economy has undergone change over the years. While manufacturing industries held the dominant position during the nineteenth century and the early parts of the twentieth century, service industries, especially financial and business services are now the dominant sector. Of the total £37 billion annual export of goods and services, financial and business services account for about £15.5 billion. London is the home to many banks and financial institutions and has the maximum number of foreign banks in any city. The city is also a major center for forex trade. London trades more US dollars than New York does, and more Euros than all other cities in Europe combined. The service sector employs 3.2 million people in London, which is about 85 percent of all jobs available in London’s service industries. Out of this, the financial sector alone employs about 1.25 million people, or about one in every three jobs available. The manufacturing and construction industry, in contrast, employ half a million residents of Greater London, which is about 11 percent of the employable population of Greater London. London is also a vibrant center for arts and fashion, film, media, design, law and computing industries. E-commerce and related industries ranks amongst the fastest growing sectors in the city’s economy. Tourism is another important sector with high growth potential. London is today the center of operations for almost two out of every three Fortune 500 companies and the European hub for one out of every three large global conglomerates. Several well-known businesses such as HSBC, Barclays Bank, Virgin, BBC and many others have their headquarters at London. The London Stock Exchange is the largest in the world, and accounts for about 32 percent of all global transactions.
The London Plan encapsulates the blueprint for the development of London’s economy. This plan aims to position London as the best city in the world and focuses on specific strategies and plans towards this end. The plan identifies growth sectors such as e-commerce, tourism and environmental industries and lays down sustainable and inclusive plans for the overall development of the economy. The London plan recognizes e-industry or internet based businesses as one of the fastest growing sector and with potential to offer much growth. The Plan envisages an effective Information and Communications Technology (ICT) infrastructure and measures to support innovation, to promote creative and environmental industries. Specific plans towards such a strategy include:
Providing affordable broadband access for everyone in London. Providing support measures to mitigate the social, economic, transport and environmental costs of e-infrastructure works such as ducting and installing wireless computing equipment. E-enabling new residential and commercial developments. Specific measures of e-enabling include making provisions for ducts, incorporating fiber cables in the design and more. Providing high quality yet affordable business premises and incubator units that promote business and increase synergy between business and research
The London plan recognizes tourism as a growth sector and aims to enhance London’s image as an attractive tourism destination. The plan also pays attention to developing key infrastructure projects and supporting bids for other major international events. Environmental industries are another key growth area for the future. The London plan envisages support in the form of funding, market development, promotions, land use policies and more to encourage such industries. It promotes the development of environmental friendly business clusters and targets sustainable methods such as recycling to process 85 per cent of London’s waste within its boundaries to generate green business opportunities. Such initiatives aim to develop London’s economy and make it the world capital of business.

Boston MA
A global city, Boston is placed among the top 30 most economically powerful cities in the world. Encompassing $363 billion, the Greater Boston metropolitan area has the sixth-largest economy in the country and 12th-largest in the world. Boston’s colleges and universities exert a significant impact on the regional economy. Boston attracts more than 350,000 college students from around the world, who contribute more than US$4.8 billion annually to the city’s economy. The area’s schools are major employers and attract industries to the city and surrounding region. The city is home to a number of technology companies and is a hub for biotechnology, with the Milken Institute rating Boston as the top life sciences cluster in the country. Boston receives the highest absolute amount of annual funding from the National Institutes of Health of all cities in the United States. The city is considered highly innovative for a variety of reasons, including the presence of academia, access to venture capital, and the presence of many high-tech companies. The Route 128 corridor and Greater Boston continue to be a major center for venture capital investment and high technology remains an important sector. Tourism also composes a large part of Boston’s economy, with 21.2 million domestic and international visitors spending $8.3 billion in 2011; excluding visitors from Canada and Mexico, over 1.4 million international tourists visited Boston in 2014, with those from China and the United Kingdom leading the list. Boston’s status as a state capital as well as the regional home of federal agencies has rendered law and government to be another major component of the city’s economy. The city is a major seaport along the East Coast of the United States and the oldest continuously operated industrial and fishing port in the Western Hemisphere.
The financial services industry is important to Boston, especially involving mutual funds and insurance. In the 2017 Global Financial Centers Index, Boston was ranked as having the ninth-most competitive financial center in the world and the fourth-most competitive in the United States. Boston-based Fidelity Investments helped popularize the mutual fund in the 1980s and has made Boston one of the top financial centers in the United States. The city is home to the headquarters of Santander Bank, and Boston is a center for venture capital firms. State Street Corporation, which specializes in asset management and custody services, is based in the city. Boston is a printing and publishing center. Houghton Mifflin Harcourt is headquartered within the city, along with Bedford-St. Martin’s Press and Beacon Press. Pearson PLC publishing units also employ several hundred people in Boston. The city is home to three major convention centers—the Hynes Convention Center in the Back Bay, and the Seaport World Trade Center and Boston Convention and Exhibition Center on the South Boston waterfront. The General Electric Corporation announced in January 2016 its decision to move the company’s global headquarters to the Seaport District in Boston, from Fairfield, Connecticut, citing factors including Boston’s preeminence in the realm of higher education. Boston is home to the headquarters of several major athletic and footwear companies including Converse, New Balance, and Reebok. Rockport, Puma and Wolverine World Wide, Inc. headquarters or regional offices are located just outside the city.

Washington DC
Washington has a growing, diversified economy with an increasing percentage of professional and business service jobs. The gross state product of the District in 2010 was $103.3 billion, which would rank it No. 34 compared to the 50 states. The gross product of the Washington Metropolitan Area was $435 billion in 2014, making it the sixth-largest metropolitan economy in the United States. Between 2009 and 2016, GDP per capita in Washington, D.C has consistently ranked on the very top among U.S. states. In 2016, at $160,472, its GDP per capita is almost three times as high as that of Massachusetts, which ranked second place in the country. As of June 2011, the Washington Metropolitan Area had an unemployment rate of 6.2%; the second-lowest rate among the 49 largest metro areas in the nation. The District of Columbia itself had an unemployment rate of 9.8% during the same time period. In December 2017, 25% of the employees in Washington, D.C., were employed by a federal governmental agency. This is thought to immunize Washington, D.C., to national economic downturns because the federal government continues operations even during recessions. Many organizations such as law firms, defense contractors, civilian contractors, nonprofit organizations, lobbying firms, trade unions, industry trade groups, and professional associations have their headquarters in or near Washington, D.C., in order to be close to the federal government. Tourism is Washington’s second-largest industry. Approximately 18.9 million visitors contributed an estimated $4.8 billion to the local economy in 2012. The District also hosts nearly 200 foreign embassies and international organizations such as the World Bank, the International Monetary Fund (IMF), the Organization of American States, the Inter-American Development Bank, and the Pan American Health Organization. In 2008, the foreign diplomatic corps in Washington employed about 10,000 people and contributed an estimated $400 million annually to the local economy. The District has growing industries not directly related to government, especially in the areas of education, finance, public policy, and scientific research. Georgetown University, George Washington University, Washington Hospital Center, Children’s National Medical Center and Howard University are the top five non-government-related employers in the city as of 2009. According to statistics compiled in 2011, four of the largest 500 companies in the country were headquartered in the District. In the 2017 Global Financial Centers Index, Washington was ranked as having the 12th most competitive financial center in the world, and fifth most competitive in the United States (after New York City, San Francisco, Chicago, and Boston).

New York NY
The economy of New York City encompasses the largest municipal and regional economy in the United States. Anchored by Wall Street in Lower Manhattan, New York City has been characterized as the world’s premier financial center. It is home to the New York Stock Exchange and NASDAQ, the world’s two largest stock exchanges by both market capitalization and trading activity. In 2012, the New York metropolitan area generated a gross metropolitan product (GMP) of over US$1.33 trillion. The Combined Statistical Area produced a GMP of over US$1.55 trillion. Both are ranked first nationally by a wide margin and being roughly equivalent to the GDP of South Korea. The city’s economy accounts for most of the economic activity in both the states of New York and New Jersey. Manhattan is the nation’s leading center of banking, finance, and communication. It is home to the New York Stock Exchange (NYSE) on Wall Street. Many of the world’s largest corporations are headquartered in Manhattan. The borough contained over 500 million square feet (46.5 million m2) of office space in 2015. This makes it the largest office market in the United States. Midtown Manhattan, with nearly 400 million square feet (37.2 million m2) that same year, is the largest central business district in the world. New York City is distinctive for its high concentrations of advanced service sector firms in the law, accountancy, banking and management consultancy fields. It is the top global center for the advertising industry, which is called “Madison Avenue”. Silicon Alley, is New York’s broad-spectrum high technology sphere, continues to expand. Finance, high technology, real estate, insurance, and health care all form the basis of New York’s economy. The city is also the nation’s most important center for mass media, journalism, and publishing. Also, it is the country’s preeminent arts center. Creative industries such as digital media, advertising, fashion, design and architecture account for a growing share of employment. New York City possesses a strong competitive advantage in these industries. Despite declining, manufacturing remains consequential.
The economy of the State of New York is reflected in its gross state product in 2015 of $1.19 trillion, ranking third in size behind the larger U.S. states of California and Texas. If New York State were an independent nation, it would rank as the 12th or 13th largest economy in the world, depending upon international currency fluctuations. However, in 2013, the multi-state, New York City-centered Metropolitan Statistical Area produced a gross metropolitan product (GMP) of nearly US$1.39 trillion, while in 2012, the corresponding Combined Statistical Area generated a GMP of over US$1.15 trillion, both ranking first nationally by a wide margin and behind the GDP of only twelve nations and eleven nations, respectively. New York City and the surrounding New York metropolitan area dominate the economy of the state. Manhattan is the leading center of banking, finance, and communication in the United States and is the location of the New York Stock Exchange (NYSE) on Wall Street. Many of the world’s largest corporations locate their home offices in Manhattan or in nearby Westchester County. Manhattan contained over 500 million square feet (46.5 million m2) of office space in 2015, making it the largest office market in the United States, while Midtown Manhattan, with nearly 400 million square feet (37.2 million m2) in 2015, is the largest central business district in the world. The state also has a large manufacturing sector, which includes printing and publishing and the production of garments, furs, railroad rolling stock, and bus line vehicles. Some industries are concentrated in upstate locations also, such as ceramics and glass (the southern tier of counties), microchips and nanotechnology (Albany), and photographic equipment (Rochester). New York’s agricultural outputs comprise dairy products, cattle and other livestock, vegetables, nursery stock, and apples.
Program Benefits
Customer Service
- Customer experience
- Stakeholder improvement
- Customer care
- Collaborative research
- Collective integration
- Continuous improvement
- Knowledge sharing
- Interactive communication
- Process improvement
- Proactive analysis
Operations
- Process decentralization
- Performance improvement
- Process improvement
- Time effective
- Cost effective
- Performance analysis
- Continuous improvement
- Quality management
- Project execution
- Interactive research
Management
- Stakeholder performance
- Improved information
- Proactive decision-making
- Effective globalization
- Global localization
- Collaborative research
- Process improvement
- Performance improvement
- Effective leadership
- Litigation reduction
Testimonials
Healthcare
“Appleton Greene does not provide solutions, they enable their clients to find the right solutions. This is achieved by an innovative and flexible approach to learning which is refreshing. Knowledge is transferred through the implementation of tangible business processes, which are sensitive to ever-changing client requirements. The experience is rewarding.”
A quotation taken from a client reference within the Healthcare industry.

Education
“Empowerment is the art of corporate training. If we are able to make people feel empowered through knowledge transfer then they are better equipped to progress. Appleton Greene embodies empowerment as an integral part of all of their programs and this is what makes them so appealing.”
A quotation taken from a client reference within the Education industry.

Pharmaceutical
“As an industry, we are used to investing heavily in long-term product development. We also accept that the majority of products which we develop in will never be produced. We accept that as long as a few products are commercially viable, then this will usually provide our organization with sufficient profit contribution for business sustainability. However, our investment in various Appleton Greene programs has in all cases provided a tangible return on investment. This is simply because they are all targeted towards improving business processes and any improvement, no matter how small, is instantly felt and appreciated.”
A quotation taken from a client reference within the Pharmaceutical industry.

Biotechnology
“Appleton Greene appears to attract very creative and imaginative people and then provides them with a structured approach to product development and implementation. This must be a very rewarding experience for it’s trainers and consultants. Anything that helps our employees to tap into their creative side is always welcome and it certainly helps sometimes if this is initiated using an independent external perspective.”
A quotation taken from a client reference within the Biotechnology industry.

Manufacturing
“Successful growth on a global scale is determined by the quality of strategic partnering or strategic alliance management. Appleton Greene has been a real find in terms of corporate training services because their flexibility and international coverage makes them a valuable asset to have.”
A quotation taken from a client reference within the Manufacturing industry.
More detailed achievements, references and testimonials are confidentially available to clients upon request.
Client Telephone Conference (CTC)
If you have any questions or if you would like to arrange a Client Telephone Conference (CTC) to discuss this particular Unique Consulting Service Proposition (UCSP) in more detail, please CLICK HERE.