
Sales Enablement – Workshop 1 (Enablement Diagnostics)

The Appleton Greene Corporate Training Program (CTP) for Sales Enablement is provided by Mr. Oluwole Certified Learning Provider (CLP). Program Specifications: Monthly cost USD$2,500.00; Monthly Workshops 6 hours; Monthly Support 4 hours; Program Duration 12 months; Program orders subject to ongoing availability.
If you would like to view the Client Information Hub (CIH) for this program, please Click Here
Learning Provider Profile
Mr. Oluwole, MBA, is a Certified Learning Provider at Appleton Greene. He has strategic sales leadership experience in B2C and B2B sales for businesses focused on services, products and/or technology. In the course of his experience over the last 2 decades, he has successfully helped mid to large sized enterprises significantly improve and increase their sales by as much as 10X initial sales figures.
In addition to his strategic sales leadership experience, he also has hands-on experience working in key sales functional areas include core sales, business development, marketing, sales operations, customer services and sales enablement. This deep and wide perspective gives Mr. Oluwole an optimum blend of strategic foresight and practical relevance needed for making a sales organization function like a well-oiled machine.
Over the years of working either as a consultant, a board director or as a member of senior leadership teams, Mr. Oluwole has consistently helped these organizations achieve and surpass sales goals while improving their overall sales culture; as demonstrated by higher team member experience and retention results.
Working across 3 continents – Africa, Middle East, and North America, Mr. Oluwole has gained industry experience within the following sectors: healthcare, management consulting, technology, financial services, and telecommunications. He has also been privileged to work in the sales and business development functions of global firms such as Deloitte & KPMG.
Mr. Oluwole is a firm believer the people are the only sustainable source of competitive advantage for any organization, and he has dedicated over 20 years of his life to enabling people demonstrate the required knowledge, skills and behaviours needed to realize their potentials and help their organizations prosper.
As a certified trainer and executive coach, he is able to effectively design programs that effectively enlighten participants but also shift their mindsets to create new and better ways of working. A notable trademark of his programs are the high engagement rate and high impact rates that participants report during and after the program.
In addition to his professional leadership experience, he is also an active mentor, teacher, and community leader, consistently finding ways to help people experience their full potentials.

MOST Analysis

Mission Statement
Legendary management consultant Peter F Drucker is credited with saying ‘What gets measured, gets improved”. This statement underlines the important of evaluating key elements of an organization as this evaluation provides insights on the current state and initiates conversations on what needs to change for things to improve.
This premise explains the reason for the mission of this first workshop: To use a series tools and techniques to understand the current state of your sales organization (what we like to call SalesGroup) and to understand what needs to change from a sales enablement perspective. This workshop also helps you establish the baseline for evaluating the future impact of your sales enablement function. This helps to justify the past investments into sales enablement and a convincing business case for future investments.
While a number of the diagnostic areas may be part of what you are already measuring and reporting within your organization, what this workshop provides is a holistic approach to evaluating all the moving pieces involved in running an effective sales organization. The Diagnostic Dimensions we will be covering in the workshop will touch on both elements of your sales organization that have to do with what you might call ‘core sales’ as well as the other elements of your sales organization which you may refer to as ‘sales support’.
Beyond the empirical data that this workshop will provide you across the different diagnostic dimensions, it will also further strengthen your organization’s approach to system thinking. Helping you and your organization better appreciate how intricately connected your sales organization is and how adjustment in one area needs to be done with complete awareness of how that change will impact other areas of your sales organization.
The intention of this workshop is to reinforce the things that you are most likely already aware of regarding sales enablement, so you can further benefit from doing those things. The workshop will also bring some new concepts and insights to you, offering you a fresh perspective on things so you are able to complement what you already know with these new concepts and insights.
Ultimately this workshop is aimed to introduce you to the key elements of a vibrant sales enablement function, so you are beginning to familiarize yourself with them and establishing a well-grounded understanding of where your organization is at the moment. The workshop is designed to produce new business methodologies and mindset within your sales organization, so it is truly enabled to close more deals, faster.

Objectives
01. SalesGroup Definition: departmental SWOT analysis; strategy research & development. Time Allocated: 1 Month
02. Team Diagnostics: departmental SWOT analysis; strategy research & development. Time Allocated: 1 Month
03. Target Diagnostics: departmental SWOT analysis; strategy research & development. Time Allocated: 1 Month
04. Productivity Diagnostics: departmental SWOT analysis; strategy research & development. Time Allocated: 1 Month
05. Content Diagnostics: departmental SWOT analysis; strategy research & development. Time Allocated: 1 Month
06. Training Diagnostics: departmental SWOT analysis; strategy research & development. Time Allocated: 1 Month
07. Technology Diagnostics: departmental SWOT analysis; strategy research & development. 1 Month
08. Value Diagnostics: departmental SWOT analysis; strategy research & development. Time Allocated: 1 Month
09. Volume Diagnostics: departmental SWOT analysis; strategy research & development. Time Allocated: 1 Month
10. Velocity Diagnostics: departmental SWOT analysis; strategy research & development. Time Allocated: 1 Month
11. Variety Diagnostics: departmental SWOT analysis; strategy research & development. Time Allocated: 1 Month
12. Vitality Diagnostics: departmental SWOT analysis; strategy research & development. Time Allocated: 1 Month

Strategies
01. SalesGroup Definition: Each individual department head to undertake departmental SWOT analysis; strategy research & development.
02. Team Diagnostics: Each individual department head to undertake departmental SWOT analysis; strategy research & development.
03. Target Diagnostics: Each individual department head to undertake departmental SWOT analysis; strategy research & development.
04. Productivity Diagnostics: Each individual department head to undertake departmental SWOT analysis; strategy research & development.
05. Content Diagnostics: Each individual department head to undertake departmental SWOT analysis; strategy research & development.
06. Training Diagnostics: Each individual department head to undertake departmental SWOT analysis; strategy research & development.
07. Technology Diagnostics: Each individual department head to undertake departmental SWOT analysis; strategy research & development.
08. Value Diagnostics: Each individual department head to undertake departmental SWOT analysis; strategy research & development.
09. Volume Diagnostics: Each individual department head to undertake departmental SWOT analysis; strategy research & development.
10. Velocity Diagnostics: Each individual department head to undertake departmental SWOT analysis; strategy research & development.
11. Variety Diagnostics: Each individual department head to undertake departmental SWOT analysis; strategy research & development.
12. Vitality Diagnostics: Each individual department head to undertake departmental SWOT analysis; strategy research & development.

Tasks
01. Create a task on your calendar, to be completed within the next month, to analyse SalesGroup Definition.
02. Create a task on your calendar, to be completed within the next month, to analyse Team Diagnostics.
03. Create a task on your calendar, to be completed within the next month, to analyse Target Diagnostics.
04. Create a task on your calendar, to be completed within the next month, to analyse Productivity Diagnostics.
05. Create a task on your calendar, to be completed within the next month, to analyze Content Diagnostics.
06. Create a task on your calendar, to be completed within the next month, to analyse Training Diagnostics.
07. Create a task on your calendar, to be completed within the next month, to analyse Technology Diagnostics.
08. Create a task on your calendar, to be completed within the next month, to analyse Value Diagnostics.
09. Create a task on your calendar, to be completed within the next month, to analyze Volume Diagnostics.
10. Create a task on your calendar, to be completed within the next month, to analyse Velocity Diagnostics.
11. Create a task on your calendar, to be completed within the next month, to analyse Variety Diagnostics.
12. Create a task on your calendar, to be completed within the next month, to analyse Vitality Diagnostics.
Introduction

Overview
As described in the Client Information Hub, a simple definition of the Sales Enablement Program is ‘anything you can do to help your salespeople close more deals, faster’. And to help clarify what ‘anything’ means, we highlighted two more detailed definitions of Sales Enablement:
“A STRATEGIC, ONGOING process that equips all client-facing employees with the ability to consistently and systematically have a valuable conversation with the right set of customer stakeholders at each stage of the customer’s problem-solving life cycle to optimize the return on investment of the selling system.” (by Forrester)
““The ACTIVITIES, SYSTEMS, PROCESSES, AND INFORMATION that support and promote knowledge-based sales interactions with client and prospects.” (by Gartner)
Taking a more critical look at the words in block letters for the two definitions above, it is clear to see that there are many different elements involved in providing a wholistic sales enablement support to your team so they can close more deals, faster. One might even argue that an effective sales enablement function will literally touch every single part of your sales organization.
This Enablement Diagnostics workshop has been designed to help you appreciate the wide scope of sales enablement by providing you with a structured way to review the key elements of your sales organization or your ‘SalesGroup’ as we to call it in this Program.
The importance of this Enablement Diagnostics workshop is that it helps you to assess the current state of your SalesGroup using an abridged SWOT analysis technique. You will be able to identify your strengths and areas of development. You will also have a better idea of how to leverage opportunities and manage threats in your ecosystem based on the understanding that you will develop as you go through the course modules.
At the end of the module, you would have completed an Enablement Diagnostic Scorecard which would be a blueprint for understanding your current state and a baseline for evaluating the impact of your sales enablement function as you implement the things you learn through this program. The new business processes will be specific to each of the Diagnostic Dimensions in the scorecard. This way, you are able to directly see the impact of your sales enablement function across these dimensions.

Planning
To achieve these workshop objectives described above, it is important that you take the time to plan and prepare.
As you plan for this workshop, here are the specific activities you should undertake. These have been grouped by along each of these enablement diagnostic dimensions, so it is easier for you to follow along:
1. SalesGroup Definition: This first diagnostic dimension is aimed at helping you identify your SalesGroup i.e. all the members of your organization that have interacted with prospects or customers. The best way to do this is by mapping out your Customer Journey which refers to the different stages your customer goes through from becoming aware of your product or service, to buying it and then to realizing value so they become your advocate. You will be guided on how to map this during the workshop. To help you plan, consider the following steps:
a. Obtain existing documents and materials about your customer journey.
b. Identify the different teams within your organization that interact with prospects and customers at each stage along this journey.
c. Note this as your Draft SalesGroup. We will work on this later on and during the workshop
2. Team Diagnostics: this Diagnostic Dimension will be guiding you to some initial analysis on the teams that you identified as being part of your Draft SalesGroup. The analysis will be along these 3 elements – organization structure, workforce analysis and team culture review. Here are the specific planning steps you are required to take:
a. Organization Structure: obtain copies of approved organograms for the teams within the SalesGroup. Speak with relevant leaders of those teams and relevant human resources/people support teams to confirm the organograms are complete and recent.
b. Workforce Analysis: obtain information and reports on the number of team members within each of the teams within the SalesGroup. Also obtain information and reports regarding the current competency level of the team members within the SalesGroup. The competency levels should consist of the current knowledge, skills and behaviours of each team or team member.
c. Team Culture: work with the relevant persons within your HR/People teams to obtain any information about the culture of your SalesGroup. This could be in form of employee experience or employee satisfaction surveys. It could also be from any other employee feedback mechanism within your organization. In an ideal world, it would be a report from a 3rd party firm distilling all these data points to articulate what the culture within the SalesGroup looks like. Considering the significant impact that COVID had on organization cultures, it is best to consider any data source from 2022 onwards.
3. Target Diagnostics: this Diagnostic Dimension is focused on helping you understand your organization’s current processes around target setting, target measuring and rewarding achievement of targets. To help you plan for this diagnostic review, here are the specific steps to take:
a. Definition: obtain documentation and other materials that describe the processes and activities your organization undertakes in allocating accounts and defining targets for the SalesGroup.
b. Monitoring & Reporting: obtain documentation and other relevant materials related to how the leaders within the SalesGroup monitor and report on the achievement against these targets.
c. Reward & Recognition: obtain documentation and other relevant materials that describe how target achievement is recognized and rewarded.
4. Productivity Diagnostics: in this Diagnostic Dimension you will be performing some activities to analyze the enablement processes you have in place for new hires and new promotes (those who are recently promoted). The analysis will be done by comparing the productivity levels of these new hires/new promotes with the productivity levels of your top 20% team members performing the same role or similar role. To plan for this activity, the information you would need to gather are defined as follows:
a. Productivity Metrics: obtain documentation and relevant information around the key productivity metrics by which the team members are measured. The metrics should be a minimum of2 and a maximum of 5 to get the best of the analysis.
b. Identify Recent Hires/Promotes: obtain information on the recent hires and recent promotes. Information includes name, job title, date of joining.
c. Identify your Top 20% Performers: obtain information on the team members whose performance outrank the rest along the lines of the productivity metrics you identified in step (a) above. Information includes, name, job title, performance levels along the identified metrics.
5. Content Diagnostics: for this diagnostic dimension, you will be conducting a preliminary analysis on the effectiveness of the content and collateral you provide to your SalesGroup. This is to help you identify what is working and what needs to be improved. To plan for this diagnostic review, relevant information and materials will be required. These include:
a. Confirm Access to Content: be sure you have access to the two broad categories of content provided to the SalesGroup:
• External Content: this refers to content intended for includes collateral such as white papers, marketing communications, blog posts and buyer guides.
• Internal Content: this includes playbooks, selling scripts, ideal customer profile/persona.
b. Identify the Feedback Channels: decide what channels you want to use to obtain feedback on both the external and internal content. Some potential feedback sources you could consider include:
• Asking prospects/customers
• Asking members of your SalesGroup who use the content.
• Leveraging technology tools and systems to measure how well the intended audiences engage with the content.
6. Training Diagnostics: in this diagnostic dimension, you will be conducting a preliminary analysis on the effectiveness of the training services provided to your SalesGroup in helping them advance prospects along the customer journey. This will also help you identify what is working and what needs to be improved on. Planning for this diagnostic review will include the following steps:
a. Confirm Training Delivery Channels: Confirm the different types of training delivery channels that you have within your organization. For most organizations. There are broadly two training delivery channels:
• Live Training Sessions: where people come together either in-person or virtual to run a live training session, facilitating cross-learning and collaboration.
• On-Demand Training: where people can access training content at their own time and pace their learning. Usually with the aid of some technology tool or platform.
b. Identify the Feedback Channels: decide what channels you want to use to obtain feedback on the training services. Some channels to consider include:
• Training feedback surveys either completed at the end of the live sessions or completed at the end of the on-demand course.
• Speaking to members of the SalesGroup who the target audience for the training services are.
7. Technology Diagnostics: this dimension of the Sales Enablement diagnostic is focused on conducting a wholistic assessment of the technology tools and systems provided to your SalesGroup to determine their overall effectiveness. Planning for this diagnostic review includes the following steps:
a. Obtain any documentation and/or information on the technology and tools requirements of the SalesGroup i.e. what they need an ideal tool to do to effectively support them in their core duties.
b. Obtain a list of all the technology tools and systems available to support your SalesGroup. Be sure to cover those that are used solely by the SalesGroup as well that those that are more enterprise wide in nature but directly related to the core duties of the SalesGroup.
c. Obtain high-level information or documentation on the features and functionalities of these tools/systems.
8. Value Diagnostics: this diagnostic dimension is the first of 5 dimensions that seek to assess the direct impact of sales enablement on the pipeline. All through the Sales Enablement program, we will refer to these 5 dimensions as the ‘5-V Framework’. Value refers to the financial amount associated with the opportunities in the pipeline. Here are some steps to take as you plan to conduct this diagnostic review:
a. Obtain information about the financial targets for the SalesGroup over the last 12-24 months.
b. Obtain information about the actual financial numbers for the SalesGroup over the same time frame you selected above.
9. Volume Diagnostics: continuing through the 5-V Framework, this diagnostic dimension, Volume, also looks at the impact of sales enablement on the pipeline. Volume refers to the total number of opportunities within the pipeline. It helps to give a picture of how strong the pipeline is and how likely the SalesGroup is to achieve their targets based on established conversion rates. Planning for this diagnostic review consists of the following steps:
a. Identify 2 key stages along your sales process. These stages will be the anchor you will be using to establish the number of opportunities at that stage of the sales process. Ideally, one will be at the ‘midpoint’ of the sales process and the other will be at the ‘endpoint’ of the sales process.
b. Decide on a point in time to assess the pipeline. This could be end of previous year or mid-way into current year.
c. Obtain information on the target for the number of opportunities that were expected to be at the midpoint and endpoint of your sales process for the specific point in time that you have decided on.
d. Obtain information on the actual number of opportunities that were recorded at the midpoint and endpoint of your sales process for the same point in time that you decided on.
10. Velocity Diagnostics: this is the 3rd diagnostic dimension in the 5V Framework aimed at assessing the impact of sales enablement on the pipeline. Velocity refers to measuring how quickly opportunities are progressing through the sale stages, as these cumulatively result in the sales cycle for the opportunities. To conduct this diagnostic review, you will need to perform the following planning steps:
a. Identify 3 key stages along your sales process. These stages will be the anchor you will be using to establish velocity from one point to another within your sales process. Here are the 3 points to identify:
• The Starting Point – which is basically where you consider to be the beginning of your pipeline or top of funnel.
• The Midpoint – which will be somewhere midway in the sales process or mid-funnel.
• The Endpoint – which will be at the end of the sales process, which is typically when the deal is won.
b. Decide on the unit of measurement you will be using to measure how long an opportunity stays within a stage before moving to the next stage. This could be either days, weeks, or months – depending on the average duration of your sales cycle.
c. Also decide on the time horizon you would be using the assessment. Ideally this should be somewhere within the last 6 to 24 months. This will also be informed by your average sales cycle.
d. Obtain information on the expected average duration of deals that moved from the:
• Starting Point to the Midpoint within the defined time horizon
• Midpoint to the Endpoint within the defined time horizon
e. Obtain information on the actual average duration of deals that moved the:
• Starting Point to the Midpoint within the defined time horizon
• Midpoint to the Endpoint within the defined time horizon
11. Variety Diagnostics: in this diagnostic dimension, we will continue to explore the 5V – Framework. Variety refers to the mix or diversity in your pipeline. This diversity could either in form of customer types or market segments. It is aimed at helping you hedge potential risks when a pipeline is over dependent on a particular market segment or customer type. Planning to conduct this variety diagnostics will involve the following steps:
a. Identify 2 key stages along your sales process. These stages will be the anchor you will be using to establish the variety of the pipeline at that stage of the sales process. Ideally, one will be at the ‘midpoint’ of the sales process and the other will be at the ‘endpoint’ of the sales process.
b. Decide on the time horizon you would be using the assessment. Ideally this should be somewhere within the last 6 to 24 months. This will be informed by your average sales cycle.
c. Define what you think an Ideal Variety Level (IVL) should be for the pipeline at this midpoint and endpoint. This variety could be either based on geographic spread, industry type or company size. Label these at:
• IVL at Midpoint
• IVL at Endpoint
d. Obtain information on the Current Variety Level (CVL) of your pipeline at the midpoint and endpoint stages. Label these as:
• CVL at Midpoint
• CVL at Endpoint
12. Vitality Diagnostics: this is the final diagnostic dimension in the 5V Framework aimed at assessing the impact of sales enablement on the pipeline. Vitality refers to measuring the likelihood to win a deal by tracking the conversion rates at different stages along the pipeline. It aims to assess how much ‘life’ is in the pipeline along the sales cycle. To conduct this diagnostic review, you will need to perform the following planning steps:
a. Identify 3 key stages along your sales process. These stages will be the anchor you will be using to determine conversion rates along your sales process. Here are the 3 points to identify:
• The Starting Point – which is basically where you consider to be the beginning of your pipeline or top of funnel.
• The Midpoint – which will be somewhere midway in the sales process or mid-funnel.
• The Endpoint – which will be at the end of the sales process, which is typically when the deal is won.
b. Decide the time horizon you will be using to conduct the diagnostics, this could be over the last 6 months, 12 months or 24 months – depending on the average length of your sales cycle.
c. Obtain information on the number of opportunities in each of the 3 key stages you identified at the point in time you decided above.
• Number of opportunities in the Starting Point at the specified point in time
• Number of opportunities in the Midpoint at the specified point in time
• Number of opportunities in the Endpoint at the specified point in time.
d. Obtain information on what the target or assumed conversion rates are.

Development
After obtaining the relevant information and documentation for each of the diagnostic dimensions as detailed in the planning section above, you will need to spend some time reviewing and validating this information as part of this Development section.
The objective here is to further develop understanding by speaking to relevant people and teams. The specific steps in development for each diagnostic dimension are listed below:
1. Review: review the materials you have gathered as described in the planning phase to be sure there no information is missing and that you have the most up to date information.
2. Validate: where you feel some information might be missing, consider speaking to other leaders withing your sales function and the organization, people who may be able to provide additional context to give you a clearer understanding. The leaders you should consider speaking with to get a better understanding of each diagnostic dimension are listed below:
a. SVP of Sales (or equivalent role)
b. Chief Revenue Officer or Chief Growth Officer or equivalent role
c. Chief Financial Officer or Head of Financial Planning & Analysis or equivalent role
d. Chief HR Officer or Head of Compensation & Reward or equivalent role
e. Chief Strategy Officer or Head of Strategic Planning or equivalent role
f. HR Business Partner (or equivalent role)
g. Head of Individual Performance Management (or equivalent role)
h. Head of Corporate Performance Management (or equivalent role)
Management
This section is focused on highlighting the things you will need to manage as you work through the implementation steps detailed above. While some of them may be intuitive, they are listed to help you ensure that all bases are covered.
These management tips are applicable to all the Diagnostic Dimensions and should be applied as you work through each of them:
• Time Management: because this is the first of many activities and reviews along these lines, we will encourage that you are efficient with time, focusing on the big pieces and elements. During the workshop we will be going deeper on all of these Diagnostic Dimensions, so see this as your first, time-installment, with many more to come.
• Quality Management: we recognize that some of the information being requested may not be readily available at the level of detail and quality specified in the previous sections. It is encouraged that you find a point of balance on quality. Consider adopting a ‘satisfice’ approach, which is a balance between satisfied and sacrifice. The satisficed approach helps you to focus on adequate rather than perfect information or outcomes.
• Expectation Management: by extension, you are also encouraged to manage your expectations while assessing the different dimensions in the enablement diagnostics. While it is not encouraged that you be too lenient in the assessments, it is also not ideal to be too harsh. Have a realistic view of what the current situation is showing you and what you think the ideal should be, would help you have more balanced comments on your observations.
• Task Management: we recognize that you will be performing the tasks in this introduction while continuing your regular roles and responsibilities as such we encourage that you find a way to manage both tasks in parallel. While there are arguments for and against both on which to prioritize more, we believe ultimately that performing the tasks assigned through this program while delivering on your assigned role will be the best way to approach it.
• People Management: the final thing you would want to manage are the people within your organization who may not be directly part of this Sales Enablement Program, but you will need their help in validating the information or providing more context. Being respectful of their time, being cordial and acknowledging/appreciating their input will be of immense help to you not just while doing these introduction activities, but also while implementing the processes that will come through this Sales Enablement Program.

Review
As you complete your preparation for the workshop, remember that all the exercises you have done in this introduction is to get you ready for the Workshop.
We will go over many of these exercises again during the workshop. During the workshop we will explore in more detail the concepts and bodies of knowledge behind the exercises so we can benefit more from the Enablement Diagnostics.
Attempting these exercises before the workshop, will help you to be better positioned to gain even more from the workshop. This way you are fully equipped to come back to your organization and implement the new business processes that will help your SalesGroup move forward.
It is possible that conducting some of the exercises in these diagnostic dimensions could have been challenging due to unavailable information or different sales setup, we will work through these together during the workshop.
In the meantime, take some time to go through the outcome of the exercises you have completed by doing the following:
1. Review the information you obtained, the results of your computation and the observations you documented. See if there is any further refinement you would like to do.
2. Consider if there is some vital information still missing that you would like to get. Explore if there are other key stakeholders you can speak to who can point you in the direction – sometimes finding some information within an organization can be like a treasure hunt!
3. Consolidate all the documentations you have from the exercises and bring them along with you to the workshop. This will ensure you are able to move through the workshop more seamlessly and help you leave the workshop with your completed Enablement Diagnostic Scorecard.
Executive Summary

This consists of 12 chapters and a final section that provide templates of the Enablement Diagnostic Scorecard.
Chapter 1: SalesGroup Definition
This module focuses on defining the process for identifying your customer facing team members which will be considered as part of the SalesGroup. Ideally your customer facing team members will be anyone who interacts with prospects or customers during or after their buying journey. This would typically consist of team members in the following functions: marketing, core sales, business development, partnerships, customer success teams.
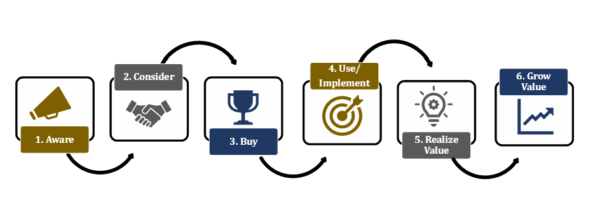
The objective of this module is to ensure that everyone interacting with your current or potential customers is included in your SalesGroup, and by extension included in the Sales Enablement Diagnostics. The steps involved in identifying the members of your SalesGroup include:
• Defining your customer’s buying journey (steps 1 to 3 in the illustration below).
• Defining your customer’s experience journey (steps 4 to 6 in the illustration below).
• Identifying the members of your team involved in both the buying and experience journeys of the customer.
• Clarifying their roles and responsibilities to inform how the enablement initiatives will impact them.

Chapter 2: Team Diagnostics
With the members of your SalesGroup identified, the first phase of the Enablement Diagnostics will focus on assessing the team dynamics of your SalesGroup. The objective of this is chapter is to review how well your SalesGroup it set up to function as a team. There are fundamental elements that every team needs to succeed, and we will be assessing your SalesGroup to see how it ranks against those elements.
The illustration below shows how the 3 elements of the Team Diagnostics come together to impact the overall effectiveness of the team.
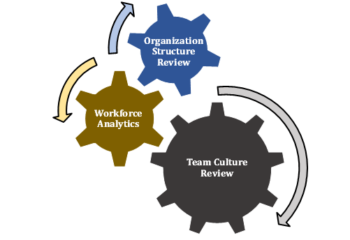
This assessment will be done along these 3 main areas:
• Organization Structure Review: – under this dimension, we will employe leading organizational design principles to analyze how your SalesGroup is structured. Specifically, we will review clarity of reporting lines, clarity of roles, chain of command (how flat the structure is) and span of control (how wide the structure is). Based on the findings from this analysis we will identify opportunities for enhancement.
• Workforce Analysis: – under this dimension, we will analyze the number of team members you have within your SalesGroup and confirm if the workforce numbers align with the overall sales targets and objectives. We will also review if the team is appropriately levelled and if the required skills and competencies exist with the team. This analysis will highlight opportunities for improvement in the workforce within your SalesGroup.
• Team Culture Review: – in this dimension, we will be working to understand the culture within your team. The best sales teams have an optimum blend of collaboration and competition. We will be analyzing where your team is on that spectrum and identifying ways to further optimize your team culture for superior performance.
The review along these dimensions will be done using the 3-point Likert Scale of Below Standards, Meets Standards, Exceeds Standards and will be become a pointer for areas of strength and opportunities for improvement.

Chapter 3: Target Diagnostics
In this dimension of the enablement diagnostic, we will be reviewing the effectiveness of the processes involved in defining, measuring, and rewarding the achievement sales targets. The objective of this dimension is to assess how many of your Sales Group members, meet or exceed their goals and targets.
While the key metric for assessing the effectiveness of a sales team is directly linked to their ability to meet targets. It is equally as important to assess the processes closely linked to the achievement of targets which starts from the very beginning of how the targets are defined to how the team members are rewarded.
The illustration below highlights the 3 main steps involved in conducting the Target Diagnostics.

The details involved in this are:
• Definition- Accounts & Targets: Review the processes involved in setting targets and allocating accounts/territories to ensure consistency in rationale and principles.
• Monitoring & Reporting: Review the processes, metrics and technologies used in tracking/measuring the achievement of targets to ensure there is clarity on when and how targets are achieved.
• Reward & Recognition: Review the processes, compensation plans and incentive schemes provided to team members who achieve target to ensure the team is being rewarded for the metrics that matter the most in a consistent and equitable manner.
The review along these dimensions will be done using the 3-point Likert Scale of Below Standards, Meets Standards, Exceeds Standards and will highlight the strengths and opportunities for enhancement in how targets are defined, measured and rewarded within your SalesGroup.

Chapter 4: Productivity Diagnostics
Based on the understanding gained from analyzing the team dynamics of your SalesGroup, this phase of the Enablement Diagnostics will focus on assessing how long it takes for your new hires or new promotes to reach ‘optimum productivity’.
Optimum productivity here refers to the average productivity levels of your top 20% performers. This average productivity level provides a useful benchmark for assessing how many weeks or months it takes your new hires or new promotes to reach that level of productivity.
The steps involved in this are illustrated below:

The details for each step are defined below:
• Define the 5 key productivity metrics you want to measure. Examples include # of qualified leads, # of qualified opportunities, % deals won, % attainment of quota, average deal cycle.
• Identify the recent hires/promotes, i.e., those who joined your team within 0 to 2 years and determine how long it took them to reach the average productivity levels of your top performers.
• Identify your top 20% performers, who have been with the SalesGroup for more than 2 years and determine their average productivity levels based on the 5 metrics you defined above.
• Benchmark recent hires against your top performers to identify how many of your new hires are now performing at a similar productivity level as your top performers and note how long they have been with the organization.
• The benchmark will be done using the 3-point Likert Scale of Below Standards, Meets Standards, Exceeds Standards and will be become a pointer for areas of strength and opportunities for improvement.

Chapter 5: Content Diagnostics
This enablement diagnostic focuses on understanding how your SalesGroup engages with sales collateral/assets and how it enables them to have more impactful interactions with prospects and customers. This analysis will be done mainly based on feedback from the SalesGroup.
The feedback from the SalesGroup on content services usually highlight two major concerns from sales team members: quantity and quality.

The content diagnostics will anchor on these two major areas of concern:
• Quality: we will assess the effectiveness of the content in impacting its intended audience. For external facing content, we will assess the impact of the content on prospects and customers. For internal facing content, we will assess the impact of the content on members of the Sales Group – this will provide input on what content is most impactful.
• Quantity: we will assess the amount of content available to the SalesGroup to use – what is available and what might be missing. We will also assess the SalesGroup’s ability to find the content they need in a timely and convenient manner – this will provide pointers to the effectiveness of the organization and access to content.
The review of content along the quality and quantity areas will be done using the 3-point Likert Scale of Below Expectations, Meets Expectations, Exceeds Expectations and will be become a pointer for areas of strength and opportunities for improvement.

Chapter 6: Training Diagnostics
With the understanding gained from analyzing the content, we will focus more specifically on training content and services provided to the SalesGroup. The objective of this enablement diagnostic is to understand how effective the training processes are in helping the SalesGroup advance prospects along their buying journey. This understanding will be gained mainly through analyzing feedback from the SalesGroup.
Feedback on training services usually highlight two major concerns from sales team members:
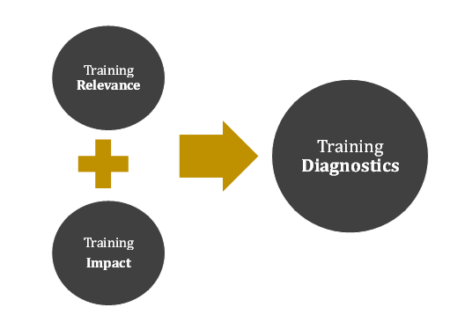
The training diagnostics will anchor on these two major areas of concern:
• Training Relevance: – this will assess how timely the training initiatives are provided in comparison to when the SalesGroup will be able to use the knowledge or skill. The closer the opportunity to apply the knowledge is to the time of training, the more relevant the training is considered to be. As the timely application of the training helps the SalesGroup consolidate on the learning.
• Training Impact: – this refers to how well the content has been curated and the effectiveness of the mode of delivery. This will assess training initiatives leverage the different ways that your SalesGroup prefers to learn including reading, listening, observing, and doing. The more these different learning models are incorporated into the training programs, the more the impact.
The review of training along the relevance and impact areas will be done using the 3-point Likert Scale of Below Standards, Meets Standards, Exceeds Standards and will be become a pointer for areas of strength and opportunities for enhancement.

Chapter 7: Technology Diagnostics
Although technology can be a great enabler for your SalesGroup, if there is no strategic approach to the purchase and use of technology, it may create more chaos than clarity. As such, this enablement diagnostic is designed to review the tools and technologies you have in place to support your sales and sales enablement activities.
Your sales technology stack will be assessed against the Sales Technology Assessor which consists of the assessment areas illustrated below:
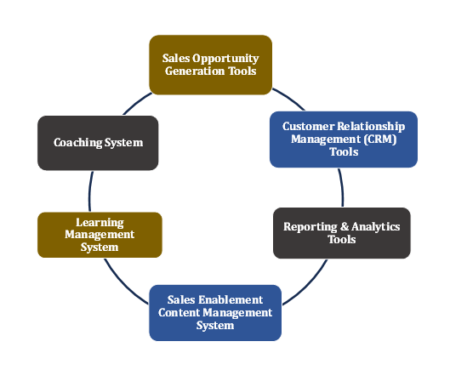
• Sales Opportunity Generation Tools: – these include technologies and tools that support outbound & inbound marketing activities, tools that highlight prospect’s potential interests and track your top of funnel interactions with prospects.
• Customer Relationship Management (CRM) Tool: – this is a platform used to create an integrated experience for managing all of your organization’s relationships and interactions with prospects and customers. Ultimately it aims to improve business relationships in order to improve business outcomes.
• Reporting & Analytics Tools: – this refers to a suite of tools designed to help you identify, collect, and analyze relevant data across your customer’s buying journey. This data can be reported on and used to generate insights that will guide improvement of different elements of the SalesGroup’s activities.
• Sales Enablement Content Management System: this refers to a technology designed to help your sales enablement function provide content to your SalesGroup in an organized, intuitive, and user-friendly way. While facilitating real-time feedback on your most effective content.
• Learning Management System: this is a tool designed to develop, deliver, and track adoption of learning materials among the members of your SalesGroup.
• Coaching System: this refers to a suite of tools that are well integrated with other items in your tech stack especially the CRM and the Reports/Analytics tools. The Coaching System would typically leverage AI to identify potential coaching opportunities for an individual or team.
The assessment will incorporate the standards for your industry/market and ranked along the 3-point Likert Scale of Below Standards, Meets Standards, Exceeds Standards. The specific steps of the assessment are:
• Completeness Check: this is focused on identifying which technology tools already present in your tech stack and which ones need to be included.
• Functionality Check: this is focused on ensuring the technology tools you have meet the functional requirements needed for your SalesGroup to achieve their goals.
• Integration Check: this is focused on reviewing how integrated your technology tools are to assess how seamless the workflow and dataflow is. The more seamless it is, the more efficient your SalesGroup will function and the better their user experience will be.
The ranking along the scale will highlight areas of strength and opportunities for enhancement.

Chapter 8: Value Diagnostics
Ultimately, the impact the sales enablement function has on your SalesGroup needs to be seen in your sales pipeline. Accordingly, this and the next four enablement diagnostic areas will be focusing on the pipeline. We will be using the 5V (Value, Volume, Velocity, Variety, Vitality) Framework to assess the pipeline.
The first one, Value within the 5V Framework is illustrated below:
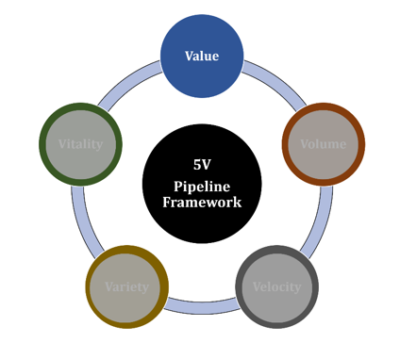
Value refers to the financial amount of the opportunities in your pipeline. It aims to assess the overall amount and use this to establish a baseline for evaluating how the roll out of the enablement initiatives will impact this attribute of your pipeline over time.
Depending on the maturity of your sales processes and the clarity around your forecasting method, determining the total pipeline value should not be a very complicated process. The most important point at this stage is to ensure that the approach used to determine the amount needs to be the same approach consistently applied going forward so it is easy to see the impact of enablement.
The assessment will be done by comparing the actual value to a target value which had been defined for the SalesGroup. This will be ranked along a 3-point Linkert Scale as follows:
• Below Expectation: the actual value is lower than the target value.
• Meets Expectation: the actual value is equal to the target value.
• Exceeds Expectation: the actual value is higher than the target value.
This becomes the baseline to assess the impact of the sales enablement function as part of future sales enablement performance reviews.

Chapter 9: Volume Diagnostics
This is the second enablement diagnostic that is linked to assessing how the enablement function is equipping your SalesGroup and impacting your sales pipeline. Volume within the 5V Framework is illustrated below:
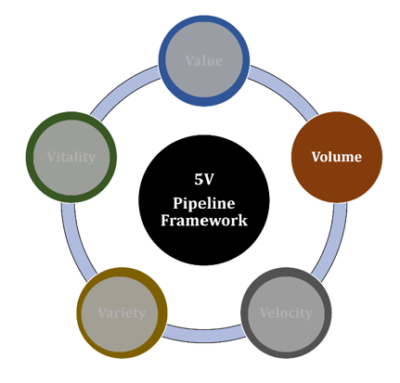
Volume refers to the total number of opportunities in the pipeline as certain stages in the sales cycle. It helps to give a sense of how strong the pipeline and how likely the SalesGroup is to achieve their targets based on established conversion rates.
Based on your internal alignments you will have a specific stage in your sales process where an opportunity is considered as the ‘midpoint’ in your sales cycle. This could be either a Sales Qualified Lead (SQL) or a Sales Qualified Opportunity (SQO). The important thing is to be consistent in using this same stage going forward.
This is the point where all opportunities in that stage are counted to determine the Volume at Midpoint. The other data point used in this diagnostic area is the number of opportunities that are Closed Won. This becomes the Volume at Endpoint.
The assessment is then conducted comparing these actual volumes to target volumes which ideally would have been defined as a target for the sales group. This will be ranked along a 3-point Linkert Scale as follows:
• Below Expectation: both actual volume at midpoint and endpoint are lower than the target volumes at both points respectively.
• Meets Expectation: one of the actual volumes at either midpoint or endpoint is equal to the target volume for that specific point.
• Exceeds Expectation: both actual volume at midpoint and endpoint are higher than the target volumes at both points respectively.
This becomes the baseline to assess the impact of the sales enablement function as part of future sales enablement performance reviews.

Chapter 10: Velocity Diagnostics
This enablement diagnostic also focuses on the impact of sales enablement initiatives on the SalesGroup and the follow-on impact on sales pipeline. Velocity within the 5V Framework is illustrated below:
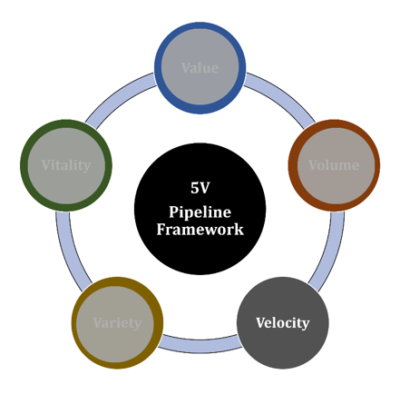
Velocity refers to how quickly opportunities are progressing through the sales stages as these cumulatively result in the sales cycle for the opportunities. Recognizing that this will be different for each individual opportunity, the approach will be to find the average velocity for the opportunities.
Based on internal alignment, you would ideally have an ideal sales cycle which is the overall duration you would like an opportunity to take before it is closed and won. In a situation where you have an even more evolved sales process, and you would have defined the target average duration you expect for an opportunity at each stage. Whatever the situation might be, what is more important is the approach used to determine this initial velocity is what will be used going forward, to ensure a consistent basis for comparison. If this is not available, we will work together to define this for your organization.
The assessment is then conducted comparing the actual average velocity of the deals to the target average velocity. This will be ranked along a 3-point Linkert Scale as follows:
• Below Expectation: the actual average velocity is higher than the target average velocity.
• Meets Expectation: the actual average velocity is equal to the target average velocity.
• Exceeds Expectation: the actual average velocity is lower than the target average velocity.
This becomes the baseline to assess the impact of the sales enablement function as part of future sales enablement performance reviews.

Chapter 11: Variety Diagnostics
This is another enablement diagnostic that seeks to evaluate the impact of the enablement function on the SalesGroup and how this impacts the pipeline. Variety within the 5V Framework is illustrated below:

Variety refers to the markets/customer mix in the pipeline. The dimensions for assessing variety may vary based on your organization’s preference and objectives. Some of the more common dimensions for assessing variety include industry, size of company, geographical location, etc. The importance of having an Ideal Variety Level, is that it helps your organization hedge its risks against potential fluctuations in the markets/customers you are currently selling to.
Ideally, you would have defined your target pipeline variety and the basis for making this definition will need to be consistently applied going forward so this creates a reliable benchmark for the future. If this is not available, we will work together to define this for your organization.
The assessment is then conducted comparing the actual pipeline variety with your target pipeline variety. This will be ranked along a 3-point Linkert Scale as follows:
• Below Expectation: the actual variety is lower than the target variety.
• Meets Expectation: the actual variety is equal to the target variety.
• Exceeds Expectation: the actual variety is higher than the target variety.
This becomes the baseline to assess the impact of the sales enablement function as part of future sales enablement performance reviews.

Chapter 12: Vitality Diagnostics
This is the final enable diagnostic and the fifth one related to assessing pipeline and how the sales enablement activities impact the SalesGroup so they can impact the pipeline. Vitality within the 5V Framework is illustrated below:
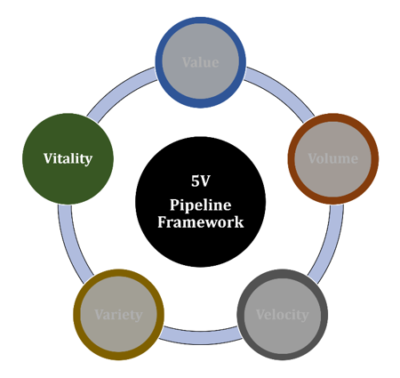
Vitality refers to the likelihood of winning the opportunity. When sales enablement is effectively delivered it should have a direct impact on the vitality of your pipeline. Recognizing ‘Vitality’ can be determined by evaluating the conversion rate as opportunities move from one stage to another. Another more simplified approach could be determine how many of the opportunities at the early sales stages were eventually won. This helps to create a percentage.
Ideally, a target vitality percentage (conversion rate) would have been defined for your pipeline. If this is not available, we will work together to define this for your organization.
The assessment is then conducted comparing the actual pipeline variety with your target pipeline vitality. This will be ranked along a 3-point Linkert Scale as follows:
• Below Expectation: the actual vitality is lower than the target vitality.
• Meets Expectation: the actual vitality is equal to the target vitality.
• Exceeds Expectation: the actual vitality is higher than the target vitality.
This becomes the baseline to assess the impact of the sales enablement function as part of future sales enablement performance reviews.
Curriculum

Sales Enablement – Workshop 1 – Enablement Diagnostics
- SalesGroup Definition
- Team Diagnostics
- Target Diagnostics
- Productivity Diagnostics
- Content Diagnostics
- Training Diagnostics
- Technology Diagnostics
- Value Diagnostics
- Volume Diagnostics
- Velocity Diagnostics
- Variety Diagnostics
- Vitality Diagnostics
Distance Learning

Introduction
Welcome to Appleton Greene and thank you for enrolling on the Sales Enablement corporate training program. You will be learning through our unique facilitation via distance-learning method, which will enable you to practically implement everything that you learn academically. The methods and materials used in your program have been designed and developed to ensure that you derive the maximum benefits and enjoyment possible. We hope that you find the program challenging and fun to do. However, if you have never been a distance-learner before, you may be experiencing some trepidation at the task before you. So we will get you started by giving you some basic information and guidance on how you can make the best use of the modules, how you should manage the materials and what you should be doing as you work through them. This guide is designed to point you in the right direction and help you to become an effective distance-learner. Take a few hours or so to study this guide and your guide to tutorial support for students, while making notes, before you start to study in earnest.
Study environment
You will need to locate a quiet and private place to study, preferably a room where you can easily be isolated from external disturbances or distractions. Make sure the room is well-lit and incorporates a relaxed, pleasant feel. If you can spoil yourself within your study environment, you will have much more of a chance to ensure that you are always in the right frame of mind when you do devote time to study. For example, a nice fire, the ability to play soft soothing background music, soft but effective lighting, perhaps a nice view if possible and a good size desk with a comfortable chair. Make sure that your family know when you are studying and understand your study rules. Your study environment is very important. The ideal situation, if at all possible, is to have a separate study, which can be devoted to you. If this is not possible then you will need to pay a lot more attention to developing and managing your study schedule, because it will affect other people as well as yourself. The better your study environment, the more productive you will be.
Study tools & rules
Try and make sure that your study tools are sufficient and in good working order. You will need to have access to a computer, scanner and printer, with access to the internet. You will need a very comfortable chair, which supports your lower back, and you will need a good filing system. It can be very frustrating if you are spending valuable study time trying to fix study tools that are unreliable, or unsuitable for the task. Make sure that your study tools are up to date. You will also need to consider some study rules. Some of these rules will apply to you and will be intended to help you to be more disciplined about when and how you study. This distance-learning guide will help you and after you have read it you can put some thought into what your study rules should be. You will also need to negotiate some study rules for your family, friends or anyone who lives with you. They too will need to be disciplined in order to ensure that they can support you while you study. It is important to ensure that your family and friends are an integral part of your study team. Having their support and encouragement can prove to be a crucial contribution to your successful completion of the program. Involve them in as much as you can.
Successful distance-learning
Distance-learners are freed from the necessity of attending regular classes or workshops, since they can study in their own way, at their own pace and for their own purposes. But unlike traditional internal training courses, it is the student’s responsibility, with a distance-learning program, to ensure that they manage their own study contribution. This requires strong self-discipline and self-motivation skills and there must be a clear will to succeed. Those students who are used to managing themselves, are good at managing others and who enjoy working in isolation, are more likely to be good distance-learners. It is also important to be aware of the main reasons why you are studying and of the main objectives that you are hoping to achieve as a result. You will need to remind yourself of these objectives at times when you need to motivate yourself. Never lose sight of your long-term goals and your short-term objectives. There is nobody available here to pamper you, or to look after you, or to spoon-feed you with information, so you will need to find ways to encourage and appreciate yourself while you are studying. Make sure that you chart your study progress, so that you can be sure of your achievements and re-evaluate your goals and objectives regularly.
Self-assessment
Appleton Greene training programs are in all cases post-graduate programs. Consequently, you should already have obtained a business-related degree and be an experienced learner. You should therefore already be aware of your study strengths and weaknesses. For example, which time of the day are you at your most productive? Are you a lark or an owl? What study methods do you respond to the most? Are you a consistent learner? How do you discipline yourself? How do you ensure that you enjoy yourself while studying? It is important to understand yourself as a learner and so some self-assessment early on will be necessary if you are to apply yourself correctly. Perform a SWOT analysis on yourself as a student. List your internal strengths and weaknesses as a student and your external opportunities and threats. This will help you later on when you are creating a study plan. You can then incorporate features within your study plan that can ensure that you are playing to your strengths, while compensating for your weaknesses. You can also ensure that you make the most of your opportunities, while avoiding the potential threats to your success.
Accepting responsibility as a student
Training programs invariably require a significant investment, both in terms of what they cost and in the time that you need to contribute to study and the responsibility for successful completion of training programs rests entirely with the student. This is never more apparent than when a student is learning via distance-learning. Accepting responsibility as a student is an important step towards ensuring that you can successfully complete your training program. It is easy to instantly blame other people or factors when things go wrong. But the fact of the matter is that if a failure is your failure, then you have the power to do something about it, it is entirely in your own hands. If it is always someone else’s failure, then you are powerless to do anything about it. All students study in entirely different ways, this is because we are all individuals and what is right for one student, is not necessarily right for another. In order to succeed, you will have to accept personal responsibility for finding a way to plan, implement and manage a personal study plan that works for you. If you do not succeed, you only have yourself to blame.
Planning
By far the most critical contribution to stress, is the feeling of not being in control. In the absence of planning we tend to be reactive and can stumble from pillar to post in the hope that things will turn out fine in the end. Invariably they don’t! In order to be in control, we need to have firm ideas about how and when we want to do things. We also need to consider as many possible eventualities as we can, so that we are prepared for them when they happen. Prescriptive Change, is far easier to manage and control, than Emergent Change. The same is true with distance-learning. It is much easier and much more enjoyable, if you feel that you are in control and that things are going to plan. Even when things do go wrong, you are prepared for them and can act accordingly without any unnecessary stress. It is important therefore that you do take time to plan your studies properly.
Management
Once you have developed a clear study plan, it is of equal importance to ensure that you manage the implementation of it. Most of us usually enjoy planning, but it is usually during implementation when things go wrong. Targets are not met and we do not understand why. Sometimes we do not even know if targets are being met. It is not enough for us to conclude that the study plan just failed. If it is failing, you will need to understand what you can do about it. Similarly if your study plan is succeeding, it is still important to understand why, so that you can improve upon your success. You therefore need to have guidelines for self-assessment so that you can be consistent with performance improvement throughout the program. If you manage things correctly, then your performance should constantly improve throughout the program.
Study objectives & tasks
The first place to start is developing your program objectives. These should feature your reasons for undertaking the training program in order of priority. Keep them succinct and to the point in order to avoid confusion. Do not just write the first things that come into your head because they are likely to be too similar to each other. Make a list of possible departmental headings, such as: Customer Service; E-business; Finance; Globalization; Human Resources; Technology; Legal; Management; Marketing and Production. Then brainstorm for ideas by listing as many things that you want to achieve under each heading and later re-arrange these things in order of priority. Finally, select the top item from each department heading and choose these as your program objectives. Try and restrict yourself to five because it will enable you to focus clearly. It is likely that the other things that you listed will be achieved if each of the top objectives are achieved. If this does not prove to be the case, then simply work through the process again.
Study forecast
As a guide, the Appleton Greene Sales Enablement corporate training program should take 12-18 months to complete, depending upon your availability and current commitments. The reason why there is such a variance in time estimates is because every student is an individual, with differing productivity levels and different commitments. These differentiations are then exaggerated by the fact that this is a distance-learning program, which incorporates the practical integration of academic theory as an as a part of the training program. Consequently all of the project studies are real, which means that important decisions and compromises need to be made. You will want to get things right and will need to be patient with your expectations in order to ensure that they are. We would always recommend that you are prudent with your own task and time forecasts, but you still need to develop them and have a clear indication of what are realistic expectations in your case. With reference to your time planning: consider the time that you can realistically dedicate towards study with the program every week; calculate how long it should take you to complete the program, using the guidelines featured here; then break the program down into logical modules and allocate a suitable proportion of time to each of them, these will be your milestones; you can create a time plan by using a spreadsheet on your computer, or a personal organizer such as MS Outlook, you could also use a financial forecasting software; break your time forecasts down into manageable chunks of time, the more specific you can be, the more productive and accurate your time management will be; finally, use formulas where possible to do your time calculations for you, because this will help later on when your forecasts need to change in line with actual performance. With reference to your task planning: refer to your list of tasks that need to be undertaken in order to achieve your program objectives; with reference to your time plan, calculate when each task should be implemented; remember that you are not estimating when your objectives will be achieved, but when you will need to focus upon implementing the corresponding tasks; you also need to ensure that each task is implemented in conjunction with the associated training modules which are relevant; then break each single task down into a list of specific to do’s, say approximately ten to do’s for each task and enter these into your study plan; once again you could use MS Outlook to incorporate both your time and task planning and this could constitute your study plan; you could also use a project management software like MS Project. You should now have a clear and realistic forecast detailing when you can expect to be able to do something about undertaking the tasks to achieve your program objectives.
Performance management
It is one thing to develop your study forecast, it is quite another to monitor your progress. Ultimately it is less important whether you achieve your original study forecast and more important that you update it so that it constantly remains realistic in line with your performance. As you begin to work through the program, you will begin to have more of an idea about your own personal performance and productivity levels as a distance-learner. Once you have completed your first study module, you should re-evaluate your study forecast for both time and tasks, so that they reflect your actual performance level achieved. In order to achieve this you must first time yourself while training by using an alarm clock. Set the alarm for hourly intervals and make a note of how far you have come within that time. You can then make a note of your actual performance on your study plan and then compare your performance against your forecast. Then consider the reasons that have contributed towards your performance level, whether they are positive or negative and make a considered adjustment to your future forecasts as a result. Given time, you should start achieving your forecasts regularly.
With reference to time management: time yourself while you are studying and make a note of the actual time taken in your study plan; consider your successes with time-efficiency and the reasons for the success in each case and take this into consideration when reviewing future time planning; consider your failures with time-efficiency and the reasons for the failures in each case and take this into consideration when reviewing future time planning; re-evaluate your study forecast in relation to time planning for the remainder of your training program to ensure that you continue to be realistic about your time expectations. You need to be consistent with your time management, otherwise you will never complete your studies. This will either be because you are not contributing enough time to your studies, or you will become less efficient with the time that you do allocate to your studies. Remember, if you are not in control of your studies, they can just become yet another cause of stress for you.
With reference to your task management: time yourself while you are studying and make a note of the actual tasks that you have undertaken in your study plan; consider your successes with task-efficiency and the reasons for the success in each case; take this into consideration when reviewing future task planning; consider your failures with task-efficiency and the reasons for the failures in each case and take this into consideration when reviewing future task planning; re-evaluate your study forecast in relation to task planning for the remainder of your training program to ensure that you continue to be realistic about your task expectations. You need to be consistent with your task management, otherwise you will never know whether you are achieving your program objectives or not.
Keeping in touch
You will have access to qualified and experienced professors and tutors who are responsible for providing tutorial support for your particular training program. So don’t be shy about letting them know how you are getting on. We keep electronic records of all tutorial support emails so that professors and tutors can review previous correspondence before considering an individual response. It also means that there is a record of all communications between you and your professors and tutors and this helps to avoid any unnecessary duplication, misunderstanding, or misinterpretation. If you have a problem relating to the program, share it with them via email. It is likely that they have come across the same problem before and are usually able to make helpful suggestions and steer you in the right direction. To learn more about when and how to use tutorial support, please refer to the Tutorial Support section of this student information guide. This will help you to ensure that you are making the most of tutorial support that is available to you and will ultimately contribute towards your success and enjoyment with your training program.
Work colleagues and family
You should certainly discuss your program study progress with your colleagues, friends and your family. Appleton Greene training programs are very practical. They require you to seek information from other people, to plan, develop and implement processes with other people and to achieve feedback from other people in relation to viability and productivity. You will therefore have plenty of opportunities to test your ideas and enlist the views of others. People tend to be sympathetic towards distance-learners, so don’t bottle it all up in yourself. Get out there and share it! It is also likely that your family and colleagues are going to benefit from your labors with the program, so they are likely to be much more interested in being involved than you might think. Be bold about delegating work to those who might benefit themselves. This is a great way to achieve understanding and commitment from people who you may later rely upon for process implementation. Share your experiences with your friends and family.
Making it relevant
The key to successful learning is to make it relevant to your own individual circumstances. At all times you should be trying to make bridges between the content of the program and your own situation. Whether you achieve this through quiet reflection or through interactive discussion with your colleagues, client partners or your family, remember that it is the most important and rewarding aspect of translating your studies into real self-improvement. You should be clear about how you want the program to benefit you. This involves setting clear study objectives in relation to the content of the course in terms of understanding, concepts, completing research or reviewing activities and relating the content of the modules to your own situation. Your objectives may understandably change as you work through the program, in which case you should enter the revised objectives on your study plan so that you have a permanent reminder of what you are trying to achieve, when and why.
Distance-learning check-list
Prepare your study environment, your study tools and rules.
Undertake detailed self-assessment in terms of your ability as a learner.
Create a format for your study plan.
Consider your study objectives and tasks.
Create a study forecast.
Assess your study performance.
Re-evaluate your study forecast.
Be consistent when managing your study plan.
Use your Appleton Greene Certified Learning Provider (CLP) for tutorial support.
Make sure you keep in touch with those around you.
Tutorial Support

Programs
Appleton Greene uses standard and bespoke corporate training programs as vessels to transfer business process improvement knowledge into the heart of our clients’ organizations. Each individual program focuses upon the implementation of a specific business process, which enables clients to easily quantify their return on investment. There are hundreds of established Appleton Greene corporate training products now available to clients within customer services, e-business, finance, globalization, human resources, information technology, legal, management, marketing and production. It does not matter whether a client’s employees are located within one office, or an unlimited number of international offices, we can still bring them together to learn and implement specific business processes collectively. Our approach to global localization enables us to provide clients with a truly international service with that all important personal touch. Appleton Greene corporate training programs can be provided virtually or locally and they are all unique in that they individually focus upon a specific business function. They are implemented over a sustainable period of time and professional support is consistently provided by qualified learning providers and specialist consultants.
Support available
You will have a designated Certified Learning Provider (CLP) and an Accredited Consultant and we encourage you to communicate with them as much as possible. In all cases tutorial support is provided online because we can then keep a record of all communications to ensure that tutorial support remains consistent. You would also be forwarding your work to the tutorial support unit for evaluation and assessment. You will receive individual feedback on all of the work that you undertake on a one-to-one basis, together with specific recommendations for anything that may need to be changed in order to achieve a pass with merit or a pass with distinction and you then have as many opportunities as you may need to re-submit project studies until they meet with the required standard. Consequently the only reason that you should really fail (CLP) is if you do not do the work. It makes no difference to us whether a student takes 12 months or 18 months to complete the program, what matters is that in all cases the same quality standard will have been achieved.
Support Process
Please forward all of your future emails to the designated (CLP) Tutorial Support Unit email address that has been provided and please do not duplicate or copy your emails to other AGC email accounts as this will just cause unnecessary administration. Please note that emails are always answered as quickly as possible but you will need to allow a period of up to 20 business days for responses to general tutorial support emails during busy periods, because emails are answered strictly within the order in which they are received. You will also need to allow a period of up to 30 business days for the evaluation and assessment of project studies. This does not include weekends or public holidays. Please therefore kindly allow for this within your time planning. All communications are managed online via email because it enables tutorial service support managers to review other communications which have been received before responding and it ensures that there is a copy of all communications retained on file for future reference. All communications will be stored within your personal (CLP) study file here at Appleton Greene throughout your designated study period. If you need any assistance or clarification at any time, please do not hesitate to contact us by forwarding an email and remember that we are here to help. If you have any questions, please list and number your questions succinctly and you can then be sure of receiving specific answers to each and every query.
Time Management
It takes approximately 1 Year to complete the Sales Enablement corporate training program, incorporating 12 x 6-hour monthly workshops. Each student will also need to contribute approximately 4 hours per week over 1 Year of their personal time. Students can study from home or work at their own pace and are responsible for managing their own study plan. There are no formal examinations and students are evaluated and assessed based upon their project study submissions, together with the quality of their internal analysis and supporting documents. They can contribute more time towards study when they have the time to do so and can contribute less time when they are busy. All students tend to be in full time employment while studying and the Sales Enablement program is purposely designed to accommodate this, so there is plenty of flexibility in terms of time management. It makes no difference to us at Appleton Greene, whether individuals take 12-18 months to complete this program. What matters is that in all cases the same standard of quality will have been achieved with the standard and bespoke programs that have been developed.
Distance Learning Guide
The distance learning guide should be your first port of call when starting your training program. It will help you when you are planning how and when to study, how to create the right environment and how to establish the right frame of mind. If you can lay the foundations properly during the planning stage, then it will contribute to your enjoyment and productivity while training later. The guide helps to change your lifestyle in order to accommodate time for study and to cultivate good study habits. It helps you to chart your progress so that you can measure your performance and achieve your goals. It explains the tools that you will need for study and how to make them work. It also explains how to translate academic theory into practical reality. Spend some time now working through your distance learning guide and make sure that you have firm foundations in place so that you can make the most of your distance learning program. There is no requirement for you to attend training workshops or classes at Appleton Greene offices. The entire program is undertaken online, program course manuals and project studies are administered via the Appleton Greene web site and via email, so you are able to study at your own pace and in the comfort of your own home or office as long as you have a computer and access to the internet.
How To Study
The how to study guide provides students with a clear understanding of the Appleton Greene facilitation via distance learning training methods and enables students to obtain a clear overview of the training program content. It enables students to understand the step-by-step training methods used by Appleton Greene and how course manuals are integrated with project studies. It explains the research and development that is required and the need to provide evidence and references to support your statements. It also enables students to understand precisely what will be required of them in order to achieve a pass with merit and a pass with distinction for individual project studies and provides useful guidance on how to be innovative and creative when developing your Unique Program Proposition (UPP).
Tutorial Support
Tutorial support for the Appleton Greene Sales Enablement corporate training program is provided online either through the Appleton Greene Client Support Portal (CSP), or via email. All tutorial support requests are facilitated by a designated Program Administration Manager (PAM). They are responsible for deciding which professor or tutor is the most appropriate option relating to the support required and then the tutorial support request is forwarded onto them. Once the professor or tutor has completed the tutorial support request and answered any questions that have been asked, this communication is then returned to the student via email by the designated Program Administration Manager (PAM). This enables all tutorial support, between students, professors and tutors, to be facilitated by the designated Program Administration Manager (PAM) efficiently and securely through the email account. You will therefore need to allow a period of up to 20 business days for responses to general support queries and up to 30 business days for the evaluation and assessment of project studies, because all tutorial support requests are answered strictly within the order in which they are received. This does not include weekends or public holidays. Consequently you need to put some thought into the management of your tutorial support procedure in order to ensure that your study plan is feasible and to obtain the maximum possible benefit from tutorial support during your period of study. Please retain copies of your tutorial support emails for future reference. Please ensure that ALL of your tutorial support emails are set out using the format as suggested within your guide to tutorial support. Your tutorial support emails need to be referenced clearly to the specific part of the course manual or project study which you are working on at any given time. You also need to list and number any questions that you would like to ask, up to a maximum of five questions within each tutorial support email. Remember the more specific you can be with your questions the more specific your answers will be too and this will help you to avoid any unnecessary misunderstanding, misinterpretation, or duplication. The guide to tutorial support is intended to help you to understand how and when to use support in order to ensure that you get the most out of your training program. Appleton Greene training programs are designed to enable you to do things for yourself. They provide you with a structure or a framework and we use tutorial support to facilitate students while they practically implement what they learn. In other words, we are enabling students to do things for themselves. The benefits of distance learning via facilitation are considerable and are much more sustainable in the long-term than traditional short-term knowledge sharing programs. Consequently you should learn how and when to use tutorial support so that you can maximize the benefits from your learning experience with Appleton Greene. This guide describes the purpose of each training function and how to use them and how to use tutorial support in relation to each aspect of the training program. It also provides useful tips and guidance with regard to best practice.
Tutorial Support Tips
Students are often unsure about how and when to use tutorial support with Appleton Greene. This Tip List will help you to understand more about how to achieve the most from using tutorial support. Refer to it regularly to ensure that you are continuing to use the service properly. Tutorial support is critical to the success of your training experience, but it is important to understand when and how to use it in order to maximize the benefit that you receive. It is no coincidence that those students who succeed are those that learn how to be positive, proactive and productive when using tutorial support.
Be positive and friendly with your tutorial support emails
Remember that if you forward an email to the tutorial support unit, you are dealing with real people. “Do unto others as you would expect others to do unto you”. If you are positive, complimentary and generally friendly in your emails, you will generate a similar response in return. This will be more enjoyable, productive and rewarding for you in the long-term.
Think about the impression that you want to create
Every time that you communicate, you create an impression, which can be either positive or negative, so put some thought into the impression that you want to create. Remember that copies of all tutorial support emails are stored electronically and tutors will always refer to prior correspondence before responding to any current emails. Over a period of time, a general opinion will be arrived at in relation to your character, attitude and ability. Try to manage your own frustrations, mood swings and temperament professionally, without involving the tutorial support team. Demonstrating frustration or a lack of patience is a weakness and will be interpreted as such. The good thing about communicating in writing, is that you will have the time to consider your content carefully, you can review it and proof-read it before sending your email to Appleton Greene and this should help you to communicate more professionally, consistently and to avoid any unnecessary knee-jerk reactions to individual situations as and when they may arise. Please also remember that the CLP Tutorial Support Unit will not just be responsible for evaluating and assessing the quality of your work, they will also be responsible for providing recommendations to other learning providers and to client contacts within the Appleton Greene global client network, so do be in control of your own emotions and try to create a good impression.
Remember that quality is preferred to quantity
Please remember that when you send an email to the tutorial support team, you are not using Twitter or Text Messaging. Try not to forward an email every time that you have a thought. This will not prove to be productive either for you or for the tutorial support team. Take time to prepare your communications properly, as if you were writing a professional letter to a business colleague and make a list of queries that you are likely to have and then incorporate them within one email, say once every month, so that the tutorial support team can understand more about context, application and your methodology for study. Get yourself into a consistent routine with your tutorial support requests and use the tutorial support template provided with ALL of your emails. The (CLP) Tutorial Support Unit will not spoon-feed you with information. They need to be able to evaluate and assess your tutorial support requests carefully and professionally.
Be specific about your questions in order to receive specific answers
Try not to write essays by thinking as you are writing tutorial support emails. The tutorial support unit can be unclear about what in fact you are asking, or what you are looking to achieve. Be specific about asking questions that you want answers to. Number your questions. You will then receive specific answers to each and every question. This is the main purpose of tutorial support via email.
Keep a record of your tutorial support emails
It is important that you keep a record of all tutorial support emails that are forwarded to you. You can then refer to them when necessary and it avoids any unnecessary duplication, misunderstanding, or misinterpretation.
Individual training workshops or telephone support
Tutorial Support Email Format
You should use this tutorial support format if you need to request clarification or assistance while studying with your training program. Please note that ALL of your tutorial support request emails should use the same format. You should therefore set up a standard email template, which you can then use as and when you need to. Emails that are forwarded to Appleton Greene, which do not use the following format, may be rejected and returned to you by the (CLP) Program Administration Manager. A detailed response will then be forwarded to you via email usually within 20 business days of receipt for general support queries and 30 business days for the evaluation and assessment of project studies. This does not include weekends or public holidays. Your tutorial support request, together with the corresponding TSU reply, will then be saved and stored within your electronic TSU file at Appleton Greene for future reference.
Subject line of your email
Please insert: Appleton Greene (CLP) Tutorial Support Request: (Your Full Name) (Date), within the subject line of your email.
Main body of your email
Please insert:
1. Appleton Greene Certified Learning Provider (CLP) Tutorial Support Request
2. Your Full Name
3. Date of TS request
4. Preferred email address
5. Backup email address
6. Course manual page name or number (reference)
7. Project study page name or number (reference)
Subject of enquiry
Please insert a maximum of 50 words (please be succinct)
Briefly outline the subject matter of your inquiry, or what your questions relate to.
Question 1
Maximum of 50 words (please be succinct)
Maximum of 50 words (please be succinct)
Question 3
Maximum of 50 words (please be succinct)
Question 4
Maximum of 50 words (please be succinct)
Question 5
Maximum of 50 words (please be succinct)
Please note that a maximum of 5 questions is permitted with each individual tutorial support request email.
Procedure
* List the questions that you want to ask first, then re-arrange them in order of priority. Make sure that you reference them, where necessary, to the course manuals or project studies.
* Make sure that you are specific about your questions and number them. Try to plan the content within your emails to make sure that it is relevant.
* Make sure that your tutorial support emails are set out correctly, using the Tutorial Support Email Format provided here.
* Save a copy of your email and incorporate the date sent after the subject title. Keep your tutorial support emails within the same file and in date order for easy reference.
* Allow up to 20 business days for a response to general tutorial support emails and up to 30 business days for the evaluation and assessment of project studies, because detailed individual responses will be made in all cases and tutorial support emails are answered strictly within the order in which they are received.
* Emails can and do get lost. So if you have not received a reply within the appropriate time, forward another copy or a reminder to the tutorial support unit to be sure that it has been received but do not forward reminders unless the appropriate time has elapsed.
* When you receive a reply, save it immediately featuring the date of receipt after the subject heading for easy reference. In most cases the tutorial support unit replies to your questions individually, so you will have a record of the questions that you asked as well as the answers offered. With project studies however, separate emails are usually forwarded by the tutorial support unit, so do keep a record of your own original emails as well.
* Remember to be positive and friendly in your emails. You are dealing with real people who will respond to the same things that you respond to.
* Try not to repeat questions that have already been asked in previous emails. If this happens the tutorial support unit will probably just refer you to the appropriate answers that have already been provided within previous emails.
* If you lose your tutorial support email records you can write to Appleton Greene to receive a copy of your tutorial support file, but a separate administration charge may be levied for this service.
How To Study

Your Certified Learning Provider (CLP) and Accredited Consultant can help you to plan a task list for getting started so that you can be clear about your direction and your priorities in relation to your training program. It is also a good way to introduce yourself to the tutorial support team.
Planning your study environment
Your study conditions are of great importance and will have a direct effect on how much you enjoy your training program. Consider how much space you will have, whether it is comfortable and private and whether you are likely to be disturbed. The study tools and facilities at your disposal are also important to the success of your distance-learning experience. Your tutorial support unit can help with useful tips and guidance, regardless of your starting position. It is important to get this right before you start working on your training program.
Planning your program objectives
It is important that you have a clear list of study objectives, in order of priority, before you start working on your training program. Your tutorial support unit can offer assistance here to ensure that your study objectives have been afforded due consideration and priority.
Planning how and when to study
Distance-learners are freed from the necessity of attending regular classes, since they can study in their own way, at their own pace and for their own purposes. This approach is designed to let you study efficiently away from the traditional classroom environment. It is important however, that you plan how and when to study, so that you are making the most of your natural attributes, strengths and opportunities. Your tutorial support unit can offer assistance and useful tips to ensure that you are playing to your strengths.
Planning your study tasks
You should have a clear understanding of the study tasks that you should be undertaking and the priority associated with each task. These tasks should also be integrated with your program objectives. The distance learning guide and the guide to tutorial support for students should help you here, but if you need any clarification or assistance, please contact your tutorial support unit.
Planning your time
You will need to allocate specific times during your calendar when you intend to study if you are to have a realistic chance of completing your program on time. You are responsible for planning and managing your own study time, so it is important that you are successful with this. Your tutorial support unit can help you with this if your time plan is not working.
Keeping in touch
Consistency is the key here. If you communicate too frequently in short bursts, or too infrequently with no pattern, then your management ability with your studies will be questioned, both by you and by your tutorial support unit. It is obvious when a student is in control and when one is not and this will depend how able you are at sticking with your study plan. Inconsistency invariably leads to in-completion.
Charting your progress
Your tutorial support team can help you to chart your own study progress. Refer to your distance learning guide for further details.
Making it work
To succeed, all that you will need to do is apply yourself to undertaking your training program and interpreting it correctly. Success or failure lies in your hands and your hands alone, so be sure that you have a strategy for making it work. Your Certified Learning Provider (CLP) and Accredited Consultant can guide you through the process of program planning, development and implementation.
Reading methods
Interpretation is often unique to the individual but it can be improved and even quantified by implementing consistent interpretation methods. Interpretation can be affected by outside interference such as family members, TV, or the Internet, or simply by other thoughts which are demanding priority in our minds. One thing that can improve our productivity is using recognized reading methods. This helps us to focus and to be more structured when reading information for reasons of importance, rather than relaxation.
Speed reading
When reading through course manuals for the first time, subconsciously set your reading speed to be just fast enough that you cannot dwell on individual words or tables. With practice, you should be able to read an A4 sheet of paper in one minute. You will not achieve much in the way of a detailed understanding, but your brain will retain a useful overview. This overview will be important later on and will enable you to keep individual issues in perspective with a more generic picture because speed reading appeals to the memory part of the brain. Do not worry about what you do or do not remember at this stage.
Content reading
Once you have speed read everything, you can then start work in earnest. You now need to read a particular section of your course manual thoroughly, by making detailed notes while you read. This process is called Content Reading and it will help to consolidate your understanding and interpretation of the information that has been provided.
Making structured notes on the course manuals
When you are content reading, you should be making detailed notes, which are both structured and informative. Make these notes in a MS Word document on your computer, because you can then amend and update these as and when you deem it to be necessary. List your notes under three headings: 1. Interpretation – 2. Questions – 3. Tasks. The purpose of the 1st section is to clarify your interpretation by writing it down. The purpose of the 2nd section is to list any questions that the issue raises for you. The purpose of the 3rd section is to list any tasks that you should undertake as a result. Anyone who has graduated with a business-related degree should already be familiar with this process.
Organizing structured notes separately
You should then transfer your notes to a separate study notebook, preferably one that enables easy referencing, such as a MS Word Document, a MS Excel Spreadsheet, a MS Access Database, or a personal organizer on your cell phone. Transferring your notes allows you to have the opportunity of cross-checking and verifying them, which assists considerably with understanding and interpretation. You will also find that the better you are at doing this, the more chance you will have of ensuring that you achieve your study objectives.
Question your understanding
Do challenge your understanding. Explain things to yourself in your own words by writing things down.
Clarifying your understanding
If you are at all unsure, forward an email to your tutorial support unit and they will help to clarify your understanding.
Question your interpretation
Do challenge your interpretation. Qualify your interpretation by writing it down.
Clarifying your interpretation
If you are at all unsure, forward an email to your tutorial support unit and they will help to clarify your interpretation.
Qualification Requirements
The student will need to successfully complete the project study and all of the exercises relating to the Sales Enablement corporate training program, achieving a pass with merit or distinction in each case, in order to qualify as an Accredited Sales Enablement Specialist (ASES). All monthly workshops need to be tried and tested within your company. These project studies can be completed in your own time and at your own pace and in the comfort of your own home or office. There are no formal examinations, assessment is based upon the successful completion of the project studies. They are called project studies because, unlike case studies, these projects are not theoretical, they incorporate real program processes that need to be properly researched and developed. The project studies assist us in measuring your understanding and interpretation of the training program and enable us to assess qualification merits. All of the project studies are based entirely upon the content within the training program and they enable you to integrate what you have learnt into your corporate training practice.
Sales Enablement – Grading Contribution
Project Study – Grading Contribution
Customer Service – 10%
E-business – 05%
Finance – 10%
Globalization – 10%
Human Resources – 10%
Information Technology – 10%
Legal – 05%
Management – 10%
Marketing – 10%
Production – 10%
Education – 05%
Logistics – 05%
TOTAL GRADING – 100%
Qualification grades
A mark of 90% = Pass with Distinction.
A mark of 75% = Pass with Merit.
A mark of less than 75% = Fail.
If you fail to achieve a mark of 75% with a project study, you will receive detailed feedback from the Certified Learning Provider (CLP) and/or Accredited Consultant, together with a list of tasks which you will need to complete, in order to ensure that your project study meets with the minimum quality standard that is required by Appleton Greene. You can then re-submit your project study for further evaluation and assessment. Indeed you can re-submit as many drafts of your project studies as you need to, until such a time as they eventually meet with the required standard by Appleton Greene, so you need not worry about this, it is all part of the learning process.
When marking project studies, Appleton Greene is looking for sufficient evidence of the following:
Pass with merit
A satisfactory level of program understanding
A satisfactory level of program interpretation
A satisfactory level of project study content presentation
A satisfactory level of Unique Program Proposition (UPP) quality
A satisfactory level of the practical integration of academic theory
Pass with distinction
An exceptional level of program understanding
An exceptional level of program interpretation
An exceptional level of project study content presentation
An exceptional level of Unique Program Proposition (UPP) quality
An exceptional level of the practical integration of academic theory
Preliminary Analysis

Chapter 1: SalesGroup Definition
• Competing on Customer Journeys, You have to create new value at every step by David C. Edelman and Marc Singer – Harvard Business Review Article Link
https://hbr.org/2015/11/competing-on-customer-journeys
• The complete guide to understanding the customer journey by Elena H – LinkedIn Article Link
https://www.linkedin.com/pulse/complete-guide-understanding-customer-journey-hernandez/
Chapter 2: Team Diagnostics
• How to identify the right ‘spans of control’ for your organization By Ashwin Acharya, Roni Lieber, Lissa Seem, and Tom Welchman – McKinsey Website Article Link
https://www.mckinsey.com/capabilities/people-and-organizational-performance/our-insights/how-to-identify-the-right-spans-of-control-for-your-organization
• How to Create and Manage a Skills Inventory at Your Organization Posted by Erik van Vulpen – AIHR Website Link
• Sales Culture: How to Build a High Performance, Healthy Sales Team by Aja Frost – Hubspot Website Link
https://blog.hubspot.com/sales/sales-culture
Chapter 3: Target Diagnostics
• 5 Levels Of Goal Clarity Needed For Team Success by Tony Gambill (Contributor) – Forbes Article Link
• Why Clarity is the MOST IMPORTANT thing for achieving your goals by Justin Aldridge Success Coach | Author | Speaker – LinkedIn Article Link
Chapter 4: Productivity Diagnostics
• What Accomplishments Are You Most Proud Of? (Student Opinion) – New York Times Article Link
https://www.nytimes.com/2023/09/06/learning/what-accomplishments-are-you-most-proud-of.html
• Activity vs. Accomplishment by Sean Harris – Medium Article Link
https://medium.com/@seansprose/activity-vs-accomplishment-58f463e94905

Chapter 5: Content Diagnostics
• Stuff: When Less Is More from The Magazine – Harvard Business Review Article
https://hbr.org/2015/03/vision-statement-stuff-when-less-is-more
• More Isn’t Always Better by Barry Schwartz – Harvard Business Review Article
https://hbr.org/2006/06/more-isnt-always-better
Chapter 6: Training Diagnostics
• Don’t Mistake Training For Learning by Deborah Lovich, BCG Senior Partner – Forbes Article Link
• Learning vs Training: What’s the Difference and Why Do You Need to Know? By Shani Jay – AIHR Article Link
https://www.aihr.com/blog/learning-vs-training/
Chapter 7: Technology Diagnostics
• Companies Need to Prove They Can Be Trusted with Technology by Daniel Dobrygowski – Harvard Business Review Article
https://hbr.org/2023/07/companies-need-to-prove-they-can-be-trusted-with-technology
• The Art Of Prioritizing: Choosing The Right Technologies For You by Eliott Teissonniere – Forbes Article
Chapter 8: Value Diagnostics
• Bottom-Line Growth vs. Top-Line Growth: What’s the Difference? by Chris B. Murphy – Investopedia Article Link
https://www.investopedia.com/ask/answers/difference-between-bottom-line-and-top-line-growth/
• 3 Strategies to Boost Sales and Marketing Productivity by Jordan Lee, Dave Schottland, Peter Henle, and Jens Hjortegaard – Harvard Business Review Article
https://hbr.org/2023/06/3-strategies-to-boost-sales-and-marketing-productivity
Chapter 9: Volume Diagnostics
• Sales: A Numbers Game You Can Win by David Villa – Forbes Article Link
• Sales Is a Numbers Game – There Is No Myth to Debunk by Henning Schwinum – LinkedIn Article Link
https://www.linkedin.com/pulse/sales-numbers-game-myth-debunk-henning-schwinum/
Chapter 10: Velocity Diagnostics
• Getting Up to Speed in Your Sales Efforts by Frank Cespedes, Senior Lecturer at Harvard Business School – LinkedIn Article Link
https://www.linkedin.com/pulse/getting-up-speed-your-sales-efforts-frank-cespedes/
• Time Kills Sales: How to Speed Up Your Sales Cycle by Erica Schultz Chief Marketing Officer, RAIN Group – RAIN Group Article Link
https://www.rainsalestraining.com/blog/how-to-speed-up-your-sales-cycle
Chapter 11: Variety Diagnostics
• Market Segmentation: Sell More By Selling To Fewer by Larry Myler – Forbes Article Link
• How to Sell into New Market Segments by Jonathan Bein – Distribution Strategy Article
https://distributionstrategy.com/how-to-sell-into-new-market-segments/
Chapter 12: Vitality Diagnostics
• Enthusiasm and Sales, How do they go hand in hand? By Devanath Naddan – LinkedIn Article Link
https://www.linkedin.com/pulse/enthusiasm-sales-how-do-go-hand-devanath-naddan/
• The Combination of Enthusiasm and Belief for Sales Success by Ken Thoreson – Sales Gravy Link
https://salesgravy.com/the-combination-of-enthusiasm-and-belief-for-sales-success/
Course Manuals 1-12

Course Manual 1: SalesGroup Definition
Introduction
Welcome to the first course of the Sales Enablement program where we will be working together to identify and define your ‘SalesGroup’.
Let’s do this quick ice breaker activity to get us started!

Exercise 1.1
What is a SalesGroup?
You may have heard the phrase before that it takes a village to raise a child. The same can be said of acquiring and retaining customers – it takes a village. This ‘village’ is what we like to call the ‘SalesGroup’.
Simply put, the SalesGroup refers to everyone on your team who interacts with customers along their journey of buying and using your product and/or service. Every member of the SalesGroup needs to be actively part of your sales enablement program for your organization to effectively acquire and retain customers.
This course is designed to help you effectively identify all the members of your SalesGroup, both the ones that are very obvious like the ‘customer facing’ roles such as sales, marketing, business development, customer success, account management. It will also include the non-customer facing roles like marketing, production/manufacturing, services.
Is Everyone Within Your Organization Selling?
You might be familiar with either of these statements ‘everyone is selling something’ or ‘everyone is in sales’. These statements are aimed to instill a growth-oriented mindset within organizations emphasizing that every member within the organization is contributes towards sales in some capacity. While not everyone in your organization will be in a ‘customer facing role’, for you to leverage the network and potential of your entire workforce, creating this ‘we are all in sales’ mindset is critical.
However, the concept of the ‘SalesGroup’ is not to capture every single person within your organization. It is intended to help you identify those who are more directly involved in customer facing roles. This is because these roles have the highest potential of influencing your potential and current customers and driving growth for your organization.

As you understand the concept of the SalesGroup, you may begin to realize that the SalesGroup will vary in size or number depending on the size of your organisation and the nature of your products and services. To help you ensure all members of your SalesGroup are identified, we mapped out the different functions within your organization to the Customer Journey.

Case Study: The Different Stakeholders Involved in Sales Enablement
In this video call, Werner Schmidt, VP Global Sales Enablement at Sage talks about how they built business cases for sales enablement initiatives and got them approved.
As you watch the video, listen for the different stakeholders they had to engage with and see how this begins to shape your view of what the SalesGroup will look like in your organization.
Building The Business Case for Sales Enablement – Video Link
Sage is a British multinational software company. With an annual revenue of about £ 2 billion and over 6 million customers worldwide, Sage is considered the 2nd largest UK based tech company and the world’s 3rd largest supplier of enterprise resource planning software.
Your Customer’s Journey
There is a journey that your customer follows from where they first hear about your organization or one of your products/services to the point where they are using your products/services, so they realize the value it delivers and even grow this value.
Based on this, the customer journey consists of two major parts:
• The Customer’s Buying Journey – Steps 1 to 3 in the illustration below
• The Customer’s Experience Journey – Steps 4 to 6 in the illustration below

Why You Should Map Your SalesGroup to Your Customer’s Journey
A Customer Journey map helps you visualize what your customers are thinking, feeling, and doing as they interact with your products/services. This visualization is key to understanding your customers’ deepest needs, so you are able to provide better services to meet those needs.
When you map your teams along the customer’s journey you can see more clearly what teams you need to enable and what you need to enable them with, so they are better equipped to provide those services to your customer along their journey.

Here are some benefits of mapping your SalesGroup to your customer’s journey:
1. Better Empathy for Customers – this exercise will help you walk in the shoes of your customers, to see things from their own perspectives and this will help you better articulate what they feel and experience and what you can do through sales enablement to improve those feelings and experiences. It is true that there are some people who are naturally able to have more empathy than others, however the interesting fact is that everyone has some measure of empathy in them. This fact that everyone has some amount of empathy no matter how small, means this empathy can be nurtured to grow and become more dominant in each person by providing them with an opportunity to participate in empathy-nurturing exercises or activities. A very good and effective example of such an exercise is getting them to participate in a customer journey mapping exercise. When more members of your SalesGroup develop empathy for your customers it results in your entire SalesGroup adopting a more customer-centric approach to what they do. Imagine your marketing, sales, business development, partnership, customer service, customer success and all other teams working fully from a customer-centric mindset – great things are bound to emerge!
2. Identify Unmet Customer Needs – the many points of interaction you identify along the journey will help you identify the other needs of the customer that have not been met. This also provides good insights and information for sales enablement efforts. The process of mapping the customer journey provides you with more detailed information, most likely beyond what you have documented before. The difference between good organizations and great organizations is their ability to get to the details (or data) and use those details to drive better discussions which will lead to better decisions and ultimately enhance the performance of the SalesGroup. A lot of what many organizations do around understanding customer needs is either based on occasional anecdotes or recent events. Instead they should be developing an understanding that is based on data which helps in identifying consistent trends and patterns that inform how those customer needs are met. Data driven discussions and decisions become easier when a detailed customer mapping exercise is done.
3. Understand the Complexities of the Customer’s Journey – most customers have different ways and channels through which they interact with your products/services. These interaction points are usually not linear. Mapping your SalesGroup to the customer’s journey will help you better understand those complexities and how your team needs to be enabled to support in resolving those complexities. It is sometimes very easy to assume one has a full grasp of the intricacies of your customer’s journey. But the reality is these complexities only begin to fully surface as you do a detailed mapping of your customer’s journey. The way different elements connect can be quite enlightening especially when you approach this with the technique of Systems Thinking. This thinking technique helps you realize how a change in one area affects a number of other areas along the customer journey. Systems thinking is a holistic approach to examining a situation that emphasizes the interconnectedness of different parts of a system and how they interact with each other. It is a way of looking at the situation as a complex web of relationships rather than a collection of isolated parts. This is the realization that begins to unfold at a more compelling level when a detailed customer mapping exercise is conducted.

4. Visualization Shapes Emotions – you have most likely heard this said before within the sales and marketing world that ‘people buy with their emotions and then justify with logic’. The customer journey helps you visualize your customer’s emotions and how your team can leverage on this in your journey. It is true that a ‘picture is worth a thousand words’ and something powerful happens when the end-to-end customer journey is visualized on one page. The way everything comes together becomes more apparent and the emotions that each step along that journey evokes in your customers becomes more tangible. Accordingly, visualizing your customer journey provides you with a clearer picture of how your customers experience of your SalesGroup. This, in turn, enhances your ability to identify the effectiveness of the existing processes and pinpoint areas that require changes.
5. Stakeholder Alignment – as you map your SalesGroup to the customer’s journey you have a better realization of what stakeholders are involved at each phase and how these stakeholders can align to produce synergy and a compound impact on the customers along the journey. For effectives sales to happen, many functions and teams within your organization will be involved. In many cases these functions and teams roll up to different leaders and executives who may have different perspectives and ways of approaching the work around sales. Conducting an exercise such as customer journey mapping is a great way to build alignment across these different teams and their leaders. Many organizations either assume leaders are aligned or underestimate the impact of when such alignment is lacking. Understanding that leadership plays a crucial role in influencing overall outcomes, ensuring unity among this essential group of stakeholders is important for the overall success of your SalesGroup.
6. Improved ROI – when your SalesGroup is mapped to the customer’s journey, their alignment will produce a compounding impact on your customers, which enables you to achieve more with the resources. This ultimately improves the return on investment on resources linked to the customer’s journey. Being able to justify the ROI for the SalesGroup is a great way to secure future funding and resource allocation from the corporate budget and plans. The ability of the SalesGroup to demonstrate this improved ROI and secure this enterprise support is a key input for driving further growth. It also helps the leaders of the SalesGroup effectively identify where best to plug the funding to achieve desired outcomes.
7. Competitive Advantage – mapping your SalesGroup to the customer’s journey will help you identify the specific changes you need to make that will give you a unique advantage over the competition and help you secure the current opportunity and ultimately increase your market share. This becomes critical for organizations who are either seeking to growt or looking to maintain their existing market share.

Customer’s Buying Journey & Your SalesGroup
The Customer’s Buying Journey consists of the first 3 phases of the Customer Journey as shown in the illustration below:
1. Aware – this refers to the phase when the potential customer becomes aware of your products/services and how these might help the customer in achieving their objectives or overcoming a challenge that they have. In this phase, your SalesGroup would like be involved in activities related to marketing and business development with the potential customer.
2. Consider – this refers to the phase where the potential customer is considering whether or not to buy your product/service. Sometimes this is done in comparison to other options they may have. In other cases, it may just be a ‘buy or not buy’ decision. The activities your SalesGroup will be involved with the customer in this phase will be related to targeted marketing, sales, and unique value proposition.
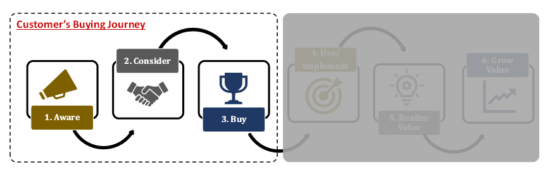
3. Buy – this is the point where the customer decides to make a purchase based on the perceived value the customer expects to get from your product/service. In this phase, your SalesGroup will be involved in activities related to sales, negotiation, contracting.
Exercise 1.2

Customer’s Experience Journey & Your SalesGroup
The Customer’s Experience Journey consists of the last 3 phases of the Customer Journey as shown in the illustration below.
Including these last 3 phases as part the sales enablement focus is one of the unique value propositions of this Sales Enablement Program. This is because traditional sales enablement initiatives only focus on enabling the team until the point where the customer buys.
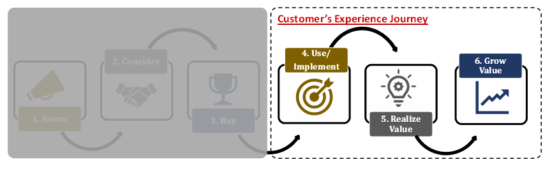
In this program we understand that the customer’s experience of your product and service continues long after they have made the decision to purchase. As such, your Sales Enablement function will be more effective when it also enables your teams that are involved in these phases.
4. Use/Implement – this refers to when the customer begins to use your product and/or implement your service, because this is likely to introduce some ‘change’ into your customer’s world, your organization has a vital role to play in walking alongside the customer all through this phase. Answering their questions, calming their fears, and ensuring they are having a smooth transition into ‘the new’. In this phase, teams within your organization will be involved in activities related to delivery, installation, implementation, onboarding, customer service.
5. Realize Value – this refers to the phase where the customer begins to realize some value from purchasing your product or service. The timeline for the customer to experience this could be as early as just hours of purchase to months or years. It all depends on the nature of your products/services. At this phase, the customer is comparing their expectations (what they thought your product/service will do) and the results (what your product/service is actually doing). This is also a very sensitive phase for the customer where different teams within your organization will help them navigate and ensure your products/services meet or exceed the customer’s expectations. In this phase, the teams within your organization will be involved in activities related to customer success, customer management, customer service, issue resolution, advisory services.
6. Grow Value – in this last phase, the customer has now validated that your products/services are able to help them achieve their objectives. In this phase the customer is now more focused in repeating or expanding the success they have experienced from buying your products/services. This desire to grow the value from your products/services is a pivotal point that converts the customer from being just a customer to being an account, a repeat customer, an advocate, or something more influential for your organization. In this phase, the teams within your organization will be involved in activities related to partnering with the customer to co-create strategy and plans, co-create solutions to other business challenges, becoming a trusted advisor.
Exercise 1.3
Course Manual 2: Team Diagnostics
Introduction
The objective of this course is to review how well your SalesGroup is set up to function as a team.
Many business leaders often assume that once you bring a group of people together, that they automatically become a team. However, there are key ingredients for having a high-performance team, including, clarity of roles, adequate staffing, and a strong team culture.
Exercise 2.1
(You can nudge their memory by mentioning leadership, purpose, team culture, clarity of roles, etc.)
Qualities of High-Performance Teams
For any sales organization seeking to make significant impact and growth, recognizing the critical roles that your team plays are important. As the ways we work keep evolving and technology keeps shaping work environments, one key factor that will distinguish top performing organizations from the rest is the quality of people and how these people work together.
Indeed, the people that work for an organization are and will continue to be the only source of sustainable competitive advantage for an organization. Processes can be copied, technologies can be improved upon, strategies can be replicated but what is difficult to replicate or improve upon is the culture you have created within the people in your team.

The goal of everyone who leads a team should be to get their team to a high-performance level as quickly and seamlessly as possible.
The typical stages a newly formed team goes through before reaching high-performance is illustrated in the Tuckman’s Team Development Model below:
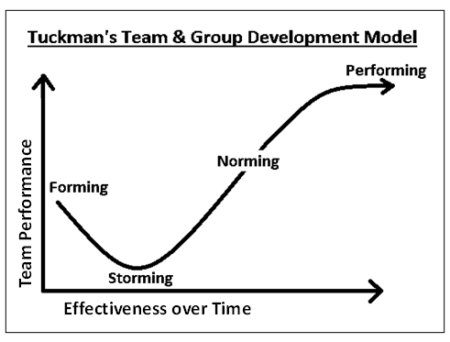
Here’s a deep dive of the how the team members feel in each of these stages and the potential behaviours you would observe as a leader for the team:
STAGE 1: FORMING:
Definition: this is the early stage of the team when the team is just coming together. It could either be when the team is newly constituted for the first time or when the team has a new member join.
How the Team Feels: during this stage team members are usually excited to be part of the team and eager about the work ahead. Members often have high positive expectations for the team experience. At the same time, they may also feel some anxiety, wondering how they will fit into the team and if their performance will measure up.
Behaviours You Would Observe: as a sales group leader you would notice team members will have lots of questions reflecting both their excitement about the new team and the uncertainty or anxiety they might be feeling about their place on the team.
STAGE 2: STORMING:
Definition: this is the stage where the team is beginning to settle into their roles and the personalities of the team members begin to surface and potentially conflict.
How the Team Feels: As the team begins to move towards its goals, members discover that the team can’t live up to all of their early excitement and expectations. Their focus may shift from the tasks at hand to feelings of frustration or anger with the team’s progress or process. Members may express concerns about being unable to meet the team’s goals. During the Storming stage, members are trying to see how the team will respond to differences and how it will handle conflict.

Behaviours You Would Observe: Behaviors during the Storming stage may be less polite than during the Forming stage, with frustration or disagreements about goals, expectations, roles and responsibilities being openly expressed. Members may express frustration about constraints that slow their individual or the team’s progress; this frustration might be directed towards other members of the team, the team leadership or the team’s sponsor. During the Storming stage, team members may argue or become critical of the team’s original mission or goals.
STAGE 3: NORMING
Definition: During the Norming stage, members shift their energy to the team’s goals and show an increase in productivity, in both individual and collective work. The team may find that this is an appropriate time for an evaluation of team processes and productivity.
How the Team Feels: During the Norming stage of team development, team members begin to resolve the discrepancy they felt between their individual expectations and the reality of the team’s experience. If the team is successful in setting more flexible and inclusive norms and expectations, members should experience an increased sense of comfort in expressing their “real” ideas and feelings. Team members feel an increasing acceptance of others on the team, recognizing that the variety of opinions and experiences makes the team stronger and its product richer. Constructive criticism is both possible and welcomed. Members start to feel part of a team and can take pleasure from the increased group cohesion.
Behaviours You Would Observe: Behaviors during the Norming stage may include members making a conscious effort to resolve problems and achieve group harmony. There might be more frequent and more meaningful communication among team members, and an increased willingness to share ideas or ask teammates for help. Team members refocus on established team ground rules and practices and return their focus to the team’s tasks. Teams may begin to develop their own language (nicknames) or inside jokes.
STAGE 4: PERFORMING
Definition: In the Performing stage, the team makes significant progress towards its goals. Commitment to the team’s mission is high and the competence of team members is also high. Team members should continue to deepen their knowledge and skills, including working to continuously improve team development. Accomplishments in team process or progress are measured and celebrated.
 ’
’
How the Team Feels: In the Performing stage of team development, members feel satisfaction in the team’s progress. They share insights into personal and group processes and are aware of their own (and each other’s) strengths and weaknesses. Members feel attached to the team as something “greater than the sum of its parts” and feel satisfaction in the team’s effectiveness. Members feel confident in their individual abilities and those of their teammates.
Behaviours You Would Observe: Team members are able to prevent or solve problems in the team’s process or in the team’s progress. A “can do” attitude is visible as are offers to assist one another. Roles on the team may have become more fluid, with members taking on various roles and responsibilities as needed. Differences among members are appreciated and used to enhance the team’s performance.
To understand how this model may apply to your SalesGroup, there are few things to have in mind:
1. Continuous Cycles: any time any form of change is introduced into the team, the team dynamics change and ultimately it has become a new team. Examples of such change include a team member joining or a team member leaving. A reorganization of the team which may or may not involve new leaders is also a form of change. The fact that these changes are likely to happen often shows the possibility that a team can consistently undergo these cycles.
2. Acceleration: the main goal is not to try to skip any of these stages, as research has shown all teams go through them. The goal is to accelerate your team through storming and norming so you can get to performing as soon as possible. Learning how to accelerate through the stages becomes more pertinent when we appreciate the first point above that it is possible for the team to go through these stages in continuous cycles every time there is a change to the team.
3. Sustaining High Performance: knowing how to effectively accelerate your SalesGroup to ‘performing’ and knowing how to keep them there, for as long as possible, becomes the focus of every leader within your SalesGroup. This is how to keep the team at a high-performance level.
One major way that you can accelerate your team through the stages to ‘Performing’ and sustaining that high-performance level, is by intentionally creating a strong team culture.
Case Study
In this video, Karen Thomas, EVP of Americas Sales & Services at Teradata was in discussions with some other colleagues and consultants on what it takes to build a truly world-class sales team.
As you watch the video, listen to the different drivers for building the team culture and how there is a strong cultural connection between the core sales team and the other teams that support the sales team, which are part of the larger SalesGroup.
Building a Strong Sales Culture – Video Link
Teradata Corporation is an American software company that provides cloud database and analytics-related software, products, and services. With an annual revenue of about $ 1.8 billion US, Teradata operates in North America, Latin America, the Middle East, Africa, and Asia.
The 3 Key Elements of the Team Diagnostics
The Team Diagnostics review will be done along 3 main areas: Organization Structure, Workforce Analysis and Team Culture Review.
The illustration below shows how these 3 elements of the Team Diagnostics come together to impact the overall effectiveness of the team.

Organization Structure Review
This is the first element of evaluating how well your SalesGroup is set up to function as a team. The organization structure is meant to provide clarity on the roles and responsibilities of the different teams within your SalesGroup. The structure also provides a basis for organizing your SalesGroup to target different market segments, industry lines or geographies.
Here are the parts of your organization structure that should be assessed:
1. Clarity of Roles: each part of an organization structure is intended to focus on specific areas of work. When the roles of the different teams within the organization are not clear, gaps and overlap of work are what occur preventing a team from performing at its peak. Clarity of how each team within your SalesGroup is involved in the Customer’s Buying Journey and the Customer’s Experience Journey will ensure your SalesGroup is functioning as a high-performance team. How would you describe clarity of roles within your SalesGroup?
2. Clarity of Reporting Lines: some organizations adopt a dual reporting or matrix structure which may have some benefit, but they generally make it challenging for team members to have clarity on who they report to. This becomes even more challenging in times of conflicting views between the two or more leaders they report to. Ensuring that all team members have clarity on who their primary line manager is, helps to drive overall team effectiveness. How would you describe clarity of reporting lines within your SalesGroup?
3. Length of Chain of Command: chain of command within an organization refers to the number of levels between the highest rank and lowest rank within the organization structure (see illustration below). It has been shown that the more the levels the more rigid the team as there are multiple approval levels before things move forward. The high-performance organizations lean more towards a flatter structure with as fewer levels as possible. How would you describe the Chain of Command within your SalesGroup?
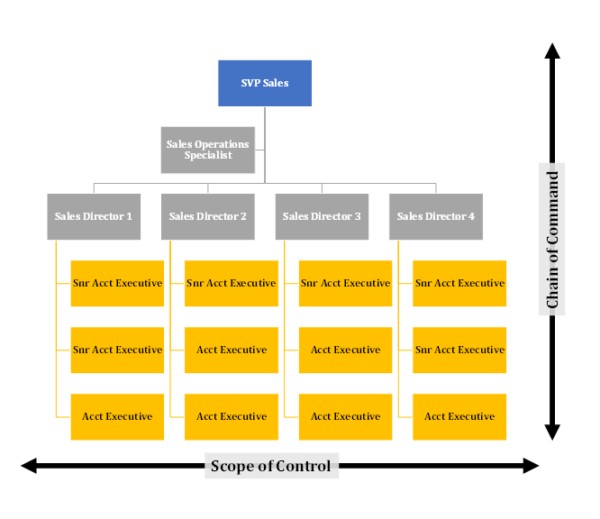
4. Width of Span of Control: span of control refers to the number of individual people directly reporting to a manager (see illustration below). It has been shown that the optimum number of direct reports is between 5-7. Leading practices indicate that when that number is too high, it is impossible for the manager to give the same level of support and guidance to all direct reports. How would you describe the Span of Control within your SalesGroup?
Exercise 2.2
Workforce Analysis
Under this second element of the Team Diagnostics, we will be analyzing a number of dimensions related to the team members within your SalesGroup.
The specific dimensions of the workforce that will be analyzed are listed below:
1. Workforce Numbers: This refers to the number members within the various teams in your SalesGroup. How would you compare the ratio of the number of team members you have to the sales targets and customers that these teams are expected to achieve or support?
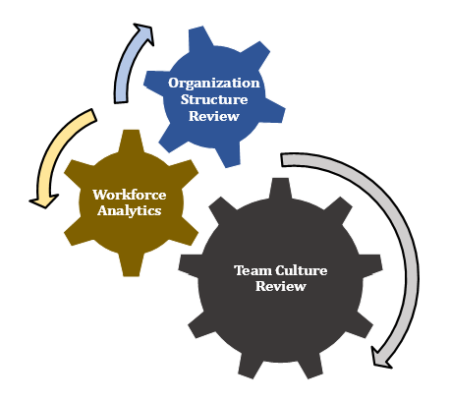
2. Team Competency: This refers to the knowledge, skills and behaviour traits of the members of the different teams within your SalesGroup. How would you describe the teams’ competencies in comparison to where you believe it should be?
Exercise 2.3
Team Culture
Peter Drucker is famously quoted as saying “Culture eats strategy for breakfast”. This emphasizes the critical importance of having the right culture within your team. If the culture is not right, no amount of strategy or enablement can make that team have high-level performance.
Due to the seemingly nebulous nature of culture, we will be focusing more on measurable outcomes of a culture within a typical sales organization. These outcomes are the two dimensions we will be using to assess your team culture; they are Collaboration and Competition.
1. Collaboration: sales is like a team sport and the most successful sales teams have learnt how to effectively collaborate to leverage the unique skills and experience that each member brings to the team. Some of the main ways you can assess the level of collaboration within a team is:
• Seamless sharing of information across the team.
• Ready willingness to lean in and help another team member.
• Strong respect for guard rails around sales accounts, customers, territories & products.
As you consider your sales group in the light of this description above, how would you rate the level of Collaboration?

2. Competition: while collaboration is critical for a sales team, ensuring there is still a healthy level of competition is equally important for the sales team to continue to challenge themselves to achieve and surpass targets. Here are some ways you can assess the level of competition within a team:
• Clarity on goals/targets and how performance is measured.
• Clarity on how top performers are recognized and rewarded.
• Each team member demonstrates ownership of their performance and results.
As you consider your sales group in the light of this description above, how would you rate the level of Competition?

For any sales organization to function at its top potential, there needs to be a healthy tension between collaboration and competition. When there is too much collaboration, the positive competition that drives a salesperson to seek how to perform better than colleagues to ultimately hit or surpass quota will be lacking.
On the other hand, when there is too much competition, the strong collaboration that the team requires to effectively leverage each others’ strengths to achieve more together will be lacking.
This leads to the dilemma of sales leaders ‘How do you determine the right amount of competition and collaboration for your SalesGroup?’. There is no one size fits all and depending on the maturity of your organization and the size of your SalesGroup what is expected level will vary.
However, with the benefit of experience and what you have seen work in the past, you will be able to define for your SalesGroup what you expect the level of competition and collaboration to be.
Exercise 2.4
Course Manual 3: Target Diagnostics
Introduction
The objective of this course is to assess the level of clarity your SalesGroup has regarding the principles and processes involved in defining, monitoring, reporting, and rewarding achievement of sales goals/targets.
This course is not intended to provide the ‘gold standard’ for these principles/processes. Rather it is meant to emphasize the importance of ensuring team members understand all the support your organization is giving them to ensure they are clear on what good performance looks like and how your organization rewards good performance.
Exercise 3.1
Clarity is Kindness
The statement “Clarity is Kindness”, probably made popular by Brene Brown, highlights the power that clarity connects with people not just on a logical level but on an emotional level.
With regards to Target Diagnostics, there are 3 main business processes which require clarity. These business processes are:
• Define: defining sales targets and measures of performance at an individual and team level including the quantity and quality elements of these targets.
• Monitor: the steps and technologies involved in tracking and monitoring the performance of the sales team against the defined targets including at what point the target is considered as achieved for example at the point of closing the sale or when -payment is received.

• Reward: the policies and procedures involved in recognizing and rewarding the achievement of targets including incentives, commissions, bonus, and other non-monetary rewards that are in place.
Ensuring clarity along these 3 levels, allows each member of the SalesGroup feel like they have an equal chance in meeting their quota and that there are no hidden agendas. The latter sections of this Course Manual dig deeper into these 3 business processes.
What Happens When There is No Clarity:
When these key business processes related to defining, monitoring, and rewarding sales targets are not clear, the impact on your SalesGroup can show up in a number of ways:
1. Poor communication: When these processes are not well-defined and documented, information can get lost, distorted, or delayed. This can lead to misunderstandings, errors, conflicts, and missed deadlines. These are the leading indicators that something within these business processes related to defining, monitoring, and rewarding sales targets is broken and needs to be fixed. It is easy to assume that poor communication within teams is either due personal differences in communication style or technology limitations. However, in most cases, poor communication is only an indicator of a bigger issue.
2. Broken Trust: When processes related to target definition, measurement and reward are not clear it sends a message of lack of transparency within the team. This ultimately leads to a breach of trust and when trust is broken, the team is not able to fully deploy their energy and time towards achieving the targets because they are not sure how their efforts will be rewarded. As John Maxwell says, ‘Trust is the Foundation of Leadership” when a leader’s team has lost trust in the leader, there is very little the leader can do to get the full commitment of such a team.
3. Confusion & Waste: When there isn’t enough clarity, the SalesGroup does not know what they are supposed to do or how what they are doing will ultimately impact how they achieve their targets and/or how they are rewarded based on those targets. This is likely to result in the team wasting time and resources trying to figure out the best way to complete their tasks or they avoid them altogether.

4. Financial Impact on Top & Bottom Line: confusion and waste within the SalesGroup often result in inefficiencies with associated significant costs to the organization. This impact can be even more detrimental to the organization if you have a very large SalesGroup and such inefficiencies become multiplied by the number of people. The first financial impact is to the top line sales revenue. Because the SalesGroup is not operating to maximum capacity they are not achieving quota, and this impacts the topline. The second financial impact is to the bottom-line profit. Recognizing that one of the largest cost items within the cost of sales category of most organizations is the people, the lack of clarity of the processes related to defining, monitoring, and rewarding performance could also significantly increase cost of sales and ultimately profit margins.
5. Reduced quality and innovation: With the amount of time spent and efforts used by employees to understand unclear processes hinders their ability to direct their energy towards high-quality output and innovation. This deprives the SalesGroup of valuable insights and ideas that could contribute to the success of the team now and in the future.
These impacts further emphasize why you need to ensure clarity in the processes related to target definition, measurement, and reward.
Case Study
Through this video, we will delve into the story of Steve Jobs upon his return to Apple and how one of the key actions, he took brought clarity to the Company and paved the way for the success it has continued to enjoy till today.
While watching the video, pay attention to the narrator’s insights on simple strategies that can enhance clarity in various aspects of life.
Take some time to reflect on how improving personal clarity can elevate individual productivity. Also, think of how fostering clarity within your SalesGroup can similarly contribute to enhanced productivity and success.
Clarity in Apple’s Transformation Story – Video Link
What exactly did Steve Jobs Do When He Returned to Apple in 1997?
Fresh off a partnership deal with Microsoft that injected Apple with $150 million, one of Jobs’ first goals as CEO was to review the company’s sprawling product line. What he found out was that Apple had been producing multiple versions of the same product to satisfy requests from retailers. For instance, the company was selling a dozen varied versions of the Macintosh computer.
Unable to explain why so many products were necessary, Jobs asked his team of top managers, “Which ones do I tell my friends to buy?” When he didn’t get a simple answer, Jobs got to work reducing the number of Apple products by 70 percent. Among the casualties was the Newton digital personal assistant. Unfortunately, the cut-backs also resulted, in part, in a workforce reduction of about 3,000 employees.
“Deciding what not to do is as important as deciding what to do,” Jobs is famously quoted as saying. “It’s true for companies, and it’s true for products”
The move to a smaller product line and a greater focus on quality and innovation paid off. During Jobs’ first fiscal year after his return, ending in September 1997, Apple lost $1.04 billion and was “90 days from being insolvent,”.
However, one year later, the company turned a $309 million profit and has continued to be remarkably profitable since Jobs’ plan laid the groundwork for Apple’s continued innovation till today.
The 3 Key Elements for Target Diagnostics
The Target Diagnostics review will be conducted through 3 main considerations: Definition, Monitoring & Reporting and Reward & Recognition.
The illustration below shows what these 3 considerations focus on and how these come together to give a more informed view on the processes involved in setting and rewarding achievement of sales targets.
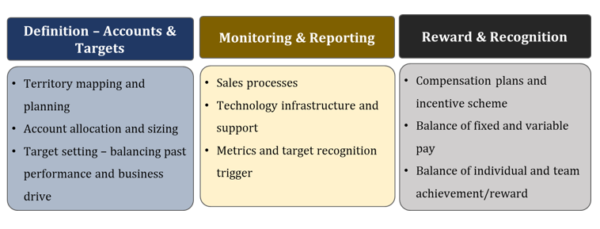
Definition – Accounts & Targets
This review element focuses on the principles and processes involved in defining territories, accounts, and targets for members of your SalesGroup. Ensuring clarity of these principles and processes helps provide an objective for allocating these accounts and helps to give all members of your team a sense of having a level playing field, because everyone is provided with the same basic building blocks needed to succeed.
Within the ‘Definition’ element of the review, these specific areas need to be reviewed:
1. Territory Mapping & Planning: A sales territory refers to a collection of sales accounts or customer groups which are assigned to a sales team or sales team members in order to achieve defined sales objectives and targets. Exploring these various methods below can help guide you in providing more clarity to your team on how territories are allocated:
• Geographic Location: Creating territories based on the physical location of customers is a straightforward method for identifying sales areas and distributing them to sales team members.
• Population: Dividing sales territories based on population density can help ensure that sales reps have a manageable number of customers to work with.
• Account Size: Dividing sales territories based on the size of the accounts can help ensure that sales reps are assigned to customers that are a good fit for their skills and experience.
• Niche: Dividing sales territories based on the type of customer or industry can help ensure that sales reps are assigned to customers that are a good fit for their skills and experience.
• Products: Dividing sales territories based on the products being sold can help ensure that sales reps are assigned to customers that are a good fit for their skills and experience.
• Hybrid: A combination of the above methods can be used to create hybrid sales territories that are tailored to the specific needs of the company 1.
Ultimately what is critical is ensuring a consistent approach is adopted and that this approach is clearly communicated to the members of your SalesGroup. As you consider the principles and processes your organization adopts mapping out sales territories, how would you rate the level of clarity of that process.
2. Account Allocation & Sizing: this refers to how you share accounts among members of your SalesGroup. Since territories are made up of accounts, this situation of account allocation will only occur when the territory is allocated to a sales team, instead of individuals. When the territory is assigned to a sales team, account allocation helps to ensure each member of that sales team has accounts that are commensurate with their profile. In determining the profile of each sales team member, the following factors should be considered:
• Job Level – since team members are placed at job levels based on their prior experience, ensuring that each sales rep’s account allocation aligns to their job level is important. For example, the accounts allocated to a Sales Director should be different from the accounts allocated to a Sales Rep.
• Knowledge & Skills – when teams are selling to different industries and buyer personas, it is important that the knowledge and skills of your sales reps are matched to the industries they will be selling to and personalities they will be interacting with. This helps sellers to better build the credibility and connections required to close deals.
• Geographic Location – if your territory mapping is geography based, it is important to consider where your sales team members are located while assigning their accounts to them.
• Past Performance – in sales you want to ensure you keep stretching and empowering your top performers while giving your not so top performers the opportunity to also achieve their targets. This is why assigning targets based on what each seller has achieved in the past is a great way to set everyone up for success.
A disconnect with any of these factors will affect the clarity of the principles and processes involved in account allocation and sizing. With this consideration, how would you assess the account allocation and sizing within your organization?
3. Target Setting: this considers the principles and processes involved in defining the targets for each sales team. It aims to ensure that the drive for business growth is effectively balanced with the reality of past business performance and that these often, contrary perspectives are both fully considered while defining the targets for the SalesGroup. As you consider the target setting process for your organizations, how would you rate the level of clarity.
Exercise 3.2

Monitoring & Reporting
That which cannot be measured, cannot be improved upon or rewarded. As such, ensuring the principles and processes that guide monitoring and reporting are well defined is critical as part of the target setting and reward process.
The specific dimensions of this element that should be reviewed are:
1. Sales Processes: ensuring that sales processes are well defined in a way that allows for clear measurement of progress of opportunities along the sales journey is critical for monitoring and reporting on opportunities. Sales Stages provide a bedrock for pipeline forecasting and other reporting processes. As you consider this, how would you describe the clarity of the sales processes within your SalesGroup?
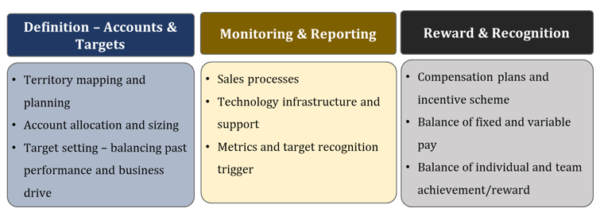
2. Technology: with the proliferation of various sales technology tools, it is important your SalesGroup is well aware of what these tools are and how they seamlessly work together to help them monitor and report progress against realization of their goals/targets. How would you describe the clarity that your SalesGroup has in understanding the technology supporting their sales target related processes.
3. Metrics & Triggers: one of the areas where sales teams have struggled to provide clarity is on the specific metrics and triggers that confirm when a sale is completed for the purpose of rewarding the seller. Some organizations set the trigger for when the contract or purchase order is signed, others for when the first or last payment is received. While this trigger may differ based on the model of the business, it is important that the members of the SalesGroup know exactly what the trigger is. As you consider this for your SalesGroup how would you describe the level of clarity?

Exercise 3.3
Reward & Recognition
This is the third element that is considered during the Target Diagnostics. It is focussed on the principles and processes related to recognizing and rewarding members of the SalesGroup based on their achievements against sales goals/targets.
The specific dimensions of this element are:
1. Compensation Plans: this refers to the financial reward and incentive schemes that have been defined to reward team members who achieve or exceed sales targets/goals. Depending on the model of your business this may be quite complex in how it is set up. It is important that team members clearly understand how they are to be compensated. It helps to build transparency and trust within your SalesGroup. How well would you describe the level of clarity your SalesGroup has regarding your compensation plans and incentives?
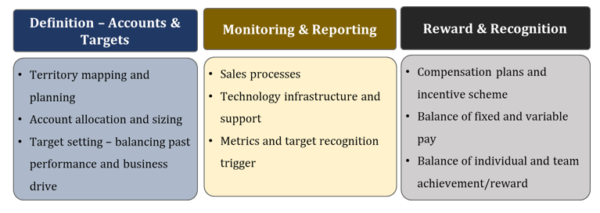
2. Balance between Fixed/Variable: this is an area where many organizations apply some considerable amount of effort to find an optimum balance between what constitutes fixed, and variable pay for their SalesGroup. An overemphasis of the fixed portion can result in a complacent workforce and an overemphasis of the variable portion can result in a discouraged workforce. As such ensuring your SalesGroup is clear on the balance between the fixed and variable pay and why your organisation has chosen the model you are using is critical for overall success. How would you describe this clarity within your SalesGroup?
3. Individual & Team Balance: another area where organizations may have a challenge is in defining the balance between how you reward individual performance and how you reward team performance. This balance is very linked to the Team Culture you intend to build within your SalesGroup (kindly refer to Course Manual 2: Team Diagnostics). An overemphasis of individual reward can result in very competitive culture that is counterproductive. While an overemphasis of team reward can result in an overly collaborative culture, one that does not promote healthy competition within the SalesGroup. As with other dimensions, there is no right or wrong answer, what is more critical is ensuring that your SalesGroup fully understands the reasons for the balance you have adopted. How well do you think they understand this within your organization?
Exercise 3.4
Course Manual 4: Productivity Diagnostics
Introduction
The objective of this course is to assess how long it takes for your new hires or new promotions to reach ‘optimum productivity’.
For the purpose of this course, ‘Optimum Productivity’ refers to the average productivity levels of your top 20% performers. This metric of average productivity level provides a useful benchmark for assessing how many weeks or months it takes your new hires or new promotions to reach that level of productivity.
Exercise 4.1
Activity vs Accomplishment
One of the key mindsets that separates average sales organizations from the top ones is the ability to effectively distinguish between activity and accomplishments. As John Maxwell, one of the top leadership voices, so eloquently put it “When we are busy, we naturally believe that we are achieving. But business does not equal productivity. Activity is not necessarily accomplishment.” (taken from his book ‘The 21 Irrefutable Laws of Leadership’)
For the purpose of this course, we can define Activity as the state of being busy doing things. Some examples of this within your SalesGroup would include the number of emails sent, the number of cold calls made, the number of social media content posted on the different platforms, the process of scheduling a sales meeting, preparing proposals in response to RFPs, organizing and delivering a marketing event etc.
Accomplishment, on the other hand, refers to achieving defined results and targets. Examples within a sales organization include, # of qualified leads, # of qualified opportunities, % deals won, average deal cycle, etc.
As you critically evaluate the examples of both activity and accomplishment, you will notice that there’s a potential misconception wherein the activities themselves are perceived as the sole measure of productivity. It is important to note that the execution of these activities do not guarantee the achievement of intended objectives. For instance, the act of posting a marketing message on social media is not merely about the act of posting; its purpose lies in creating a meaningful impact within the social media sphere. This involves leveraging platform algorithms to enhance reach, thereby stimulating engagement with target market segments and ultimately, generating lead.
So, the activity of posting on social media is meant to accomplish the generation of leads and until it accomplishes that, it continues to just be ‘an activity’.

The points below further highlight the relationship between ‘Activity’ and ‘Accomplishment’ from a perspective of defining productivity metrics:
1. Both are Productivity Metrics: The level of productivity within your SalesGroup will typically be measured by Productivity Metrics. Productivity metrics are a series of activities and accomplishments that help you evaluate how much effort your team is exerting towards achieving set targets. These metrics also help you assess the contribution of each member of the team towards the overall metrics of the team. They are a series of leading indicators that help you drive your team to achieve defined sales targets/goals. When they are effectively used, they help ensure your team is consistently driving towards the set targets.
2. Activity Leads to Accomplishment: While there is a clear difference between ‘Activity’ and ‘Accomplishment’ it is important to also note that a series of well planned and executed activities eventually lead to an accomplishment. This means that as long as you focus the team on activities that are directly linked to accomplishments, you are leading the team along the right path. The issue is when there is an overemphasis on activities especially the ones that do not lead towards accomplishment.
3. Value-Adding Activities: Distinguishing between ‘Activity’ and ‘Accomplishment’ within your SalesGroup will help you ensure the team is focusing on only value-adding activities i.e. the activities that cumulatively result in an accomplishment. The ability of an activity to result in an accomplishment becomes the basis of determining if an activity is value-adding or not. As such ‘value’ simply means does this activity help us reach our accomplishment targets or not.
4. Less Activity for More Accomplishments: the goal of driving optimum productivity is to ensure that your SalesGroup is able to gradually transition to less activity to achieve more accomplishments. This means over time you are able to identify the activities that result in higher levels of accomplishment and focus the team on this. As the team focuses on this and stops focusing on the less value-adding activities, it produces a ‘magic’ that grows profitability within your SalesGroup.
This clarity between Activity and Accomplishment will provide you with the right foundation to start conducting the Productivity Diagnostics as part of your overall Enablement Diagnostics.
Case Study
In this video, listen to Rich Chiarello talk about Onboarding and get a deeper understanding of why providing your new hires (and new promotions) with a comprehensive Onboarding program is essential.
As you watch the video, keep in mind that the overall objective of an Onboarding program is to get the new hires to operate at an optimum productivity level as soon as possible.
It underscores the importance of clearly defining productivity metrics, because without this, you are unable to confidently say if the onboarding program is achieving its objectives.
Tips for Onboarding New Team Members – Video Link
Rich Chiarello is President and CEO of Above the Line LLC. He is an authorized Sandler Training Franchisee. Sandler Training is the worldwide leader in sales training. They empower on the average over 50,000 sales professionals and leaders each year to master the craft of selling. They are a serial recipient of Top 20 Company for sales training for 2021, 2022 and 2023.
The Power of Leading Indicators
Indicators are metrics that help you understand how things are progressing and they help you and your team measure the level of success the team is achieving. There are mainly two categories of indicators:
• Lagging Indicator: is a metric you are able to measure after the desired outcome has occurred. It provides insights into past performance, giving organizations the ability to analyze and evaluate the effectiveness of their sales strategies and activities. Lagging indicators are typically easier to measure because they have already happened. The disadvantage with them however is that there is no way to act on what the indicator is telling you to influence the outcome. Since the outcome has already happened. The only way you can use it to influence the outcome in the future is to observe the trend the past indicators provide and use that to project what would likely happen in the future.
Examples of lagging indicators include revenue, sales growth, customer retention rate.
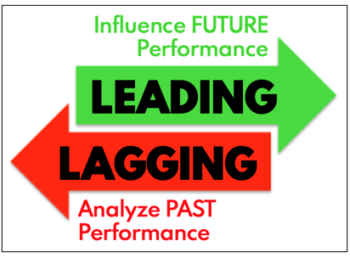
• Leading Indicator: is a metric that you are able to measure before the desired outcome. It provides insight into likely future outcomes, giving organizations the ability to act accordingly in the present to influence the future. Leading indicators are not as easy to measure and the interpretation of what is measured can sometimes be subjective. The main advantage of Leading indicators, however, is their ability to predict future outcomes. This provides you with an opportunity to make some adjustments and corrections before the outcome is achieved. Leading indicators can help sales managers and salespeople predict the success of their sales team.
Examples of leading indicators include number of sales calls made, number of meetings scheduled, number of proposals sent.
Majority of the metrics often reported by sales organizations can be said to be more in the lagging indicators category, such as revenue and sales growth. However, the more successful sales organizations have learnt to place an equal or sometimes even more emphasis on leading indicators. This is because leading indicators provide you with an opportunity to adjust in the present to change the future, if so desired.
Unlike lagging indicators, where the result is already past and there is nothing that can be done in the present to change the past.
Why Focus on Leading Indicators?
Focusing on leading indicators within your SalesGroup provides you some powerful advantages as listed below:
1. Faster Feedback: By tracking leading indicators, your SalesGroup can get feedback on their efforts more quickly and determine what actions they might need to take to achieve their overarching objectives. In many cases, leading indicators can be measured on a frequent basis either daily or weekly. This shorter frequency ensures the team is receiving faster feedback that can be acted on now to change the outcome later on.
2. Team Effectiveness: A revenue target is a very broad goal that is a culmination of many other smaller goals (or leading indicators). In a very large SalesGroup it can be challenging for every team member to see how what they are doing is connected to this ultimate goal, especially if they are not involved in direct sales. By emphasizing leading indicators across your SalesGroup, you provide an opportunity for every team member to have better clarity on how their roles ultimately lead up to the achievement of revenue. This provides every team member to have a better appreciation of how the different teams contribute towards the achievement of the ultimate goal. Accordingly, everyone is more vested in tracking and improving performance.
3. Better Decision-Making: Leading indicators provide real-time data on how the SalesGroup is progressing against defined targets. The leading indicators tell you if your team is hitting the right metrics to achieve the ultimate goals. This information can help you make better decisions about where to focus your efforts. The highest quality of discussions are data driven discussions because they help everyone mitigate the risks of sentiments and difference in perspectives. Data driven discussions ultimately result in high quality decisions that are grounded in objective facts.
4. Improved Forecasting: By tracking leading indicators, you can better predict future outcomes which eventually become your lagging indicators such as sales revenue. Using leading indicators provides you with a confident basis to conduct sales forecast which is a critical element of managing a business. Sales forecasting is a crucial aspect of business planning that can help companies predict future sales performance and estimate future revenue. It can help businesses make informed decisions, allocate resources more effectively, and improve goal setting. Focus on leading indicators can help a business do forecasting more effectively.
5. Increased Accountability: Leading indicators can help sales managers hold their team accountable for their performance. By tracking these metrics, sales managers can identify areas where their team needs to improve and provide coaching, and support as needed. The British physicist and mathematician, William Thomson Kelvin, is often quoted as saying: “What is not defined cannot be measured. What is not measured, cannot be improved. What is not improved, is always degraded.” When you emphasize leading indicators within your SalesGroup, you provide a platform for every team member within your SalesGroup to measure and improve their performance, so their contributions are not downgraded.
6. Better Alignment: Leading indicators can help ensure that everyone on the sales team is working towards the same goals. By tracking these metrics, sales managers can identify areas where their team needs to improve and provide coaching, and support as needed.
7. Increased Motivation: Leading indicators can help motivate salespeople to achieve their goals. By tracking these metrics, your SalesGroup can see how their efforts are contributing to the overall success of the team and feel more motivated to succeed.
While the above points emphasize the benefits of having leading indicators, you however need to exercise caution and avoid the tangent of over-emphasizing on leading indicators that do not eventually result in achieving the desired lagging indicators.
The measurement of productivity metrics is to bridge this gap between leading indicators (activities) and lagging indicators (accomplishments). This underscores the importance of conducting a Productivity Diagnostics to see how your sales enablement function is helping to bridge this gap.
Approach for Conducting Productivity Diagnostics
The real value of new hires (and new promotions) will only be achieved when we are able to get them to the desired levels of productivity as soon as possible through comprehensive onboarding programs.
The overall objective of the Productivity Diagnostics as part of the overall Enablement Diagnostics is to evaluate effectiveness of onboarding programs by measuring productivity levels.
Productivity Diagnostics begins with defining what productivity metrics are most critical for your SalesGroup, comparing that to your top performers and identifying if there are any gaps. The approach is illustrated below:
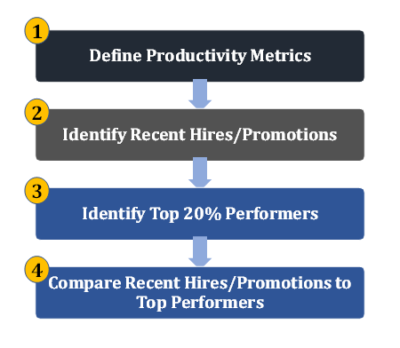
The specific steps involved in executing this approach are as follows:
• Step 1: Define Productivity Metrics
This step is focused on identifying the specific productivity metrics that you want to measure. Recognizing there may be a myriad of activities and accomplishments that can be measured, this step is to help you refine and identify the top 5 you would like to measure. Some examples of productivity metrics categorized by activity and accomplishments are listed below:
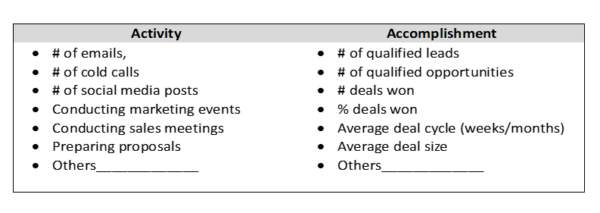
Exercise 4.2
• Step 2: Identify Recent Hires or Recent Promotions
This step focuses on identifying the members of your SalesGroup who are relatively new in their positions. This ideally will consist of those who were recently hired or those who were recently promoted.
The reason for identifying this group of team members is based on the assumption that they are still on a learning curve of understanding all that they need to know and do to operate at an optimum productivity level within the SalesGroup.
The definition of a ‘recent hire or promotion’ may vary from one organisation to another; however a recommended benchmark is anyone who moved into that role within the last 0 to 15 months.
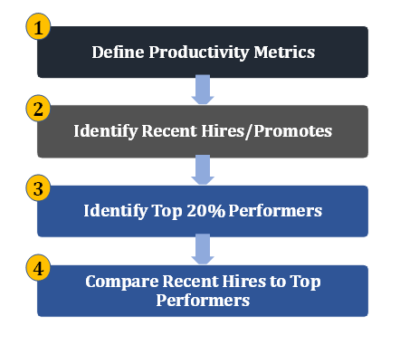
Exercise 4.3
• Step 3: Identify Your Top 20% Performers
In this step we will be working to identify the top 20% of your performers. This group provides a good benchmark for assessing how long it takes your new hires/ new promotions to reach optimum productivity levels.
The reason why benchmarking to your top performers is a preferred approach to benchmarking against some predefined industry standards is because comparing to top performers who are within the same working environment, using the same tools and facing the same challenges as the new hires, provides a more reliable basis of comparison.
Some of the factors to consider in identifying this top 20% include:
1. Similar Roles – the performers you will be using as the benchmark should be within similar roles as the new hires you want to compare them against. This helps ensure that you are ‘comparing apples to apples’.
2. Similar Levels – it is important that the levels of the top performers and that of the new hires are as close as possible. This helps to ensure that the benchmarking is being done on a comparable basis.
Exercise 4.4

• Step 4: Compare Recent Hires/Promotions to Top Performers
In this final step we are conducting a comparison exercise to see how the productivity levels of your new hires/promotions rank up against the productivity levels of your top performers.
The comparison gives a clear indication on the effectiveness of onboarding programs aimed at getting recent hires/promotions ramped up to optimum productivity levels as soon as possible.
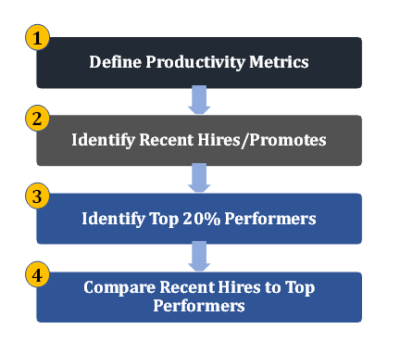
Exercise 4.5
Course Manual 5: Content Diagnostics
Introduction
The objective of this course is to assess the overall effectiveness of the content and collateral provided to your SalesGroup.
For the purpose of this course, Content refers to all sales material and collateral in various formats provided to the SalesGroup to enable them to have the right interactions with prospects and customers which increases the chances of that prospect/customer advancing progress along the customer buying journey.
The course is intended to help you better understand how your SalesGroup engages with sales collateral/assets and how it enables them to have more impactful interactions with prospects and customers.
Exercise 5.1
“This shows how the content provided to a member of a SalesGroup impacts their ability to influence the buying decisions of a prospect.”
Content: When More Can Be Less
Content refers to all assets, materials, tools guides, documents and resources that are designed to help the Sales Group have impactful interactions with the prospects and advance them along the customer buying journey.
These content types could be either external facing i.e., used directly in discussions with client or the content types could be internal, which means they are designed to enable the team by enhancing their knowledge, skills, mindset and/or behaviours.
In most cases, there are internal teams that help design, develop, and deliver these content types to the SalesGroup. And when the SalesGroup provides feedback to these internal teams that the content is not adequate, these teams respond by providing more content. If this cycle were to continue for a while where more content is produced every time the SalesGroup provides feedback, a time comes when there is so much content that the SalesGroup are now unable to effectively navigate the content to find what they need.

This is when ‘More can be less’ – more content resulting in less adoption/use by the SalesGroup. This situation can have adverse effects on both the SalesGroup and their ability to drive sales. Some of these effects include:
1. Lack of Clarity – having so many different options and versions of content can make it challenging for the SalesGroup to be clear on which content will be most relevant to which prospect or customer. This can greatly impact the ability of the salesperson to influence the prospect/customer along their customer journey.
2. Wasted Time – when the SalesGroup cannot easily find what they need, a lot of time is spent in looking for relevant content. This is productivity time that has been lost to a non-value adding activity. This can directly impact the salesperson overall ability to meet their targets.
3. Increased Stress – when SalesGroup have so many options and versions to choose from can result in a sense of feeling overwhelmed or anxious which can lead to an overall increase in stress which will directly impact the salesperson’s productivity.
4. Overwhelmed Prospects – in cases where the salesperson is not able to identify what is most relevant, they are likely to share all the content with prospects and this leaves the prospects very overwhelmed and unclear as to hot to proceed. This may stall their overall progress along the journey.
5. Potential Distrust – an old sales tactic was to overwhelm your prospects with information until they are cajoled to making a buying decision. Now that this very common knowledge a lot of buyers will begin to doubt the sincerity of a salesperson that is inundating them with more information than they can reasonably digest.
These impacts highlight the need to find the right balance between quantity and quality of content so the SalesGroup members can have the right interaction with prospects and move them along the customer journey.
Case Study
Through this video, we will review the story of Brendan Kane and how he leads his company to study content videos that go viral on social media.
As you watch the video, listen for the distinction between quantity and quality. Also listen for which should ideally come first.
Then take some time to consider how you can apply the insights around research and comparing to ‘a reference’ to how content is provided to your SalesGroup.
Content Quality VS. Content Quantity – Video Link
Brendan Kane grew his IG account to 1 million followers in 30 days. He runs research an analysis company to study viral videos. As such he knows what makes viral videos tick. In this interview with Brendan Kane author of One Million Followers and Hook Point, Chris and Brandan discuss the art behind consistently going viral with video.
Social media case study was chosen due to the high speed of getting feedback from an audience on the effectiveness of content.
How to Determine the Right Amount of Content:
Following the train of thought that more is less, may lead you to ask the question “Is it probably better not to have too much content?”. Interestingly the answer to that question is not so straightforward. The amount of content you will need for your SalesGroup really depends on several factors including:
• The Size of The Market – the larger your market, the higher the likelihood the SalesGroup will need more content to target the different market segments within the market. This, in part, depends on how you have segmented the markets you are targeting. It also depends on how significantly different those different market segments are. The more varied they are, the more you will need specific content for each market segment.
• The Complexity of Your Products and Services – if you are selling complex products and services, you will need more content to educate and explain to prospects/customers the features and benefits of your product/services. This is particularly true for innovative products or services which do not have a generally known category. As such customers do not have a prior frame of reference of what the product or service can do, and you will need to product enough content to explain to an audience at varying degree of understanding.
• The Length of Your Average Sales Cycle – if your average sales cycle is longer than 3 months, you will need more content to keep engaging your prospects and customers over the longer cycle. The diminishing law of intent, coined by Jim Rohn, states that “the longer you wait to do something you should do now, the greater the odds that you will never actually do it”. Applying this long to long sales cycles mean the longer the sales cycle, the less likely the buyer might be to purchase the product or service. To mitigate this risk, more content may be needed, strategically shared over the length of the sales process to keep reinforcing the values/benefits of purchasing the product or service.
• The Maturity of Your Product/Service – if your product/service has attained a certain level of maturity within the market, you will not need as much content as a new product or service. This is because newer products or services will need to provide more content and information to achieve a brand position in the mind of buyers.

It is critical to find the right balance between not having enough content and having too much content. Creating too much content can make it difficult to manage. On the other hand, not having enough content can lead to missed opportunities and a lack of engagement with your target audience.
To determine the right amount of content for your SalesGroup, here are some steps to consider:
1. Start with the “why”: Simon Sinek in his book “Start With Why”, emphasizes the need to first be clear on the purpose and the reason for doing something before proceeding to do it. Applying this to the world of content management, it is important to understand why you are creating a new piece of content before proceeding to develop the content. When asking about the “why” it is possible that the first reason you uncover may not be the main reason or only reason for the content. As such, some Root Cause Analysis techniques may be required to get to the actual heart of the “why”. By asking questions that get to the heart of the “why,” you can ensure that your content is aligned with these objectives and is meeting an authentic need (and not overlapping with an already existing content).
2. Identify your Target Audience: This is the next step after answering the “why” question. Determining who your target audience is, brings clarity in how the content is to be designed and developed. In identifying your target audience some factors to consider include who they are, where they are located, how much they know about your product or service, how they feel about your product or service. Conducting such detailed target audience analysis will help you better connect the dots between the ‘Why’ and the target audience. This should eventually lead to higher engagement levels with the content produced.
3. Organize Your Content: Organizing content in a way that is aligned to your customer’s journey allows you to easily see how each category and type of content is helping you advance the customer their journey. As mentioned before, the customer’s journey consists of both their buying journey and their experience journey. Organizing the content along this way will also provide a basis to have scheduled campaigns where different contents are pushed to the customer at different phases along their journey. Organizing your content this way will also help you see where you have more content when compared to others and it will help you assess spread of content all through the customer’s journey. When things are not organized, it is difficult to clearly see what you have enough of and what you are lacking in.
4. Track Your Metrics: What gets measured, gets improved. It is important to have metrics that provide quantifiable data and feedback on what content is resonating with prospects/customers and which ones are not. This will provide an objective basis to assess whether additional content is needed or not and determine the specific type of content required. Examples of metrics that can be used include website traffic, social media engagement, click rates, email open rates and response rates. This is where investing in relevant tools and technologies that will enable timely and accurate measurement of these metrics becomes critical.
5. Make Incremental Adjustments: Based on your metrics, begin to make incremental adjustments, and observe how the market responds to those adjustments this helps to give a more detailed view on what is working and what is not working. It also provides guidance for the team on where to spend more time, money, and effort to get even higher return on these investments.
6. Embrace Continuous Learning: ultimately the 5 steps listed above, need to become a continuous cycle of learning, implementing, and learning again. This will ensure that your content is always achieving business objectives by enabling your SalesGroup to effectively use the content to have meaningful interactions with customers and prospects to advance them along the customer journey.
Approach for Content Diagnostics
The approach for conducting the Content Diagnostics will focus on these two assessment areas:
Content Quality and Content Quantity
Content Quality – refers to the effectiveness of the content to impact its intended audience. The audience of external content will be prospects or customers. The audience for internal content will be the members of the SalesGroup.
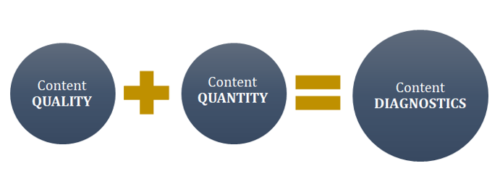
Content Quantity – this refers to the amount of content available to the SalesGroup around a given topic or content area and the ease with which the SalesGroup members can find what they need.
The findings from these two assessment areas provide a wholistic view of Content Diagnostics and will help you identify what is working well and the areas for further enhancement.
Conduct Content Quality Diagnostics:
The focus of this quality diagnostic is to assess the overall effectiveness of the content to impact the prospects/customers (for external facing content) and to impact the members of the SalesGroup for (internal content).
In conducting a quality diagnostic of your content, the following steps will be taken:
1. Define the Types of Content: define the types of internal and external content that you will be using to conduct the diagnostics. Some examples to consider include:
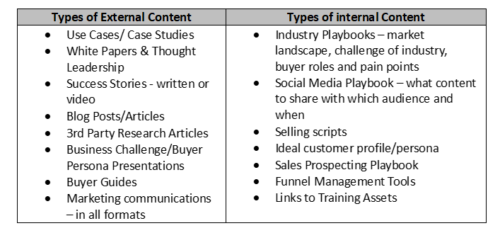
2. Determine the Time Horizon: determine the time horizon of when the content was produced/published, which you would like to use for the diagnostics. This helps you to focus on the more recent content and avoid errors due to content being obsolete. Some factors to consider in choosing the evaluation period include:
• Your Sales Cycle – the longer your sales cycle the longer the time horizon you would want to consider.
• Your Content Production Rate – if you have a very productive content generation team, then you would want to consider a shorter time horizon.
• Rate of Change in Markets – if you operate in markets that have a high rate of change, then you would want to consider a shorter time horizon.
• Ideal Time Horizon – from leading practices, the ideal time horizon is choosing content produced within the last 1 to 6 months.
3. Identify the Feedback Sources – determine the sources you would be using to get feedback on the content quality.
• For External Content:
• By directly asking the prospects/customers which content were impactful.
• By listening to and observing how the prospects/customers react to the different content shown.
• By measuring how often and how long prospects/customers interact with content shared with them through content management systems that have such measuring functionalities.
• For Internal Content:
4.
• By directly asking the members of the SalesGroup which content were impactful.
• By listening to and observing how the members of the SalesGroup react to the different content shown.
• By measuring how often and how long prospects/customers interact with content shared with them through content management systems that have such measuring functionalities.
Exercise 5.2
Conduct Content Quantity Diagnostics:
The focus of this quantity diagnostic is to assess the amount of content available to the SalesGroup around a given topic or content area and the ease with which the SalesGroup members can find what they need.
In conducting a quantity diagnostic of your content, the steps to be taken are similar to the steps taken for the quality diagnostic:
1. Define the Types of Content: refer to the details for this same section in Content Quality Diagnostics.
2. Determine the Time Horizon: refer to the details for this same section in Content Quality Diagnostics.

3. Identify the Feedback Sources – determine the sources you would be using to get feedback on the content quantity.
• For Sufficiency of Content:
• By directly asking the SalesGroup if the amount of content available is sufficient or not.
• By observing the indirect feedback provided by the SalesGroup on content they are missing or not having enough of.
• For Organization of Content:
• By directly asking the members of the SalesGroup how easy it is for them to find what they need.
• By observing the indirect feedback provided by the SalesGroup on the challenges they face in easily finding the content they need.
Exercise 5.3
Course Manual 6: Training Diagnostics
Introduction
This course is aimed at assessing the overall effectiveness of the training services provided to your SalesGroup to equip them to effectively advance the prospect along the customer journey.
The course aims to enhance your comprehension of how your SalesGroup engages with training materials and how these enable them to have the required knowledge, skills and/or behaviours to have more impactful interactions with prospects and customers.
Exercise 6.1
“This shows how the content provided to a salesperson impacts their ability to influence the buying decisions of a prospect.”
Training: A Shift from Activity to Outcome
Training refers to all the end-to-end process involved in designing, developing, delivering learning materials and initiatives to the SalesGroup to enhance their knowledge, skills and/or behaviours and make them more effective in their interactions with prospects and customers.
For training to be effective, it needs to be outcome based and not activity based. This means that the success of a training initiative is not in that the initiative is completed but that the participants are able to effectively demonstrate and/or apply what they have learned. As such effective training evaluates not the activity, but the outcome, which is learning.
This mindset shift from training to learning is the shift from activity to outcome. This shift of mindset impacts all the steps involved in designing the program, developing the materials for the program, and delivering the program. The illustration below highlights how the training mindset is more passive in nature while the learning mindset is more active in nature:
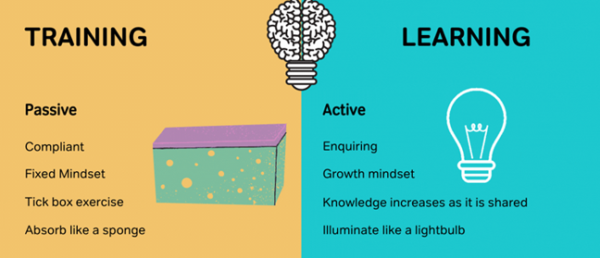
Detailed below are more specifics on how the shift from training to learning impacts different elements of the training value chain:
1. Quality over Quantity: when the focus shifts from training to learning, there is more intentionality in ensuring the quality of the training initiative provides an opportunity for participants to learn. This intentionality will require that some more time is spent in designing the training initiative, developing the materials, and the approach for delivering the content. This time investment would likely impact the ability of the team to produce many training initiatives. It will result in a prioritization of quality over quantity so that the learning outcomes can be fully realized. However, although there may be few training initiatives, the higher quality will ensure they are very impactful for the team.
2. User-centric Design: a focus on learning puts the participants (users) at the centre of the training design. Everything involved in the training is aimed at ensuring that it is contributing towards the participants ability to learn and apply the knowledge, skills and behaviours being communicated through the training initiative. This user centric approach will make the designers of the program ask questions like:
• How do we provide opportunities for participants to apply this learning during or immediately after the training program?
• What specifically will this training help our participants to do better as it relates to their key performance indicators?
• How would we assess the impact of this learning on the knowledge, skills, and behaviours of our participants?
3. Multiple Access Points: adopting a learning mindset will also be a forcing mechanism another major way to consider multiple ways of making the training programs and materials accessible to the members of your Sales Group. This will result in prioritizing a fit-for-purpose content management system (CMS) or learning management system (LMS) that allows for on-demand access to training content. This makes it easier for the team to easily acquire access the materials and gain the knowledge they need as close as possible to when they will need to apply the knowledge.
4. Adapted to Learning Styles: everyone has their most preferred way of learning per time. It could be by listening, reading, observing, or doing. There are some who have a blend of one or more of these learning styles. With a training mindset, the focus is more on developing the training program without considering how the participants prefer to learn. Having a learning outcome mindset, however, requires that these different learning styles are incorporated to how the training initiatives are designed and delivered. Where the preferred learning styles of the participants are not known, there is a need to intentionally incorporate all these different learning styles into how the program is being designed, developed, and delivered.

5. Planned Reinforcements: the concept of short and long-term memory suggest that information may soon be forgotten if there are no opportunities to apply what has been learnt or there no planned ways to reinforce what has been learnt. Having a learning mindset requires that you systematically have ways to get participants to apply the knowledge or to reinforce the knowledge. This reinforcement moves it from short term to long term memory so that the desired learning outcomes are sustained. A training mindset on the other hand, assumes that ones the training has been delivered, the objective is achieved. In reality, the objective is truly accomplished when the program has influenced the participants’ work behaviour i.e. when they have learnt something and are applying the newfound knowledge.
These points highlight the difference between ‘training’ and learning’ and they help you understand why adopting an approach focused on learning outcomes is critical for the overall effectiveness of the training initiatives you provide to the members of your SalesGroup.
Case Study
Through this video, we will dig deeper to understand the difference between ‘training’ and ‘’learning’ and why having a learning outcome mindset helps you adopt a more wholesome approach to enabling your SalesGroup.
As you watch the video, listen for the different things that constitute learning and think of how you may be able to apply these within your organization.
The Difference Between Training & Learning – Video Link
The L&D Academy is a learning and development firm focused on delivering the latest and most effective techniques, tools, and tips on how to effectively engender a learning culture within an organization.
Developing a Learning Culture
As we emphasize the shift from just training to learning, it is important to detail how you can develop a learning culture within your SalesGroup. Developing a learning culture in an organization can be a great way to foster growth and innovation. However, it is also good to remember that developing a learning culture is an ongoing process that requires commitment and dedication.
Here are some ways to start or further strengthen a learning culture within your SalesGroup:
1. Lead By Example: John Maxwell is famously quoted as saying, “Everything rises and falls on leadership”. The leaders of the SalesGroup would need to set the tone by creating the conducive environment and by modelling the required behaviours. Some practical steps leaders can lead by example are:
• By demonstrating their commitment to learning through taking part in relevant learning and enablement initiatives and supporting their team members to do the same.
• By openly talking about their learning journey, the mistakes made, and the benefits derived through learning.
• By encouraging team members to take risks and learn from their mistakes and not ‘punishing’ risk takers.
• By creating an environment where team members can share their learning journey experiences with others.
2. Provide Policy & Financial Support: Leaders can create or strengthen the policies/practices that support and encourage team members to take ownership of their own learning and development. It is also important that leaders support such policies and practices by providing the necessary financial support that will enable the SalesGroup learn new skills. Some ways of demonstrating financial support include:
• By providing funding for SalesGroup team members to attend external learning conferences and programs.
• By allowing members of the SalesGroup invest the time required to attend internal enablement programs and initiatives.
• By providing budgets to invest in relevant content management and learning management tools and systems that will help create a more robust learning experience for the SalesGroup.
• By providing funding to purchase training programs and packages from external firms that can be packaged and customised for the unique needs of your SalesGroup.
3. Recognize & Reward Learning: set up competitions, leaderboards, and other tools to recognize and reward team members who demonstrate a commitment to learning. The reward to them could be a blend of financial and non-financial in nature.
4. Infuse in Corporate Culture: Ultimately a learning culture is a subset of your overall corporate culture. Accordingly, there needs to be adequate focus on building a corporate where team members feel comfortable asking questions, sharing ideas, and taking risks. Encourage collaboration and teamwork to foster a sense of community.
5. Measure Impact: leverage existing tools and systems to effectively measure the impact of adopting a learning culture using tracking key metrics such as employee engagement, retention, and productivity. Use this data to highlight progress, identify areas for improvement and adjust as needed.
Benefits of a Learning Culture
As a learning culture gets infused into your SalesGroup, here are some benefits you can expect to see:
• Improved employee morale and retention: When members of your SalesGroup feel that their organization is investing in them, they are more engaged and motivated. Such team members are more likely to stay with an organization that values their personal and professional growth.
• Increased efficiency and productivity: A learning culture can help employees develop new skills and knowledge, which can lead to increased efficiency and productivity. This is particularly important for organizations that work in a fast-changing industry like technology.
• Improved innovation and creativity: A learning culture encourages employees to take risks, learn from their mistakes, and share their knowledge with others, which can lead to improved innovation and creativity. Such innovative ideas can evolve to being key competitive advantages for the organization.

• Better adaptability to change: A learning culture emphasizes asking questions, observing, and continually acquiring new skills, which can help an organization adapt to change and anticipate disruption. During COVID, it was the organizations with a high learning culture that were able to adapt faster and evolve to new ways of working.
• Improved customer satisfaction: Employees who are well-trained and knowledgeable can provide better customer service, leading to higher customer satisfaction. Which from a sales perspective is a critical element.
A sales enablement function will significantly thrive more in an organization function that has prioritized learning as an integral part of its culture. The dividends pay off both in the short and long term.
Approach for Training Diagnostics
The approach for conducting the Training Diagnostics consists of two main assessment areas:
Training Relevance and Training Impact

Training Relevance: this refers the timeliness of the training initiative. The best learning initiatives are provided as close as possible to when the member of the SalesGroup will be able to apply the learning. This application is what causes the shift from training to learning and makes the new knowledge, skill or behaviour become part of them. Because it may not be practical for the learning initiative to happen just before the participants need it, this assessment areas also looks at how training collateral is made available to the SalesGroup so they can access what they need when they need it the most.
Training Impact: this refers to the overall effectiveness of a training initiative. It seeks to assess either the content or delivery method or both. For content it assesses how applicable the content is to what the members of the SalesGroup are looking to achieve. For delivery method, it measures how well the method leverages the different learning styles that people have so everyone is able to benefit from the training initiative, irrespective of their preferred learning style.
The findings from these two assessment areas provide a wholistic view of Training Diagnostics and will help you identify what is working well and the areas for further enhancement.
Conduct Training Relevance Diagnostics
The focus of this relevance diagnostic is to assess timeliness of the training initiative as a way to ensure the SalesGroup is being trained as close as possible to when they will be applying what they have learnt.
In conducting a relevance diagnostic of your training, the following steps will be taken:
1. Categorize Your Training Delivery Channels: there are broadly two categories of delivery channels for training initiatives. Live Sessions or On Demand. Some examples under each category include:
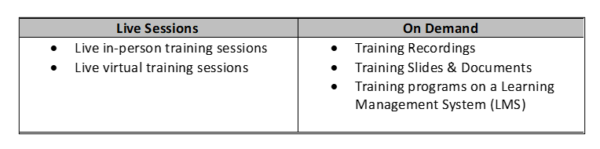
2. Determine the Time Horizon: determine the time horizon of when the training initiative was conducted or published, which you would like to use for the diagnostics. This helps you to focus on the more recent training materials and avoid errors due to obsolete materials. Some factors to consider in choosing the evaluation period include:
• Your Sales Cycle – the longer your sales cycle the longer the time horizon you would want to consider.
• Your Training Materials Production Rate – if you have a very productive training/learning team, then you would want to consider a shorter time horizon.
• Rate of Change in Markets – if you operate in markets that have a high rate of change, then you would want to consider a shorter time horizon.
• Ideal Time Horizon – from leading practices, the ideal time horizon is choosing training materials produced within the last 1 to 9 months.
3. Identify Feedback Sources: determine the sources you would be using to get feedback on the content quantity.
• For Live Sessions:
• By directly asking the SalesGroup if the timing of the recent training sessions were optimal or not.
• By observing the indirect feedback provided by the SalesGroup on timing of recent training sessions either.
• Indirect feedback could be from 1:1 one discussions or meetings with members/leaders of the SalesGroup.
• For On Demand:
• By directly asking the members of the SalesGroup how easy it is for them to find the training content they need when they need it.
• By observing the indirect feedback provided by the SalesGroup on the challenges they face in easily finding the content they need.
• Indirect feedback could be from 1:1 one discussions or meetings with members/leaders of the SalesGroup.
Exercise 5.2
Conduct Training Impact Diagnostics
The focus of this impact diagnostic is to assess how effective the training initiative is in helping the SalesGroup acquire the knowledge, skills, and behaviours that they need to help them better progress the prospect/customer along the buying journey.

In conducting an impact diagnostic of your training, the following steps will be taken:
1. Categorize Your Training Delivery Channels: refer to the details for this same section in Training Relevance Diagnostics.
2. Determine the Time Horizon: refer to the details for this same section in Training Relevance Diagnostics.
4. Identify Feedback Sources: determine the sources you would be using to get feedback on the training impact along the areas of the content and delivery method of the training:
a. For Training Content:
• By directly asking the SalesGroup if the content of the training initiatives aligned with what they believe they require.
• By observing the indirect feedback provided by the SalesGroup on impact of the content of training initiatives.
b. For Training Delivery:
• By directly asking the SalesGroup if the mode of delivering training interventions is the most impactful way from their perspective.
• By observing indirect feedback provided by the SalesGroup on the approach for delivering the training initiative.
Exercise 6.3

Course Manual 7: Technology Diagnostics
Introduction
The objective of this course is to assess at a wholistic level the effectiveness of the sales technology support available to your SalesGroup.
The overall aim is to use the Sales Technology Assessor to see how much of a strategic approach is being adopted in the purchase and use of sales technology within your organization and how this is providing a seamless experience to the members of your SalesGroup.
Exercise 7.1
“This shows how your satisfaction using technology is linked to the functionalities it has and how easily that technology links to other technologies you’re using in that area of need – in this case entertainment and for the SalesGroup – sales”.
‘Don’t bring a Knife to a Gunfight!’
The phrase ‘bringing a knife to a gunfight’ is claimed to have been first used in the 1987 ‘The Untouchables’. It is an idiom that means to be poorly prepared for a given situation or where someone is using outdated or ineffective methods to solve a problem. Highlighting that the person is at a disadvantage due to lack of resources.
It is a perfect way to describe a situation where a sales team is expected to compete in the current market terrain using outdated technology tools. The vast suite of technology tools has provided sales organizations with the opportunity to be more precise, analytical, and effective in how the different activities involved in sales are performed including marketing, business development, core sales and customer service.
As a leader within your SalesGroup, it important you appreciate the importance of providing members of your SalesGroup with the right technology tools to get the job done. Here are benefits of having the right technology tools:
1. Increased Productivity: When members of your SalesGroup have access to the right tools, they can complete their tasks more quickly and efficiently. It is a known fact that people spend a longer time on tasks when they are not using the right tools. For example, a person using a hammer to drive in a screw will take a longer time than a person using a screwdriver. There is also a possibility that the hammer may damage the screw in the process. The same is true for the tasks performed by the members of your SalesGroup. Ensuring they have the rights tools for their tasks will help ensure they are spending the least amount of time on tasks and freeing up time for them to get other tasks done. While also ensuring they do not ‘break’ anything. Ultimately, this will lead to increased productivity.
2. Improved Quality: In addition to increase in quantity of output, using the right tools can help your SalesGroup produce higher quality work. In marketing you can have higher quality Marketing Qualified Leads (MQLs). In business development you can have higher quality Sales Qualified Leads (SQLs). And in your sales organization overall, you can have higher quality conversion rates and retention rates. For example, having the right data enrichment tools in your marketing and business development efforts will help you identify prospects who are more likely to proceed along the buying journey for your products or services. This is done based on the assumption that the data profile of past customers is a reliable indicator of the profile of potential future customers. The data enrichment tools helping to provide these details on your prospect will help your SalesGroup produce higher quality work.
3. Reduced Errors: at the core of leveraging technology tools is a desire to eliminate or at least minimize errors, especially errors due to human interference. Considering the high pressure, high pace environment in sales, there is a generally high propensity for human errors. Enabling your team to use the right tools can help reduce errors and mistakes, which can save you and your organization time and money in the long run.
4. Improved Job Satisfaction: having the wrong tools to work with can be quite frustrating. Imagine trying to drink a bowl of soup with a fork! Providing the members of your SalesGroup with the right tools can help them feel valued and supported, which can lead to increased job satisfaction. Job satisfaction is a major precursor to employee retention. Investing in tools and technology that will drive job satisfaction are likely to save you from the cost that can be incurred when high-performing members of your SalesGroup leave due to frustration.
5. Increased Innovation: when your team members have the right tools to work with, they are able to complete tasks faster and this helps free up time for brainstorming creative and innovative ways of solving your business problems. Getting weighed down and frustrated with tools that do not help with the delivery of work negatively affect the parts of the brain responsible for creativity. This highlights that when team members are frustrated using the wrong tools, it not only affects the quality and quantity of their output but also hinders their ability to come up with new innovative ideas. Who knows, one of the ideas they generate might be the next big break for your business.
Overall, the leaders of your organization’s SalesGroup have a responsibility to ensure that team members having the right tools AND are effectively using them. The sales enablement function can greatly help in optimizing your technology stack, so you have a full ROI on the investments made.
As you work on providing the right tools for your team, it’s important you have a framework to know what you already have and what might be missing. This is what the Sales Technology Assessor will help you do.
The Sales Technology Assessor
The fast-paced advancement of technology in the last two decades has created an over-abundance of sales technology tools and platform options that sales team can use to support its sales operations. As is the case with the ‘Content Management’ course manual when we discussed ‘less is more’, it is possible for more tools to result in less effectiveness for the team. But with a wholistic strategic view, it is possible to develop a sales tech stack that effectively supports your sales targets and goals.
The Sales Technology Assessor (STA) was created to help you develop this strategic approach. The STA categorizes the different sale tech tools in a way that allows you to be clear on what categories you need and how your system is built to help you achieve this.
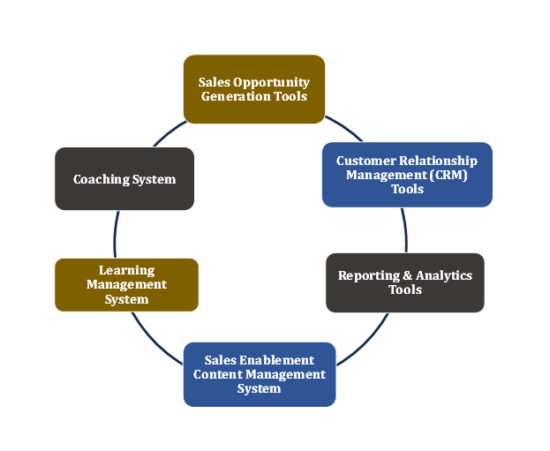
Digging deeper to what each of these means:
• Sales Opportunity Generation Tools – these include technologies and tools that support outbound & inbound marketing activities, tools that highlight prospect’s potential interests and track your top of funnel interactions with prospects.
Examples include LinkedIn Sales Navigator, Salesloft and Outreach.
• Customer Relationship Management (CRM) Tool – this is a platform used to create an integrated experience for managing all of your organization’s relationships and interactions with prospects and customers. Ultimately it aims to improve business relationships in order to improve business outcomes.
Examples include Salesforce Sales Cloud, Zoho, Apptivo.
• Reporting & Analytics Tools – this refers to a suite of tools designed to help you identify, collect, and analyze relevant data across your customer’s buying journey. This data can be reported on and used to generate insights that will guide improvement of different elements of the SalesGroup’s activities.
Examples include Clari, Outreach.

• Sales Enablement Content Management System: this refers to a technology designed to help your sales enablement function provide content to your SalesGroup in an organized, intuitive, and user-friendly way. While facilitating real-time feedback on your most effective content.
Examples include Seismic, Highspot.
• Learning Management System: this is a tool designed to develop, deliver, and track adoption of learning materials among the members of your SalesGroup. It is usually integrated with the Sales Enablement and Content Management System (mentioned above) because of the high degree of interaction between sales enablement and learning.
Examples include Continu, Lessonly.
• Coaching System: this refers to a suite of tools that are well integrated with other items in your tech stack especially the CRM and the Reports/Analytics tools. The Coaching System would typically leverage AI to identify potential coaching opportunities for an individual or team.
Examples include Gong, Chorus and Generative AI component of reporting/analytic tools.
Using this assessor to do a technology diagnostic, helps you to identify what is present or missing from your sales tech stack. It also helps to you to understand if the tools available have the functionalities that your SalesGroup needs and if the systems are effectively ‘talking to one another’ through integration. The case study below highlights the importance of these.
Case Study
In this video we will hear from Tiffani Bova on why having disparate technologies supporting your sales team is not a great way to drive efficiency and scale.
As you watch the video, try to note down your thoughts on the following questions:
• What statistic from the video resonated with you the most and why?
• How would you describe the level of integration of your sales tech stack.
• In your own view, who or what suffers the most from a lack of well integrated sales tech stack.
Integrating Your Sales Technology Stack – Video Link
Tiffani Bova is the Global Growth and Innovation Evangelist at Salesforce. She is passionate about ensuring an organization’s sales technologies are all talking to one another and creating maximum efficiency for sales teams.
Salesforce Inc. is an American cloud-based software company headquartered in San Francisco, California. It provides customer relationship management software and applications focused on sales, customer service, marketing automation, e-commerce, analytics, and application development. It had a total annual revenue of $26.24B in 2022 and $31.25B in 2023 representing an increase of 18.35%.
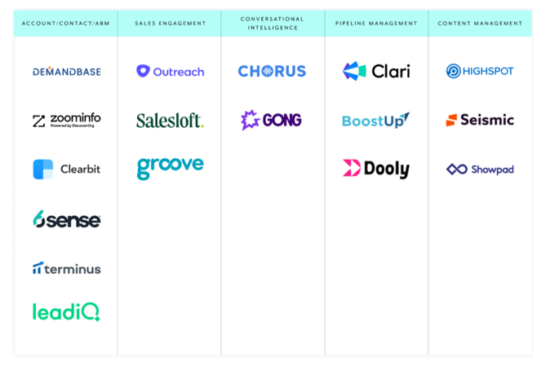
Square Peg in a Round Hole
Another key challenge that the plethora of tools now present to sales leaders is clarity on what is the best usage for each tool? Many of these technology tools are expanding their functionalities to support other sales related activities.
It is possible that an unaware sales organization may purchase a tool that claims to be able to deliver certain functionalities, but the tool is not the best fit for that organization. Resulting in a ‘square peg in a round hole’ scenario.
To help mitigate this, here a few things to consider:
1. Document Requirements – this is always the best place to spart. There needs to be a clear documentation of what the sales organization needs an ideal tool to do. This documentation should be independent of personal preferences or tools that team members may have used in the past. The requirements documentation needs to be agreed on by all stakeholders.
2. Define Evaluation Criteria – before reviewing options, it is advisable to align with key stakeholders on what the evaluation criteria will be. Ideally would include items like:
• Functional Specifications – ability of the tool to meet the functional requirements that have been documented.
• Integration Capability – ability of the tool to integrate with other technology tools you already have within your sales organization.
• Price & Terms – how the pricing compares to other competitors and how favourable or restrictive their terms and conditions are.
3. Evaluate the Options: this is where you assess the different technology tool options against your evaluation criteria and select the one that is most aligned to your criteria. It is advised that this is done a group of people (3 to 5 is ideal) so as to eliminate bias and have a more objective selection process.
4. Select and Implement: through the review process, a selection is made, and you would typically proceed to implement. If there is an existing system, implementation will need to be mindful of key challenges especially data conversion and preserving the records from the legacy system. Clear strategies for data conversion and legacy reporting need to be in place to ensure the implementation does not negatively impact business continuity.
5. Rollout & Manage Change: once implementation is complete, change management tactics need to be employed in rolling out the new technology/tool to drive adoption and minimize disruption to business.
Many technology tools will continue to make product enhancements, which result in changes in the tool. Ensuring your sales enablement function is effectively leveraging the support from the respective customer success teams for the technology tools is a way to ensure the team is effectively supported in using your technology tools.
Approach for Technology Diagnostics
In conducting the Technology Diagnostics, 3 main assessment areas will be considered: Completeness Check, Functionality Check, and Integration Check.
These assessment areas will be applied for all the dimensions of the Sales Technology Assessor described earlier.
• Completeness Check: this is focused on identifying which technology tools already present in your tech stack and which ones need to be included. This is the first level of assessment, and it focuses on whether you have the sales tool or not. It does not focus on whether the tool meets all the functional requirements (this is covered in a separate assessment area.
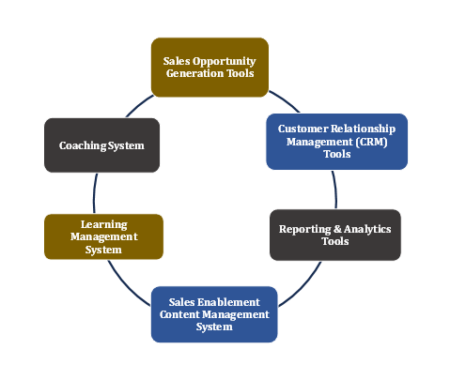
Exercise 7.2
• Functionality Check: this is focused on ensuring the technology tools you have meet the functional requirements needed for your SalesGroup to achieve their goals. This is the second level of assessment, and it is going beyond just having the tool to seeing if the tool has the functionalities that your team needs.
Exercise 7.3
• Integration Check: this is focused on reviewing how integrated your technology tools are to assess how seamless the workflow and dataflow is. The more seamless it is the more efficient your SalesGroup will function and the better their user experience will be (refer to the first exercise in this course on your entertainment devices).
Exercise 7.4
Course Manual 8: Value Diagnostics
Introduction
This course marks the beginning of enablement diagnostics that assess the sales pipeline. Ultimately, the impact of the sales enablement function on your SalesGroup needs to be seen in the state of your sales pipeline.
We will be running the diagnostics of your sales pipeline using the 5V Framework (Value, Volume, Velocity, Variety, Vitality). The first one, Value, refers to the financial amount associated with the opportunities in your pipeline.
The objective of this course is to assess the overall financial amount of your sales pipeline and to use this to establish a baseline. This baseline becomes the foundation for evaluating how enhancement of your sales enablement function will impact your sales pipeline over time.
While all the elements of the 5V Framework are critical, if we were to choose one which was the most important of the five, it would have to be Value. The reason is that ultimately the performance of a SalesGroup is measured by revenue. While the other elements of the framework – Volume, Velocity, Variety and Vitality – provide significant insights into the performance of the sales pipeline, at the end of the day, what really matters is if the SalesGroup was able to achieve its revenue (Value) targets or not.
An appreciation of how critical this element of the 5V Framework is, will help ensure that you get the most out of this course module.
Exercise 8.1
Top-Line before Bottom-line
One of the age-old debates in the business world is “Which is more important and why – ‘Top-line or Bottom-line?” Without a doubt both are two of the most important figures on a company’s income statement. But it is important to note that there cannot be a bottom-line if there is no top-line.
To explain this further, let us start by defining what top-line and bottom-line means and what growth in each of these areas looks like.
Top-Line and Top-Line Growth:
Top line refers to a company’s total revenue or gross sales generated within a given period. It is a crucial indicator for forecasting future profits and attracting investors, as it demonstrates a company’s ability to generate sales and overall market demand for its products or services.
Top-line growth, by extension, is the increase in income generated from sales or core business operations. If a company’s expenses remain constant, an increase in top line can lead to an increase in profit. As a result, businesses with strong top-line growth are often viewed as more financially stable and attractive to potential investors.
Bottom-Line & Bottom-Line Growth:
While the top line showcases a company’s revenue-generating prowess, the bottom line reveals its overall profitability and efficiency by representing the company’s net income or profit after deducting all expenses. Monitoring the bottom line is essential for businesses aiming to improve their financial performance and attract potential investors, as it provides a clear picture of the company’s earnings after accounting for all expenses. Analyzing the company’s income statement is a crucial step in this process.
Bottom-line growth, in turn, is the net income or net profit after considering all expenses, effectively illustrating a company’s profitability and operational efficiency. By analyzing and improving bottom-line growth, organizations can reduce superfluous expenses and enhance operational efficiency, resulting in increased net earnings and overall financial performance.
The illustration below shows how the key differences between the top-line and the bottom-line.
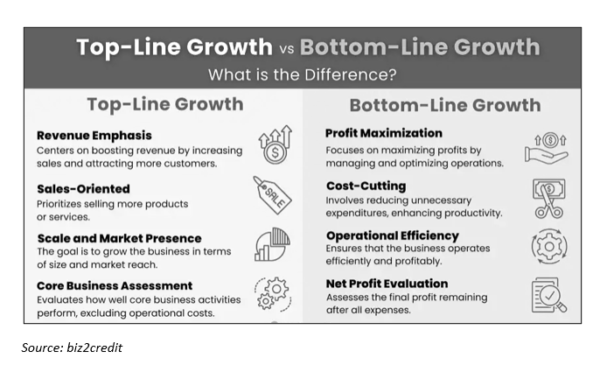
Which is More Important?
Knowing where to spend your energy can be tough when evaluating your company’s top-line and bottom-line. Do you focus on increasing sales and revenue, or do you focus on cutting costs so that you keep more of your income? The answer is it depends.
The top-line shows growth and how quickly the company is gaining its foothold in the market. Companies can use that number to forecast projections for their financial planning. Additionally, showing sales success can attract investors to help grow your business.
While some may argue that the top-line growth doesn’t give a complete picture of your company’s health. The reality is that increasing your top-line, is one strong way to ensure continued viability of the business to attract investors and more customers.
This importance of the top-line is why Value is a critical element in assessing the overall health of your sales pipeline.
Case Study
In this timeless video we will be watching Warren Buffet speak to business owners on How to Value a Business. He describes the different things to look out for in determining the value of a business.
Since this is not a business investment program but a sales enablement program, we will be applying the principles he shares to what you should be looking at when you’re determining the value of your sales pipeline.
As you watch the video, try to note down your thoughts on the following questions:
1. If the basketball coach is mainly considering people who are 6 ft 10 or taller for the team, what should a sales leader mainly consider when it comes to the value of the sales pipeline?
How to Value a Business – Warren Buffet (Video Link)
Warren Buffett is an American business magnate, investor, and philanthropist. He is currently the chairman and CEO of Berkshire Hathaway. As a result of his immense investment success, Warren is one of the best-known fundamental investors in the world. As of October 2023, he possessed a net worth of $117 billion making him the seventh-richest person in the world.
How to Grow the Value of Your Sales Pipeline
The number one priority of any sales organization is to drive value which results in the achievement of financial targets. To do this effectively, various organizational factors come into play.
While there is a direct correlation between the number of sales qualified opportunities (volume) and the financial amount (value), having more volume does not always result in more value especially if there are more fundamental issues. This is why the 5V framework starts with Value first before transitioning to Volume (Volume will be discussed in more detail in the next course manual).
To grow the Value of your sales pipeline, here are 4 key elements to consider:
1. Unique Value Proposition – it is important to have absolute clarity on the problem(s) that your product or service is addressing. Highlighting how this differs from what competitors may be providing. An inability to effectively articulate the value of the product or service, ultimately impacts the Value of the pipeline. To put it in a different way, the size of your pipeline is a direct indicator of how much your market values the product or service you are providing.
To further define or refine your UVP, there are several strategic questions you should answer. These are summarized in these groups below:
• Identify your target market: Who are the people who need or want your product or service? What are their pain points, goals, and preferences? You can use market research, customer feedback, surveys, interviews, etc. to understand your potential customers better (more on this in the next section).
• Establish the benefits of your product or service: How does your product or service solve your customers’ problems or improve their situation? What value do you offer to them? You can list the features and benefits of your product or service and prioritize the most important ones.
• Evaluate the Impact: How can you quantify or demonstrate the value of your product or service? You can use numbers, statistics, testimonials, case studies, etc. to show the impact of your product or service on your customers’ lives.
• Differentiate yourself from your competitors: Why should your customers choose you over your competitors? What makes your product or service unique or superior? You can analyze your competitors’ strengths and weaknesses and highlight your competitive advantage or unique selling point.
• Craft your UVP statement: With all the answers you’ve gathered so far. Now it’s time to craft/refine your UVP statement. How can you summarize your UVP in a clear, concise, and compelling way? You can use a simple formula such as:
[Product or service name] helps [target market] [benefit] by [differentiation]. You can also use a catchy slogan, headline, or tagline to capture your UVP.

Here are a few examples of UVP statements from different businesses:
• Mayo Clinic: to inspire hope and contribute to health and well-being by providing the best care to every patient through integrated clinical practice, education, and research.
• Slack: Slack is the collaboration hub that brings the right people, information, and tools together to get work done.
• Johnson & Johnson: to provide quality and reliable healthcare, well-being and pharmaceutical products to consumers and medical sector organisations worldwide.
• Netflix: Watch TV shows and movies anytime, anywhere.
• HSBC: We create value for our customers and investors by always moving forward and making things happen.
2. Market Segmentation & Targeting – one of the key steps in increasing the Value of your pipeline is segmenting the market to effectively identify which segments are most suited for your products and services. This segmentation then helps you channel your marketing and business development activities towards those segments in a targeted and concerted manner.
To conduct an effective market segmentation and targeting, here are some points to consider:
• Segmentation: This is the process of dividing your market into smaller, homogeneous groups based on various criteria. The goal is to identify groups of customers who have similar needs, wants, or characteristics that make them respond similarly to your marketing and business development efforts. To conduct segmentation of your market, here are some criteria you can consider demographics, psychographics, geographic, and behavioral factors.

• Targeting: This is the process of evaluating and selecting the most attractive and profitable segments to focus your marketing and business development efforts on. To assess the attractiveness of each of your market segments, here are some criteria that you can use size, growth, profitability, competition, and alignment with your objectives and resources.
• Positioning: This is the process of creating a distinctive image and value proposition for your product or service in the minds of your target customers. The objective is to use an optimum blend of marketing and business development tactics to attract, retain and convert this market into paying customers. Some of the tactics you could consider include product feature/benefit highlights, pricing strategy & packaging, distribution, and promotion, social media campaigns, corporate events etc. These are to be combined with a goal to communicate how your offering is different from and superior to your competitors’.
3. Sales Process & Conversion Rates – in some cases, you have done a good job of defining your UVP, you have done a great job of targeting the right market segments, however, you are just not seeing the right levels of conversion. High number of sales qualified leads without commensurate increase in pipeline value is characteristic of low conversion rates and is a strong indicator of an ineffective sales process. Simply defined, a Sales Process is a set of important steps that your SalesGroup can follow to complete a sales cycle and win the opportunity.
To improve the sales process, here are some steps to consider:
• Assess Current State: Identify the steps involved in your current sales process, such as lead generation, qualification, presentation, negotiation, and closing. Document the time, effort, and resources required for each step, and identify any bottlenecks or inefficiencies that need to be addressed.
• Define Goals & Metrics: Establish clear and measurable sales goals, such as revenue, profit, market share, and customer retention. Define the key performance indicators (KPIs) that you will use to track your progress towards these goals, such as conversion rates, win/loss ratios, average deal size, pricing, and sales cycle length. The KPIs will help keep the momentum going all through the sales process and help ensure the sales goals are eventually achieved.
• Streamline & Automate: based on the goals and metrics defined, identify what needs to change to better streamline the sales process. Once the process is streamlined, identify how technology can automate some of these. Automation saves you time, reduces errors, and improves your data accuracy and consistency – which are key pillars of accurate sales planning and forecasting.
• Train & Enable SalesGroup: once the new process is complete, focus on training and enabling the different teams within your SalesGroup. This ensures that everyone is aligned and pulling towards the same direction – increasing the value of the pipeline.
4. SalesGroup Capacity & Capability: – in a situation where the 3 elements mentioned above still do not help drive the desired Value in pipeline. Then the 4th likely element to consider is the capacity and competency of the SalesGroup. Capacity refers to the number of the SalesGroup while Capability to the full complement skills and abilities the SalesGroup needs to have to deliver on the Value goals.
The steps to be considered for this have already been covered under the Team Diagnostics and Productivity Diagnostics modules of this Workshop.
Exercise 8.2

Approach for Value Diagnostics
The 5V Framework details the approach being adopted for all the sales enablement diagnostic activities that have to do with sales pipeline. The 5V Framework consists of Value, Volume, Velocity, Variety & Vitality.
The illustration below, highlights how Value is situated within the 5V Framework:
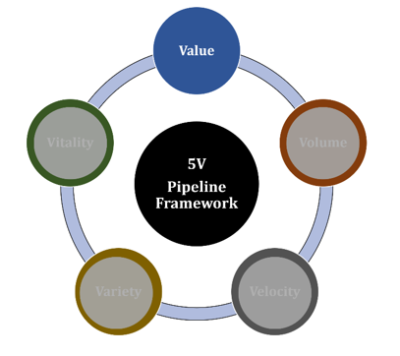
As defined earlier, Value refers to the financial amount of the opportunities in your pipeline. This helps to give a clear picture of actual and forecasted sales revenue.
Depending on the maturity of your sales processes and the clarity around your forecasting method, determining the total pipeline value should not be a very complicated process. The objective is to have a clear basis for evaluating the impact that future sales enablement initiatives have on the Value of your pipeline.
With this background, a critical success factor of this evaluation is not so much the actual value you arrive at the end of the exercise, but it is to ensure a consistency of approach. This means the approach used to determine this financial amount needs to be the same approach consistently applied going forward. This allows for an easy way to assess the impact of sales enablement initiatives by keeping other variables constant, as much as possible.
Actual vs Forecast
The time horizon for conducting the Value Diagnostics for your sales pipeline is 12 months. In determining the specific 12month period to use, you would need to consider which of the following options would serve as the most suitable foundation for evaluating the impact of future sales enablement initiatives.
A. Closed Won, YTD,
B. Closed Won, over the last 12 months
C. Closed Won, YTD + Forecasted till EOY

Here are a few factors to consider in selecting an option that works best for your organization:
1. Financial Year: consider how far gone you are in the current financial year. If you have completed 75% or more of the current financial year, you may want to consider either Option A or Option C because of the YTD component.
2. Strategic Direction: consider if your strategic direction in the current year is significantly different from the previous year(s). This change in direction would likely have a significant impact on your sales pipeline. As such you want to consider Option A or C as this is likely to contain more recent data indicating how the change in strategic direction is impacting your sales.
3. Market Predictability: consider the level of predictability of the markets you sell to. If the level of predictability is not so high, you may want to consider Option B which focuses on the actual deals that have been won as against what is forecasted which may not be realized due to the unpredictability of the market.
4. Sales Process Maturity: consider the current maturity level of your sales process especially your forecasting methodologies. The more mature these are, the more reliable your forecasting values will be. However, if these are not as mature, you may want to consider Option B which focuses on actual closed deal amounts.
Exercise 8.3
Course Manual 9: Volume Diagnostics
Introduction
This course is a continuation of the enablement diagnostic areas that are focused on assessing the sales pipeline. This assessment is critical because ultimately, the impact of the sales enablement function on your SalesGroup needs to be seen in the state of your sales pipeline.
Continuing with the 5V Framework (Value, Volume, Velocity, Variety, Vitality). This second one, Volume, refers to the total number of opportunities in the pipeline as certain stages in the sales cycle. It helps to give a sense of how strong the pipeline and how likely the SalesGroup is to achieve their targets based on established conversion rates.
The objective of this course is to assess the total number of opportunities at these defined stages in the sales cycle and to use this to establish a baseline. This baseline becomes the foundation for evaluating how enhancement of your sales enablement function will impact your sales pipeline over time.
Exercise 9.1
Sales: A Game of Numbers
This is one of the age-old debates within the sales world. A school of thought that opposes this statement suggests that those who support this statement are simply resigning the fate of their sales success to luck.
These opponents imply that “If you still believe that selling is a numbers game, then you are saying that you lack the skills to control the outcome” (Liz Wendling, Sales Gravy). The thinking is that sales has evolved from a ‘numbers game’ to a ‘performance game’. Where it is no longer just about working hard but working smart.
While there is merit to this line of reasoning, the question that begs answering is “After you have started working smartly, do you need higher numbers to have higher sales results?” The obvious answer to this question is ‘Yes!’.
The illustration below shows the conversion rates from one stage in the sales cycle to another. It shows how many items in one stage get converted or move into the next stage. For example, because web visits have a conversion rate of 3%, it means for every 100 persons that visit the website, only 3 of them become a lead.
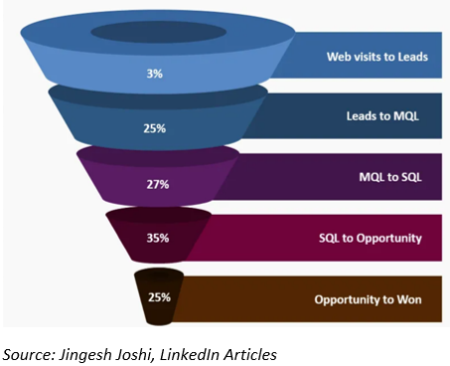
This concept of conversion rates highlights why sales is still a game of numbers. While it is expected that the sales leadership will continue to improve efficiencies to increase conversion rates, but the emphasis on conversion rates cannot be without the equal or in some cases, higher emphasis on the numbers.
Accordingly, to experience significant and sustained growth in sales, the emphasis on measuring the number of opportunities/deals in the pipeline is still a critical part of driving sales performance. This is what makes this Volume Diagnostics critical for assessing overall sales pipeline performance. Because even if you were to analyze from a purely probability point of view, having more opportunities increases your chances of closing some.
Now that we are aligned that sales is still a game of numbers, let us discuss how to win this game.
Winning the Numbers Game in Sales
To understand how to win the Numbers Game in sales, it is good to first unpack that phrase ‘Numbers Game’.
The ‘Numbers’ element highlights the importance of understanding that selling has a very mathematical dimension. This means that the very core elements of sales can be calculated and divided into percentages, ratios, wins, losses, and everything in between. For more advanced sales organizations, it is very possible to derive a mathematical formula of things that need to happen at earlier stages of the sales process to achieve a desired sales figure at the end of the period. For example, in a sales organization where the conversion rate between mid stage and close is 50%, to achieve a sales target of 100 won deals, the sales team would need to have 200 deals in the mid stage. If the in the same sales organization, the conversion from early stage to mid-stage is 20%, this means that they will 1000 opportunities in the early stage. Accordingly, success is very predictable – barring any unforeseen unusual circumstances.
The ‘Game’ element highlights the fact that, like every other game, there are rules to follow. These rules help to inform what is important and what is not important in playing the game. For example, in a soccer game, numbers like possession % and number of passes, do not really matter and a team with high possession and passes, may not necessarily win the game. It’s the scores on the scoreboard that matters.
In the same way, in sales, not all numbers are of the same importance. Understanding what numbers to focus on in the ‘sales game’ is what separate the good sales teams from the great ones. The vast majority of sales teams focus on numbers such as how many appointments have been made, how many presentations have been given, and how many leads have been called. While these numbers are indicative of positive moments, they don’t equate to sales. They show possession, but the scoreboard doesn’t care.
In order to win the game of numbers in sales, focus on the numbers that will help you win the game. You achieve this by analyzing your current process and take inventory of your strengths and weaknesses. By doing so, you can make the minor adjustments necessary to come out in the ‘second half of the game’ and take back control of the game.
Here are activities you can consider in winning the Sales Numbers Game:
1. Set Goals: every game has a scoring system – things that you do to get scores and potentially win the game. Same with sales, there is a need to set goals for each member and team within your SalesGroup. These goals need to be clearly linked to the ultimate goal of achieving sales targets. As a general rule, ensure that those goals are SMART –
• Specific – goals need to be clear, easily understood in a sentence or two at the most.
• Measurable – ensure the measurable with clear quantifiable metrics. If qualitative metrics are required, ensure clear description of the different quality levels.
• Achievable – this helps to ensure there’s a healthy tension between what can be realistically achieved and what is a stretch goal.
• Relevant – this is where you separate the numbers that don’t get you on the scoreboard, from the ones that do. Ensuring each member of the SalesGroup has goals linked to their core role and linked to the ultimate goal of winning more deals.
• Time Bound – every game has a time limit, same with the game of sales. This helps create a sense of urgency, not emergency, but urgency – which is a main characteristic of highly successful sales organizations.
2. Track Your Progress: Setting up processes and systems to track progression towards your goals is how you know if all the efforts of the SalesGroup are leading towards the goals or not. Here are some things to consider when you want to track progress against your sales goals:
• Determine Units of Measurement – work with other SalesGroup leaders to align on what you will be measuring. The 5V Framework in this course manual is a good foundation to build on.
• Define Points of Measurement – identify the points in your sales process where you will be measuring the different units of measurements that have been determined. Some units of measurements may be measured at different points along the sales process, so this step helps you define how many points are required for each unit of measurement.
• Identify Tools of Measurement: determine how the units of measurement will be quantified in an effective and objective manner. This could be a combination of manual and automated ways to measure the progress towards your defined sales goals.
• Define Standards & Expectations: the last thing to consider is to define what ‘good looks like’. This helps to set a baseline on which the performance of things measured can be compared. For some of the units of measurement, this baseline may be based on industry standards, in other cases, it can be based on what the SalesGroup leadership expects to happen in line with other strategic goals/aspirations.
3. Embrace Continuous Improvement: this produces a mindset that is committed to ensuring that you learn from past results to generate better future results. For this to be effective it is important to determine what is going well with regards to achieving your sales goals and what needs to be improved. The steps below provide guidance on how to do that:
• Compare: do a comparison between the actual measurements to defined standards and expectations. To highlight where progress meets or exceeds expectations and where it is below expectations.

• Align: for the areas where the actual is lower than expectations, work with other members of the SalesGroup to determine what tactical changes are required. It is important this is done in a collaborative approach as there are usually many teams involved in resolving the issues that are identified along the way.
• Implement: execute those tactical changes and observe how they may have impacted your results during the next cycle for measuring & reporting.
4. Stay Organized: most sales organizations are usually high in activity due to the strong bias and desire to see results. This may make it challenging to stay organized. This is the leaders of your SalesGroup have a responsibility to keep things organized as this helps to drive efficiency and effectiveness. Some steps to adopt in staying organized include:
• Role Clarity: ensure every member of the team is clear on the roles of other team members. Beyond what the traditional roles mean in the industry, it is important for the team to be fully aware on what those roles do within your SalesGroup. This clarity helps everyone to know what they are responsible for and who they need to reach out to in performing their duties.
• Action Oriented Meetings: another key element in staying organized is ensuring that meetings and discussions end with clarity on who is responsible for executing what. Many times, in organizations, leaders and team members come together and have very fruitful discussions and come up with fantastic solutions for pressing business needs. However, where many of these meetings fall short is in the execution of these solutions. To avoid this pitfall, ensure you end your sales meetings with a detailed list of action items and people responsible for executing those action items. In some cases, it may be a team that is responsible for executing, in such cases avoid putting the name of the team, instead put the name of the head of the team. This allows for single point of responsibility and ownership. This action items and owner list also becomes the point of starting during the next meeting to see how much of the action items has been implemented. This is especially important in a sales organization where everything can feel a bit fluid sometimes.
5. Be persistent: Sales is a tough game because it has both elements of a sprint and a marathon. Sales can sometimes feel like a sprint when the team is approaching the end of the month, the end of the quarter or the end of the year and the results are not as expected. At such times, there is an increased intensity to close deals and every day can sometimes feel like a ‘mad rush’. Other times, sales can feel like a marathon, for example, when some prospects are taking a longer than the usual sales cycle to become paying customers. This is even more discouraging when you’re at the commercials and contracting stage and there is significant back and forth between the commercial and legal teams on both sides. This tension between the sprint and marathon mode can affect motivation and morale. This is where the leaders of a SalesGroup need to support the SalesGroup by being persistent and morale high. To win the game of numbers in sales, persistence is key!
Case Study
Listen to Jim Rohn share some timeless truths on how understanding and applying the Law of Averages can have significant impact on how you look at the volume of your sales pipeline and how this impacts the overall performance of your SalesGroup.
As you listen, consider your responses to the following questions:
What did Jim say was a good way to compensate for a lack in skill?
How can you apply the Law of Averages to your sales pipeline? (either as it relates to volume or conversion ratios?)
Sales & the Law of Averages – Video Link
Jim Rohn was an American entrepreneur, author and motivational speaker. He was involved in various sales organizations, working for different companies before starting his own direct sales company. Jim Rohn International, which sold personal development and motivational products. Jim Rohn was also a pioneer in the network marketing industry. He founded a successful network marketing company, Herbalife, in the early 1980s. He authored 17 books/audio materials and many of his teaching/speeches are available free on YouTube and are work listening to, many times. As at the time of his death in 2009, is his net worth was about $500m.
Approach for Volume Diagnostics
The 5V Framework details the approach being adopted for all the sales enablement diagnostic activities that have to do with sales pipeline. The 5V Framework consists of Value, Volume, Velocity, Variety & Vitality.
The illustration below, highlights how Volume is situated within the 5V Framework:
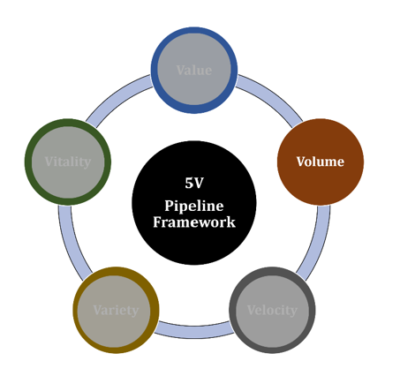
Volume, as defined earlier, refers to the total number of opportunities in the pipeline as certain stages in the sales cycle. It helps to give a sense of how strong the pipeline and how likely the SalesGroup is to achieve their targets based on established conversion rates.
The approach adopted to determine the volume of your sales pipeline would largely depend on the nomenclature of your sales stages and what point in the sales stage may be considered as a ‘midpoint’. The aim is to have a clear and consistent approach for identifying this midpoint so that the number of opportunities that are Closed Won.
While the naming of the sales stages may differ from organization to organization, here are some principles to guide the distinction between sales stages:
1. Leads: this refers to prospects who have shown some interest in knowing more about your products/services with a view to seeing if there’s a potential fit between what your organization is offering and their current needs.
2. Qualified Leads: this refers to prospects who have engaged with some of your organization’s marketing/sales collateral and based on feedback you have obtained from interacting with them, you are able to use some pre-defined criteria to qualify them. The whole concept of qualifying is to indicate these are more likely to be Closed Won deals. Some more common nomenclature for this includes Marketing Qualified Leads (MQL), Sales Qualified Leads (SQL) and Sales Qualified Opportunity (SQO).
3. Closed Won: this refers to opportunities that have been won i.e., the deal is closed, and the prospect has agreed to become a customer.
Midpoint & Endpoint:
For the purpose of doing the Volume Diagnostics, you would need to determine what is your midpoint and your endpoint.
For the Midpoint you can consider using whichever of your sales stages you believe is the best representation of a ‘Qualified Lead’ as defined in the section above.
For the Endpoint, you will need to consider the number of Closed Won deals for the chosen point in time.
Determining the Point in Time:
The point in time for conducting the Volume Diagnostics for your sales pipeline should be at the point where you have significant amount of data for the current financial year. Accordingly, this should be at your end of year or as close as possible to the year end.
If you are in Q4 of the current financial year, then you can consider using the Midpoint and Endpoint data for that current financial year.
If you are not yet in Q4, you can consider using the Midpoint and Endpoint data for the previous financial year.
Consistency is Crucial
An element of this diagnostic that is critical to its overall success is ensuring that whatever is selected for the “Midpoint and ‘Point in Time’ become what is used for future evaluations as well.
Exercise 9.2
Course Manual 10 – Velocity Diagnostics
Introduction
In this course, we will continue with the enablement diagnostic areas that are focussed on assessing the sales pipeline. As mentioned earlier, the ultimate test of how impactful your sales enablement function is will be seen in its impact on your sales pipeline performance.
The 5V Framework provides a simple yet comprehensive way to ensure all key elements of your sales pipeline are assessed as part of the Enablement Diagnostics. This Framework consists of Value, Volume, Velocity, Variety, Vitality.
The third element, Velocity, refers to the speed at which opportunities are progressing through the sales stages as these cumulatively result in the sales cycle for the opportunities. Recognizing that this will be different for each individual opportunity, the approach will be to find the average velocity across all opportunities.
The aim of this course is to provide a structured and consistent way for you to assess how quickly opportunities are progressing through the sales stages in your sales process This will help you determine the average velocity across each sales stage to establish a baseline. This baseline becomes the foundation for evaluating how enhancement of your sales enablement function will impact your sales pipeline over time.
Exercise 10.1
The Need for Speed
Any sales organization that is in business to business or enterprise selling and doesn’t feel a need for speed, needs to pause and ask themselves some critical questions. The reason for this is when something is done faster, it is more likely to deliver value faster to your customers. Delivering value faster to your customers in-turn means faster returns for you.
Speed is a crucial factor in sales. According to a 2021 article in Forbes, speed is the most important thing for a business’s profitability. The article explains that speed is easy to track and quantify, and it can be used as a differentiating factor in the business world.
Here are some main reasons why speed is needed in today’s business world:
1. Customers Expect Speed: Customers expect speed, and they have every right. We live in an era of instant gratification. We expect our YouTube videos to load in less than one second. We pay an extra fee so our packages from Amazon will arrive the next day — and sometimes, even the same day that we place our order. When so many things in life are readily available, it can sometimes be hard to bring prospects/customers back down to earth when it comes to understanding how long it takes to provide your services. But while you may not always be able to provide “instant” results, you still need to account for what today’s customers expect.
2. Competitive Advantage: now more than ever, speed is becoming a competitive advantage for your business. While elements such as quality of product/service, price and other terms are important, in a world where it is becoming increasingly more difficult to differentiate based on these factors, speed becomes the main differentiator.
3. Accelerated Learning: getting your team to execute on strategies and tactics faster accelerates the learning of your organization. One of the reasons many organizations take their time is a desire to ‘get things right’. While quality is not to be undermined, recognizing that it is almost impossible to always ‘get things right’ gives you and your organization the permission to proceed with what is known so the team can implement, learn, and apply the learnings for the future.
4. Better Decisions: as your organization commits to doing things faster and accelerating learning, the cumulative effect of this is an ability for you and your organization to make better decisions. As decisions are largely based on availability of data and past experiences, accelerating learning provides you with more data and experiences which facilitate the making of higher quality decisions.
Caution on Speed!
Generally, there does not seem to be any main disadvantage with emphasizing speed within your SalesGroup. However, it is important to highlight two main areas of caution:
• Quality: the drive for speed should not be at the detriment of quality. Every organization will need to continue to experiment until they are able to find that healthy balance between quality and speed. This is the sweet spot where significant sales success happens.
• ‘Rush’ Culture: it is quite common for sales organizations to over-emphasize speed and create a ‘rush’ culture. A ‘rush’ culture is where everybody feels everything needs to be done now and people lose sight of what needs to be prioritized for speed and what is okay to happen at ‘normal’ pace. If everything is made to sound urgent then nothing is urgent. A ‘rush’ culture also results in burnout for your team which is not sustainable in the long run. The key is to ensure ‘speed’ is emphasized for the key activities that will drive sales and not a ‘rush’ culture for every single activity.
Case Study
In this video, you’ll hear Mary Barra, the chair, and CEO of General Motors, share her thoughts on how lack of speed can affect decision making and overall business performance.
As you listen consider your responses to the following questions:
1. When was the last time you or another leader within your SalesGroup made a decision by not making a decision?
2. How much data do you think is enough data for you to proceed with making a decision? (50%, 70% or 90%?).
Speed & Business Performance – Video Link
Mary Teresa Barra is an American businesswoman who has been the chair and chief executive officer (CEO) of General Motors since January 15, 2014.She is the first female CEO of a ‘Big Three’ automaker company in North America. Her desire for speed is seen in her drive for moving GM into the innovation space. She directed GM’s move into driverless and electric-powered cars through acquisitions including Strobe, a startup in driverless technology. She has often stated that GM has a clear priority to “accelerate our EV plans” and to solely offer EVs by 2035.
How to Increase Sales Speed:
Because closing a sale is as a result of a combination of activities culminating in the sale, there are many different things to consider while thinking of how to increase speed in sales.
Detailed below are some tactics to consider if you are looking to increase the speed of your sales. They have been arranged in a somewhat chronological order based on a typical sales cycle. This should hopefully help you easily identify where changes may be required for your sales organization.
Here are the tactics:
1. Automate Repetitive Tasks: Automating repetitive tasks such as data entry, lead generation, and follow-up emails can help you save time and focus on more important tasks. Since speed is a function of time automation frees up available time and allows the members of your SalesGroup focus on the more critical items that will move the deal forward.
2. Clarity the Objective of Every Sales Activity: Setting clear goals for what each sales activity is meant to accomplish is a great way to ensure that tasks are followed through until the desired results are achieved. This helps to prevent unnecessary repetition of tasks, thus freeing up time for the SalesGroup to proceed with other sales activities required to move the opportunity forward.

3. Enable Team on Objection Handling: one of the major things that slow down sales is when the prospect raises an objection that the team was not anticipating or were not prepared for. To mitigate this, it’s important that the SalesGroup proactively anticipate and craft responses to potential objections that the prospect may have. The first step in this is to source actual and potential objections that prospects may have. The next step is to then skillfully craft responses to these objections that address the prospects concerns but still ensure the sale is moving forward. The final step is to then enable the SalesGroup on how to effective use these responses in dealing with objections. This enablement will be a blend of training, role play and technology support through AI.
4. Clarity on Pricing Process: another major deterrent in sales is pricing. So, ensuring that conversations with pricing happen early in the conversation will be helpful to prevent your SalesGroup spending time on prospects who may not be a good fit for your product or service. Depending on what you offer, the pricing process may be very simple or complex. For example, if your product or service is already pre-packaged, off-the shelf, the pricing is more straightforward and the only areas for flexibility could be around quantity discounts or payment terms. However, if your product or service is more agile and the price to be paid depends on what the customer needs, your pricing process will be slightly more complicated and your SalesGroup will require more support in terms of enablement, so they are able to navigate pricing discussions more effectively and speedily.
5. Simplify Contracting Process: this is another sticky point when trying to accelerate sales. In some organizations, contracting alone takes 20 to 30% of the entire sales cycle. When a prospect has already made a decision to buy, ensuring things don’t get delayed during contracting is critical for sales speed. What can be helpful is to ensure that the discussions on contracting happen as early as possible – even before the prospect has made the final decision to buy. Initiating some level of discussion around the contracting process you’re your prospect somewhere during the mid-stage of your sales cycle can help has been shown to reduce the time it takes for contracting to be completed. That said, the nature of your product or service will impact how simple or complex your contracting process will be. Embracing the mindset of continuous improvement, it is good to keep exploring how your contracting process can be further simplified. Here are 3 things that can always be improved upon (you can call them the 3 L’s):
• Language: ensure the contracts do not contain difficult to understand and unnecessary legal jargons. Simple, clear but firm language will help reduce ambiguity and prevent things spiralling down a legal tussle.
• Length: review and see where there is unnecessary duplication of clauses. While there are times when this may be required, working with your legal team to explore how to reduce this is also helpful.
• Liability: the terms and conditions and what each party is liable for is usually the most contested parts of contracts. As such, clarifying liability and adopting a win/win approach will help simplify the contracting process overall and ultimately accelerate your sales process.
6. Improve Effectiveness of Meetings: there are mainly two types of meetings that salespeople engage in – internal and external meetings. Both are valuable and it is difficult to place one as being more important than the other.
• Improving External Meetings: salespeople mostly have external meetings with prospects and partners and the main time waster is scheduling – finding a time that works for all parties to meet. To reduce/eliminate the back and forth involved in scheduling a meeting, this waste of time can be avoided by leveraging technology such as Calendly which help prospects find a time that works on the calendar of your SalesGroup without seeing their entire calendar.
• Improving Internal Meetings: salespeople mostly have internal meetings related to training, enablement, operations, reporting, or career. All of these types of meetings are critical and should not be ignored. However, being mindful about their duration and frequency in a way that they still provide your SalesGroup with enough time for direct sales activities is important.
Overall, whether it is an external or internal meeting there are some principles that guide effective meetings. These principles can be summarised in these Objective, Order, Overview, Outcome and Ownership. (These will be discussed during the Meetings Framework Module of this Sales Enablement Program).
7. Strengthen Your Sales Operations: sales operations as a function, consists mainly of processes and technology support. An approach of consistently reviewing these two elements with an objective to making things faster and more effective, will yield dividends of accelerating your sales speed. Some of the activities you can consider here include:
• Regular clean up of CRM and other data to ensure team is clogged with unnecessary data.
• Simplifying processes and ensure members of the SalesGroup are well enabled on the key business processes. Especially the ones that have to do with other teams outside of their immediate teams.
• Continue to leverage technology and see how machine learning and AI can increase the speed and effectiveness of your sales team.
Approach for Velocity Diagnostics
The approach we will be adopting for measuring the velocity of your sales pipeline will be different from what you may have come across, when it comes to measuring sales velocity.
The typical formula for sales velocity is illustrated below:
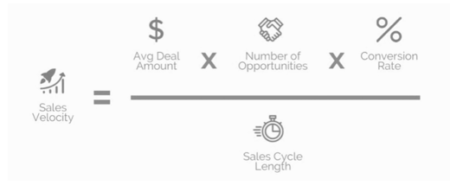
While this formula is widely used and is helpful for evaluating sales velocity, we will be adopting a different and simplified approach in this Program, for measuring sales speed.
The main reason for this different approach is that the other elements in the formula above, have been accounted for in other parts of the 5V Framework which consists of Value, Volume, Velocity, Variety & Vitality.
The illustration below, highlights how Velocity is situated within the 5V Framework:
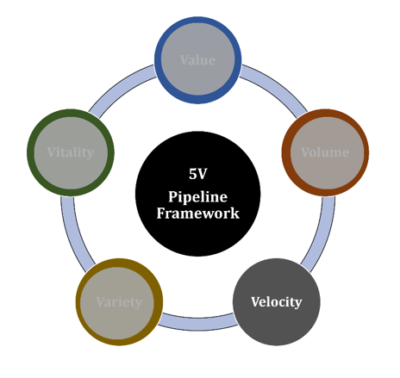
Velocity, for this program refers to how quickly opportunities are progressing through the sales stages as these cumulatively result in the sales cycle for the opportunities. Recognizing that this will be different for each individual opportunity, the approach will be to find the average velocity for the opportunities.
The approach we will be using to determine the average velocity of your deals will be based on three principles:
1. Sales Stage Definition: this refers to how well you have distinctly defined your sales stages. As discussed during the previous course module on Volume, the nomenclature of your stages may differ from that of other organizations based on certain uniqueness of your business and the products/services that you offer.
However, to determine the average velocity for your sales pipeline, you will need to determine 3 key points in your sales cycle:
• Starting Point: identifying which point in your sales pipeline you will consider to be the starting point of your ‘top of funnel’. For your sales organization, this starting point could be the point where ‘leads’, prospects who have shown some interest in knowing more about your product/services, are identified.
• Midpoint: you will also need to determine what is the midpoint in your sales pipeline. This would typically be for prospects who have interacted with some of your marketing/sales content and have progressed along your sales stages based on some pre-defined criteria. This could your Sales Qualified Lead (SQL) or Sales Qualified Opportunity (SQO).
• Endpoint: the final point in your sales cycle that needs to be determined is the Endpoint. This would typically be the point where the deal is closed won.
2. Unit of Measurement: this refers to the unit of measurement to be used in measuring how long an opportunity stays within each stage. The option you choose will on the overall length of your sales cycle The usual options are:
• Days,
• Weeks, or
• Months
3. Time Horizon: this refers to the review period you want to consider. While this would also depend on the overall length of your sales cycle, some options you could consider are:
• 6 months
• 12 months, or
• 24 months.
Remember Consistency!
An element of this diagnostic that is critical to its overall success is ensuring that whatever is selected for these principles listed above, become what is used for future evaluations as well.
Exercise 10.2
Course Manual 11: Variety Diagnostics
Introduction
Progressing along through the enablement diagnostic areas that are focused on assessing sales pipeline, in this course we will be assessing the Variety of sales pipeline. Variety is the fourth ‘V’ in the 5V Framework. The reason why we are focusing this extensively on the sales pipeline is because a firm belief of this program is that the ultimate value a sales enablement function is looking to add to your sales organization is by helping you close more deals more quickly.
The 5V Framework is a simplified, but comprehensive way to evaluate all key elements of your sales pipeline as part of the overall Enablement Diagnostics. This provides a baseline for assessing the continued impact of your sales enablement function as we continue in the program. The 5 V Framework consists of Value, Volume, Velocity, Variety & Vitality.
Variety refers to the mix or diversity in your pipeline, diversity is usually in terms of market segments or customer types. Its aim is to help you gain a deeper understanding of which market segments or customer types are predominant in your pipeline and this helps to guide future investment. It also provides you with a way to hedge potential risks if your pipeline is over-dependent on a market segment or customer type that is at risk for whatever macro economic factors.
Exercise 11.1
Variety is the Spice
You may have come across this phrase before ‘Variety is the spice of life’. It is a proverbial saying which means that doing and seeing different things makes life more enjoyable and interesting. The phrase first appeared in a poem ‘The Task’ written by William Cowper in 1785. The idea behind this expression is that life would be boring if everything were the same all the time. The full phrase is “Variety is the spice of life that gives it all its flavor”.
The poem compares unseasoned food, which is very bland, with an unexciting life, in which nothing new ever really happens. This seems to be an apt metaphor because too much spice makes food intolerable, just as too much variety makes life stressful and unpredictable.
Extending this metaphor into assessing the variety of your sales pipeline, we can see there are clear benefits for ensuring you have an optimum balance of variety within your pipeline.
To clarify, Variety here does not mean having a significantly heterogeneous mix of market segments or customer types. Rather Variety in this course refers to identifying the potential flavours that exist within your defined market segment or customer persona. The variety could be in form of industry, size of company or geographical location. Finding the optimum balance is important – more of this in the subsequent section – ‘Finding the Optimum Balance of Variety’
Here are some main reasons why pursuing variety in your sales pipeline is critical for your organization:
1. Business Viability: by strategically spreading your pipeline into key market segments and different customer types, you are mathematically increasing your probability of closing more deals. In a scenario where all your pipeline was focused on one market segment or customer type, if something were to affect the growth or activity in that market which reduces the buying power of the players in that market. The effect on the players in that market segment will impact your sales pipeline and could result in significant adverse effects on your business.
2. Risk Mitigation: having all or almost all the sales opportunities focused on one major market segment presents a high risk for your business. Because there is also risk in moving to other market segments or customer types, having an approach there is a systematic and informed way of testing new market segments and customer types is key to finding that optimum balance of variety in your sales pipeline.
3. Business Growth: one of the main ways that businesses grow is by finding other connected market segments or customer types that would find its products and services valuable. Intentionally incorporating Variety in your sales pipeline assessment early on effectively sets your organization up and ready to take advantage of any opportunities that emerge in those connected markets.

Tracking and rewarding the variety of your sales pipeline, sends a strong message to your SalesGroup that you are intentional about diversifying your sales opportunities. As your SalesGroup intentionally pursues this, they help your organization develop a strong competitive muscle as this potentially increase your Total Available Market (TAM). Increase in your TAM directly increases the growth potential of your business.
4. Competitive Advantage: a sales pipeline without enough variety indicates that the organization is likely playing in a ‘red ocean’ market. According to W. Chan Kim and Renee Mauborgne, authors of Blue Ocean Strategy, when companies are playing in a market that is fiercely competitive, it is a Red Ocean. One of the key traits of the Red Ocean is that due to the high competition, there is very little room for differentiating your product/service from competitors. This makes business growth even more challenging. So instead of playing in the ‘Red Ocean’ they encourage organizations to find ways of moving into the ‘Blue Ocean’ where competition is not as fierce, opportunities about and ways for differentiating yourself abound. Interestingly by the normal course of macro-economic forces, business will gravitate from Red Ocean to Blue Ocean. However, intentionally tracking Variety will help your SalesGroup proactively play into potential Blue Oceans giving the first move competitive advantage when other competitors eventually move into that market as well.
5. Motivation & Morale: just like variety in life, brings spice, flavour, and colour. Having variety in your sales pipeline, helps to keep things fresh, exciting, and motivating for your team. The predominant profiles of salespeople suggests that they are highly competitive, always looking for a fresh and new challenge to keep their morales high. Intentionally challenging them to text new market segments and customer types as part of improving your sales pipeline Variety, will be a great way to play to their strengths. As they are continually challenged to stretch and grow, they are likely to be more motivated and motivate team members are more likely to stay with that team for a long time.
6. Change Resilience Culture: challenging your SalesGroup to continue to test new market segments and customer types also helps to increase their resilience to change. This resilience is built, and they keep learning how to adjust their go-to-market strategies, their sales pitch or even sales processes to cater to the unique needs of the different segments and customer types. There are two main ways teams experience change – when change is forced upon the team, or the team creates the change. Building change resilience is more effective and longer lasting when the team is creating the change as against when the team is reacting to a change that is forced upon them. Intentionally driving your SalesGroup to start tracking Variety in your sales pipeline is a great way to create change and by extension build strong, long lasting, change resilience. Such that when the inevitable change is forced upon your SalesGroup, like we all experienced with COVID, your SalesGroup has developed the resiliency muscles to navigate the change.
Case Study
In this video you’ll hear executives from B2B International Market Research talk about the importance of segmenting your customers. As you listen to them share, consider the following:
1. How well would you describe your customer segmentation, do you feel there’s an opportunity to further refine your customer segmentation?
2. When you here that segmentation is a combination of science and art, what percentage do you think is science and what percentage do you think is art?
B2B International Market Research Discussion – Video Link
B2B International is a global, full-service market research firm dedicated to researching business-to-business markets. They help clients to make smarter decisions driven by exclusive insights, empowering them to grow. They have delivered over 4,000 B2B research programs while serving over 900 clients across 145 countries. They have deep industry knowledge researching 22 industry verticals and work with over 200,000 professionals annually.
Challenges with Too Much Variety
As we consider the obvious and compelling reasons to intentionally build variety into your sales pipeline. It is also important to highlight the potential challenges that pursuing variety can present.
These challenges are not to deter you or your team from pursuing Variety in your pipeline. On the contrary they are the factors to consider as you seek to find the right balance on what level of Variety is optimum for your sales organization at this time.
• More Complex GTM: as you seek to target different market segments and customer types, there will be a need to have different go-to-market (GTM) strategies for each of the segments or types. The degree of difference in the GTM strategies would largely depend on the significance of variance between the segments and types.
How to Mitigate This: it is advised to look for connecting market segments where the existing GTM can be slightly adjusted to cater to the new market segments or customer types that your organization is spread into.
• More Complex Sales Process: another challenge with a focus on variety in your pipeline is the potential changes that may need to be made to your sales process. Although your sales process is more of an internal process, the buying journey of your customer is likely to impact your sales process because you want to keep adjusting that process to the journey of your customer. This means that when the market segment or customer type is changed, the customer’s buying journey will change and by extension the sales process will need to change.
How to Mitigate This: just like with GTM starting to drive variety from connected market segments or customer types and then gradually spreading into new terrain is a way to ensure you are finding the optimum balance
• More Complex Enablement: selling to different market segments or customer types will also mean enabling your SalesGroup on how to effectively interact with and influence these different segments and types. This would invariably lead to different enablement programs to ensure the SalesGroup is equipped with what they need to close deals. If the approach to Variety in sales pipeline is not coordinated in a strategic manner, it could lead to major operational inefficiencies.
How to Mitigate This: In addition to being mindful in starting with connected market segments or customer types, another way to find the balance here is to be intentional in team members to your SalesGroup who already have the background in the different market segments you are considering. This reduces the enablement effort required to equip them.
Finding the Optimum Variety for Your Sales Pipeline
Now that you have an increased appreciation for why you need to intentionally drive Variety in your Sales Pipeline, it would be good to explore tactics you can consider in finding the Optimum Variety level for your Sales Pipeline. Here are some steps to following in defining the Ideal Variety Level of your sales pipeline:
1. Macro-economic & Market Trends: there needs to be a conscious and continuous effort to understand the macro-economic factors that affect your business and how this will shape the future market trends. This will help you have a better understanding on the future sustainability of your current market segments and which new ones you should be considering.
2. Leverage Experts’ Opinion: while it is good to review macro-economic indices and market trends, these may sometimes come across as being too generic and not able to effectively highlight what is relevant to where your organization is at the moment. This is where leveraging the opinion of experts becomes valuable. These experts could be internal to your organization or external. The experts help you to distil the large body of information to what is relevant and applicable to your organization. This helps you be more precise and confident in the next steps.
3. Define Ideal Variety Level: based on the outcome of macro economic review and insights from experts, the next step will be to define what your preferred Variety level will be across the key sales stages.
4. Review Current Variety Level: leverage available data and tools to understand what the current variety level of your sales pipeline is. Compare this to your defined variety level and determine the difference between both.
5. Refine Performance Metrics: based on the difference identified set up key performance indicators that will help your SalesGroup influence your pipeline from the current Variety Level to the desired Variety Level.
6. Define GTM Tactics: based on the performance metrics defined, craft relevant go-to-market tactics that will help your SalesGroup reach, attract and convert prospects in line with the performance metrics defined. Some of the GTM tactics to consider include – marketing campaigns, messaging, value proposition, product delivery, distribution, partnerships, sales and after sales support, etc.
7. Implement Tactics and Adjust as Required: implement the GTM tactics and keep monitoring to see how the tactics are influencing the performance metrics defined and adjust as required.
Approach for Variety Diagnostics
The approach we will be adopting for assessing the variety of your sales pipeline will be based on defining what your Ideal Variety Level is and comparing this to your Current Variety Level.
The illustration below, highlights how Variety is included in the 5V Framework.
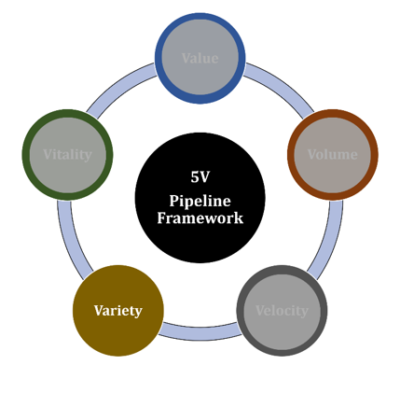
Variety, for this program, refers to the markets/customer mix of your sales pipeline. The dimensions for assessing variety may vary based on your organization’s preference and objectives. Some of the more common dimensions for assessing variety include industry, size of company, geographical location, etc.
The approach we will be using to determine the average velocity of your deals will be based on three principles:
Sales Stage Definition: this refers to how well you have distinctly defined your sales stages. As discussed during a previous course module on Volume, the nomenclature of your stages may differ from that of other organizations based on certain uniqueness of your business and the products/services that you offer.
However, to determine the average velocity for your sales pipeline, you will need to determine 2 key points in your sales cycle:
• Midpoint: you will also need to determine what is the midpoint in your sales pipeline. This would typically be for prospects who have interacted with some of your marketing/sales content and have progressed along your sales stages based on some pre-defined criteria. This could your Sales Qualified Lead (SQL) or Sales Qualified Opportunity (SQO).
• Endpoint: the final point in your sales cycle that needs to be determined is the Endpoint. This would typically be the point where the deal is closed won.
Ideal Variety Level (IVL): this refers to what you would like your sales pipeline variety to be in an ideal situation. This IVL should be informed by the macro-economic indices and market trends that apply to your organization. This would be more reliable if you have also obtained some expert opinions on how those indices and trends apply to your organization. There are various ways to describe the level of variety in your pipeline. Here are some of the common options:
• Geography
• Industry
• Size
Time Horizon: this refers to the review period you want to consider. While this would also depend on the overall length of your sales cycle, some options you could consider are:
• 6 months
• 12 months, or
• 24 months.
Don’t Forget Consistency!
An element of this diagnostic that is critical to its overall success is ensuring that whatever is selected for these principles listed above, become what is used for future evaluations as well. So that the baseline established can be reliable going forward.
Exercise 11.2
Course Manual 12: Vitality Diagnostics
Introduction
This is the last course for this workshop where we will delve into the 5th and final ‘V’ in the 5V Framework. To reiterate, the 5V Framework is used to assess the sales pipeline of your organization. The emphasis is on the sales pipeline because it is a significant method of assessing how improvement in your sales enablement function will impact your sales pipeline, as you implement the new processes provided in this Sales Enablement Program.
The 5V Framework, provides a simple yet comprehensive way to ensure all key elements of your sales pipeline are assessed as part of the Enablement Diagnostics. The 5V Framework consists of Value, Volume, Velocity, Variety, Vitality.
Vitality refers to the likelihood of winning the opportunity and this is evaluated by determining the conversion rate at certain stages along the sales cycle. While there are several sophisticated ways of measuring conversion rates, we will be adopting a more simplified approach, just like we have done in the other course manuals in this Workshop.
The objective of this course is to provide a structured and consistent way for you to assess how conversion rate at specific stages along your sales process This will help you determine the vitality of your pipeline and establish a baseline. This baseline becomes the foundation for evaluating how enhancement of your sales enablement function will impact your sales pipeline over time.
Exercise 12.1
Vim, Vigor and Vitality
Just as extroverts are often considered to be the life of a party, the SalesGroup can be likened to the ‘life’ of an organization, especially a for-profit organization. In the same way blood circulation is vital for the human body’s survival, the flow of cash is essential for an organization’s continued existence. The primary avenue for cash inflow is through sales revenue which shows why the SalesGroup can be considered to be the heart of the organization.
Ensuring the health of the SalesGroup is important for the overall well-being of the organization. Just like a healthy heart serves as a strong indicator of a healthy body.
Continuing with this healthy body analogy, the two major ways of assessing how much life (Vitality) is within a human body is by measuring the level of physical health and mental health within that body. In a similar thought, the two major ways of assessing the level of Vitality within your SalesGroup is my measuring the level of energy (Vim) and the level of enthusiasm (Vigor) within your SalesGroup.
Let us dig deeper into what Vim and Vigor mean:
• Vim: this refers to the level of energy within your SalesGroup and it is often demonstrated by high productivity levels. In many cases, the members of your SalesGroup are meeting and exceeding targets and expectations on many of the leading indicators (refer to Course Manual 4 on Productivity Diagnostics for more details on leading and lagging indicators).
• Vigor: this refers to a high level of enthusiasm within your SalesGroup and it is often demonstrated by a strong positivity and optimism that your team will close deals. It is a strong belief within the SalesGroup that the targets, no matter how ambitious, are achievable.
The ultimate objective is to instill Vitality within your SalesGroup, which essentially means, closing as many deals as possible. However, to achieve this level of Vitality, there needs to be an equal emphasis on Vim and Vigor as these are the building blocks that eventually result in the Vitality that you desire.
Here are some ways to increase the Vim and Vigor within your SalesGroup:
1. Track Leading Indicators: have a system for effectively and regularly tracking your key leading indicators as this will be a good way to identify how the team is progressing towards achieving their targets.
2. Recognize Progress: as the team is achieving these key leading indicators, be sure to regularly highlight them and recognize the amazing work the team is doing. This is especially important if you have sales cycles that are 3 months or longer. Highlighting and recognizing the achievement of leading indicators is a great way to keep the vim and vigor high within your SalesGroup.
3. Celebrate All Wins: celebration of deals won is another great way to increase and sustain vim and vigor within your SalesGroup. Be intentional to celebrate not just the ‘big wins’ but also the ‘small wins.’ As a leader within your SalesGroup, finding ways to make a big deal out of even the ‘small wins’ is important to keep Vim and Vigor high.
4. Emphasize Learnings from Losses: in the cases where the deal is lost, find ways to highlight the learnings from the loss. Be intentional in flipping those losses into learnings, so the team can see the positive side and maintain the required Vim and Vigor to keep winning deals. The ability to always find the learning from every opportunity or deal is an essential quality that the leaders within your SalesGroup should possess.
5. Model High Vim & Vigor – ultimately everything rises and falls on leadership, so it is important that the leaders of your SalesGroup consistently demonstrate the required levels of Vim and Vigor. Team members usually take after their leaders and as your leaders model these attitudes and behaviours, the team members will follow in their steps. It is important that the leaders have this in mind and are ready to ‘show up’ in meaningful, yet authentic ways in their interactions with members of the SalesGroup either in broad meetings or 1:1 discussions.
Case Study
In this video, we will learn about how Sales Momentum is important to the Vitality of your team and some key elements on how to build, sustain and/or recover momentum within your SalesGroup.
As you watch this video, note down the elements of what the speaker calls the ‘momentum equation’ and determine how these elements compare or contrast to Vim, Vigor and Vitality.
Mastering the Art of Sales Momentum – Video Link
Michael McQueen is a multi-award-winning speaker, change strategist and bestselling author of 10 books. With clients including Google, Toyota and Mastercard, he has helped some of the world’s most successful brands navigate uncertainty and stay ahead of the curve. In addition to featuring regularly as a commentator on TV and radio, Michael is a familiar face on the international conference circuit having shared the stage with the likes of Bill Gates, Mel Robbins, and Apple co-founder Steve Wozniak. Michael has spoken to over 500,000 people across 5 continents since 2004, and is known for his engaging, entertaining, and practical conference presentations.

Conversion Rates – What & Why
Maintaining momentum within your SalesGroup is crucial for having sustaining Vim and Vigor which ultimately result in Vitality. One major way of maintaining momentum is by reporting progress leading indicators. This Workshop’s Course Manual 4 provide extensive details on the different leading indicators and how to report on them. – kindly refer to this manual for additional information and context.
In the context of Vitality Diagnostics, we will focus on Conversion Rates as a means of sustaining momentum and driving towards closing more deals. The reasoning behind this is if your SalesGroup is achieving conversion rates at the earlier stages in your sales cycle, then they are more likely to achieve the ultimate sales targets.
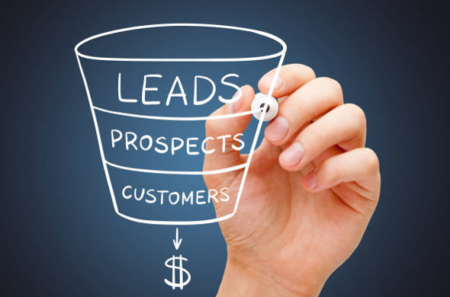
As an operating definition in this Sales Enablement program, Conversion Rate refers to the likelihood of a deal to progress from one stage to another along the sales pipeline. It is determined by computing the ratio of the number of deals in a later stage of your sales process to the number of deals in an earlier stage of your sales process and finding the percentage.
For example, if you have 10 opportunities in the mid-stage of your sales process and you have 50 opportunities in the early stage of your sales process, then your Early to Mid-Stage Conversion rate is 20%.
Here are some reasons why consistently measuring the conversion rate of your sales pipeline is important:
1. Performance Evaluation: it serves as a key performance indicator (KPI) and helps to measure the effectiveness of all the activities performed by your SalesGroup along the customer’s journey. By tracking conversion rates, you can identify areas for improvement. For instance, if the conversion rate is low, it signals that either the leads generated are not of high quality or the sales team needs better deal advancing or closing techniques. Although conversion rates are technically lagging indicators, however, because they are based on a past trend, they can also be used as a leading indicator to predict the potential future outcome. (To learn more about leading and lagging indicators kindly refer to the ‘Productivity Diagnostics’ course manual).
2. Resource Allocation: efficient resource allocation is crucial. A high conversion rate indicates that the existing resources (time, money, personnel) are being utilized effectively. Conversely, a low conversion rate may prompt businesses to re-evaluate their marketing channels, sales processes, or lead nurturing strategies to better understand how the current resource allocations are impact the results and what changes are required to get the results that are desired for the SalesGroup.
3. Cost Efficiency: Closely linked to resource allocation is cost efficiency. A higher conversion rate means acquiring more customers without significantly increasing marketing expenses. Businesses can optimize their spending by focusing on channels that yield better results. This element becomes more critical in this post-pandemic era where many organizations are pushing for higher profitability levels, achieving more while keeping costs low.
4. Revenue Impact: Ultimately, the sales conversion rate directly impacts revenue. It helps to provide an indication of what to expect in the future. Higher conversion rates mean more customers and increased sales. Businesses can set revenue targets based on desired conversion rates. Achieving these targets ensures sustainable growth.
5. Customer Insights: Analyzing conversion data provides insights into customer behavior. Which channels do they prefer? What messaging resonates with them? Which products or services are they finding most valuable and why? These insights can help you and your SalesGroup tailor your activities and initiatives accordingly.

6. Benchmark & Analytics: Comparing conversion rates across different periods or against industry standards will help you benchmark the performance of your SalesGroup and generate analytics which can help provide insight and answers to questions like: “Are we doing better than last quarter?” or “How do we compare to competitors?”
In summary, the conversion rates are like a compass that guides leaders of the SalesGroup towards growth, efficiency, and customer satisfaction.
Approach for Vitality Diagnostics
The illustration below, highlights how Vitality is situated within the 5V Framework:
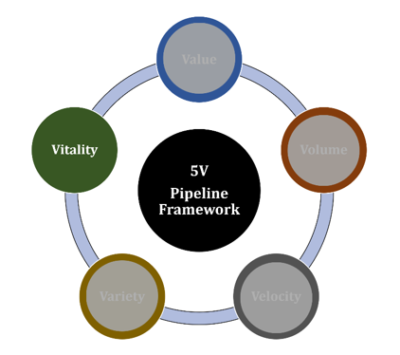
Vitality refers to the likelihood of winning the opportunity and this is evaluated by determining the conversion rate at certain stages along the sales cycle.
The approach we will be using for measuring the Vitality of your sales pipeline will be slightly different from what you may have come across, when it comes to measuring conversion rates.
The typical formula for conversion rate focuses on only the conversion to a closed deal and is calculated with this formula:

And while this formula is correct, it is incomplete when we view it through the lens of Vitality. This is because Vitality is assessing the conversion rate at different stages along the sales process and not just at the end. Measuring at different stages along the sales process will help to create, sustain, or regain the Vim and Vigor which were described in the previous sections.
Accordingly, the Vitality Diagnostics will assess conversion rates at two focal points along the sales process:
• Midcycle Conversion Rate – which measures the conversion rate of opportunities from starting point in the sales process to the midpoint in the sales process.
• End-cycle Conversion Rate – which measures the conversion rate of opportunities from the midpoint n the sales process to the end point in the sales process.
• Full-cycle Conversion Rate – which measures the conversion rate from the starting point in the sales process to the endpoint in the sales process.
The approach we will be using to determine the average velocity of your deals will be based on two principles:
Sales Stage Definition: this refers to how well you have distinctly defined your sales stages. As discussed during the previous course module on Volume and Velocity, the nomenclature of your stages may differ from that of other organizations based on certain uniqueness of your business and the products/services that you offer.
However, to determine the conversion rates for your sales pipeline, you will need to determine 3 key points in your sales cycle:
• Starting Point: identifying which point in your sales pipeline you will consider to be the starting point of your ‘top of funnel’. For your sales organization, this starting point could be the point where ‘leads’, prospects who have shown some interest in knowing more about your product/services, are identified.
• Midpoint: you will also need to determine what is the midpoint in your sales pipeline. This would typically be for prospects who have interacted with some of your marketing/sales content and have progressed along your sales stages based on some pre-defined criteria. This could your Sales Qualified Lead (SQL) or Sales Qualified Opportunity (SQO).
• Endpoint: the final point in your sales cycle that needs to be determined is the Endpoint. This would typically be the point where the deal is closed won.
Time Horizon: this refers to the review period you want to consider. While this would also depend on the overall length of your sales cycle, some options you could consider are:
• 6 months
• 12 months, or
• 24 months.
Target/Assumed Conversion Rates: this informs that you need to have a basis for evaluating your actual conversion rates. This basis could either be the average conversion rates for the previous years, if available or assumed conversion rates based on industry standards or competitor intelligence.
Remember Consistency
An element of this diagnostic that is critical to its overall success is ensuring that whatever you decide for the principles listed above, become what is used for future evaluations as well. So that the baseline established can be reliable going forward.
Exercise 12.2
Project Studies

Project Study (Part 1) – Customer Service
The Head of this Department is to provide a detailed report relating to the Enablement Diagnostics process that has been implemented within their department, together with all key stakeholders, as a result of conducting this workshop, incorporating process: planning; development; implementation; management; and review. Your process should feature the following 12 parts:
01. SalesGroup Definition
02. Team Diagnostics
03. Target Diagnostics
04. Productivity Diagnostics
05. Content Diagnostics
06. Training Diagnostics
07. Technology Diagnostics
08. Value Diagnostics
09. Volume Diagnostics
10. Velocity Diagnostics
11. Variety Diagnostics
12. Vitality Diagnostics
Please include the results of the initial evaluation and assessment.

Project Study (Part 2) – E-Business
The Head of this Department is to provide a detailed report relating to the Enablement Diagnostics process that has been implemented within their department, together with all key stakeholders, as a result of conducting this workshop, incorporating process: planning; development; implementation; management; and review. Your process should feature the following 12 parts:
01. SalesGroup Definition
02. Team Diagnostics
03. Target Diagnostics
04. Productivity Diagnostics
05. Content Diagnostics
06. Training Diagnostics
07. Technology Diagnostics
08. Value Diagnostics
09. Volume Diagnostics
10. Velocity Diagnostics
11. Variety Diagnostics
12. Vitality Diagnostics
Please include the results of the initial evaluation and assessment.

Project Study (Part 3) – Finance
The Head of this Department is to provide a detailed report relating to the Enablement Diagnostics process that has been implemented within their department, together with all key stakeholders, as a result of conducting this workshop, incorporating process: planning; development; implementation; management; and review. Your process should feature the following 12 parts:
01. SalesGroup Definition
02. Team Diagnostics
03. Target Diagnostics
04. Productivity Diagnostics
05. Content Diagnostics
06. Training Diagnostics
07. Technology Diagnostics
08. Value Diagnostics
09. Volume Diagnostics
10. Velocity Diagnostics
11. Variety Diagnostics
12. Vitality Diagnostics
Please include the results of the initial evaluation and assessment.

Project Study (Part 4) – Globalization
The Head of this Department is to provide a detailed report relating to the Enablement Diagnostics process that has been implemented within their department, together with all key stakeholders, as a result of conducting this workshop, incorporating process: planning; development; implementation; management; and review. Your process should feature the following 12 parts:
01. SalesGroup Definition
02. Team Diagnostics
03. Target Diagnostics
04. Productivity Diagnostics
05. Content Diagnostics
06. Training Diagnostics
07. Technology Diagnostics
08. Value Diagnostics
09. Volume Diagnostics
10. Velocity Diagnostics
11. Variety Diagnostics
12. Vitality Diagnostics
Please include the results of the initial evaluation and assessment.

Project Study (Part 5) – Human Resources
The Head of this Department is to provide a detailed report relating to the Enablement Diagnostics process that has been implemented within their department, together with all key stakeholders, as a result of conducting this workshop, incorporating process: planning; development; implementation; management; and review. Your process should feature the following 12 parts:
01. SalesGroup Definition
02. Team Diagnostics
03. Target Diagnostics
04. Productivity Diagnostics
05. Content Diagnostics
06. Training Diagnostics
07. Technology Diagnostics
08. Value Diagnostics
09. Volume Diagnostics
10. Velocity Diagnostics
11. Variety Diagnostics
12. Vitality Diagnostics
Please include the results of the initial evaluation and assessment.

Project Study (Part 6) – Information Technology
The Head of this Department is to provide a detailed report relating to the Enablement Diagnostics process that has been implemented within their department, together with all key stakeholders, as a result of conducting this workshop, incorporating process: planning; development; implementation; management; and review. Your process should feature the following 12 parts:
01. SalesGroup Definition
02. Team Diagnostics
03. Target Diagnostics
04. Productivity Diagnostics
05. Content Diagnostics
06. Training Diagnostics
07. Technology Diagnostics
08. Value Diagnostics
09. Volume Diagnostics
10. Velocity Diagnostics
11. Variety Diagnostics
12. Vitality Diagnostics
Please include the results of the initial evaluation and assessment.

Project Study (Part 7) – Legal
The Head of this Department is to provide a detailed report relating to the Enablement Diagnostics process that has been implemented within their department, together with all key stakeholders, as a result of conducting this workshop, incorporating process: planning; development; implementation; management; and review. Your process should feature the following 12 parts:
01. SalesGroup Definition
02. Team Diagnostics
03. Target Diagnostics
04. Productivity Diagnostics
05. Content Diagnostics
06. Training Diagnostics
07. Technology Diagnostics
08. Value Diagnostics
09. Volume Diagnostics
10. Velocity Diagnostics
11. Variety Diagnostics
12. Vitality Diagnostics
Please include the results of the initial evaluation and assessment.
Project Study (Part 8) – Management
The Head of this Department is to provide a detailed report relating to the Enablement Diagnostics process that has been implemented within their department, together with all key stakeholders, as a result of conducting this workshop, incorporating process: planning; development; implementation; management; and review. Your process should feature the following 12 parts:
01. SalesGroup Definition
02. Team Diagnostics
03. Target Diagnostics
04. Productivity Diagnostics
05. Content Diagnostics
06. Training Diagnostics
07. Technology Diagnostics
08. Value Diagnostics
09. Volume Diagnostics
10. Velocity Diagnostics
11. Variety Diagnostics
12. Vitality Diagnostics
Please include the results of the initial evaluation and assessment.
Project Study (Part 9) – Marketing
The Head of this Department is to provide a detailed report relating to the Enablement Diagnostics process that has been implemented within their department, together with all key stakeholders, as a result of conducting this workshop, incorporating process: planning; development; implementation; management; and review. Your process should feature the following 12 parts:
01. SalesGroup Definition
02. Team Diagnostics
03. Target Diagnostics
04. Productivity Diagnostics
05. Content Diagnostics
06. Training Diagnostics
07. Technology Diagnostics
08. Value Diagnostics
09. Volume Diagnostics
10. Velocity Diagnostics
11. Variety Diagnostics
12. Vitality Diagnostics
Please include the results of the initial evaluation and assessment.

Project Study (Part 10) – Production
The Head of this Department is to provide a detailed report relating to the Enablement Diagnostics process that has been implemented within their department, together with all key stakeholders, as a result of conducting this workshop, incorporating process: planning; development; implementation; management; and review. Your process should feature the following 12 parts:
01. SalesGroup Definition
02. Team Diagnostics
03. Target Diagnostics
04. Productivity Diagnostics
05. Content Diagnostics
06. Training Diagnostics
07. Technology Diagnostics
08. Value Diagnostics
09. Volume Diagnostics
10. Velocity Diagnostics
11. Variety Diagnostics
12. Vitality Diagnostics
Please include the results of the initial evaluation and assessment.

Project Study (Part 11) – Logistics
The Head of this Department is to provide a detailed report relating to the Enablement Diagnostics process that has been implemented within their department, together with all key stakeholders, as a result of conducting this workshop, incorporating process: planning; development; implementation; management; and review. Your process should feature the following 12 parts:
01. SalesGroup Definition
02. Team Diagnostics
03. Target Diagnostics
04. Productivity Diagnostics
05. Content Diagnostics
06. Training Diagnostics
07. Technology Diagnostics
08. Value Diagnostics
09. Volume Diagnostics
10. Velocity Diagnostics
11. Variety Diagnostics
12. Vitality Diagnostics
Please include the results of the initial evaluation and assessment.

Project Study (Part 12) – Education
The Head of this Department is to provide a detailed report relating to the Enablement Diagnostics process that has been implemented within their department, together with all key stakeholders, as a result of conducting this workshop, incorporating process: planning; development; implementation; management; and review. Your process should feature the following 12 parts:
01. SalesGroup Definition
02. Team Diagnostics
03. Target Diagnostics
04. Productivity Diagnostics
05. Content Diagnostics
06. Training Diagnostics
07. Technology Diagnostics
08. Value Diagnostics
09. Volume Diagnostics
10. Velocity Diagnostics
11. Variety Diagnostics
12. Vitality Diagnostics
Please include the results of the initial evaluation and assessment.
Program Benefits
Customer Service
- Customer retention
- Relevant messaging
- Target achievement
- Customer satisfaction
- Revenue growth
- Increased proficiency
- Improved processes
- Optimized technology
- Continuous learning
- Enhanced communication
Marketing
- Stronger brand
- Market growth
- Targeted marketing
- Increased visibility
- Consistent messaging
- Reliable leads
- Channel optimization
- Increased demand
- Partnership growth
- Sales alignment
Management
- Consistent strategy
- Cost optimization
- Salespeople retention
- Reliable forecasts
- Data Insights
- Informed decisions
- Improved planning
- Increased profitability
- Improved leadership
- Team collaboration
Client Telephone Conference (CTC)
If you have any questions or if you would like to arrange a Client Telephone Conference (CTC) to discuss this particular Unique Consulting Service Proposition (UCSP) in more detail, please CLICK HERE.